HTF Consolidation: Key Alerts, Vital Supports, FOMC & Geopolitic__________________________________________________________________________________
Technical Overview – Summary Points
__________________________________________________________________________________
Momentum: Strong bullish signal across sector indicators (Risk On / Risk Off Indicator), especially on daily and 12H. Momentum remains robust within consolidation.
Support/Resistance : Key zone at 104429–102600 (short- and long-term pivots); major resistance at 106000–109950.
Volume : Normal to high, with peaks at major supports on 1H/2H (potential sign of absorption/defensive buying).
Behavior across timeframes :
ISPD neutral on most TFs, only 2H gives a buy signal (possible tactical bounce).
All LTFs (≤1H) are down, HTFs (≥1D) are up → corrective structure, awaiting catalyst.
__________________________________________________________________________________
Strategic Summary
__________________________________________________________________________________
Overall bias : Underlying bullish, but market consolidates on key technical zones.
Opportunities : Swing buy at 104429/102600, tight stop below 100k, take profit 109950+.
Risk zones : Clear break below 100350/100000 invalidates the setup (risk-off or tactical short).
Macro catalysts : FOMC, Iran–Israel tensions, economic calendar (monitor Jobless Claims, Crude, Fed statement).
Action plan :
Capital preservation before FOMC.
Tactical entries only on key support; tight stops, prudent sizing.
No breakout chasing without macro/fundamental validation.
Hedge/volatility play via options possible (IV low, caution for post-event spike).
__________________________________________________________________________________
Multi-Timeframe Analysis
__________________________________________________________________________________
1D/12H/6H :
Supports: 104429, 102626, 100353.
Resistances: 106000–109952.
Risk On / Risk Off Indicator = Strong Buy.
No extreme volume, ISPD neutral; mature range.
HTF consolidation, bullish underlying momentum.
4H/2H :
Key zone at 104429–102600 (technical defense); 2H is the first true behavioral buy signal.
Very high volume at support, favoring a "spike bounce" scenario.
“Up” confluence on Risk On / Risk Off Indicator, volume, and ISPD for short-term bounce.
MTFTI: 2H is one of the “Up” TFs; LTFs remain Down.
1H/30min/15min :
Structurally bearish, elevated volume (absorption/protection) on 1H.
No behavioral excesses.
Intraday weakness but supports tested and defended.
__________________________________________________________________________________
Macro / Fundamental analysis
__________________________________________________________________________________
Market in wait-and-see mode : FOMC upcoming, no hike expected but high impact from tone/forward guidance (increased volatility risk).
Geopolitics : Iran–Israel escalation, risk-off climate, nervous risk assets.
On-chain : Supports tested (STH ~97.6k). Persistent LTH accumulation. Low option IV → underpriced volatility risk.
Risk/Reward swing : 2:1/3:1 buying 104429–102600, stop < 100k, take profit 109950+.
__________________________________________________________________________________
Final synthesis: Bias, Opportunities, Risks
__________________________________________________________________________________
Directional bias : Bullish on HTF, neutral/undecided on short-term. Wait-and-see until strong catalyst confirmed (FOMC, geopolitical de-escalation).
Opportunities : Tactical buy on supports, profit-taking on resistance or confirmed breakout.
Risks : Invalidation below 100k; sudden spike in FOMC/Israel–Iran escalation = risk-off or selloff.
Recommended action : Protect capital before FOMC. Swing tactical entry only on confirmed support. No breakout chasing without macro validation. Leverage potential post-FOMC vol spike via options.
BTCUSDT.3S trade ideas

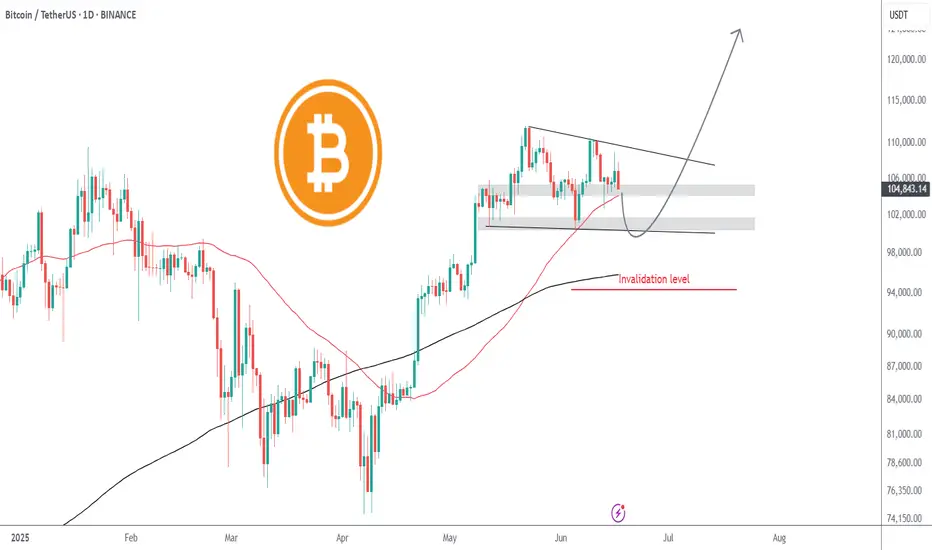
Bitcoin to revisit $100k | Summer price target = $120kGeopolitical tension is causing fear in the markets. Today, Bitcoin fell from $107.7k to current price $105k with no sign of buyer support whatsoever, printing 11 consecutive H1 red candles intraday. Like a hot knife through butter.
At $105k, there is very little support. Sell volume absolutely overshadowed the tiny buy volume. Bulls have yet to close a green candle. I believe in the next few hours Bitcoin will be trading at $104k, followed by the first stop $102k.
$102k can serve as an entry point, depending on how price reacts. $100k is the optimal entry point for maximum profit, after mass liquidations. Retail traders are confident that the liquidity hunt is over after the initial tap, placing stops and liquidation levels at $100k.
Invalidation level will be beyond the 200SMA. The 200SMA have historically proven itself time and time again as a safe zone during rallies after golden crosses.
BTC: Daily Timeframe 14/06/25Spot buyer again ~ $93k aka 0.5 retrace of the weekly leg
Higher timeframes swept (ATH) with confirmed deviation.
Expecting a corrective to continue healthy trend before more bullish continuation
If we set a lower high on the weekly, that’ll flip my bias and a far deeper corrective leg would be likely.
Right now long term BTC is the only crypto coin I hold as long term conviction remains unchanged its direction is up and to the right for many years to come.
#BTC Update and Altcoin StrategyCRYPTOCAP:BTC Keeping it simple.
If Bitcoin breaks above the current level, BTC will hit a new ATH, and altcoins may face a short-term hit but will recover, following Ethereum’s lead.
If BTC gets rejected, altcoins will likely take another hit and recover with Ethereum.
What’s the common pattern here?
Altcoins are setting up for a sustained bullish move.
It’s just a matter of time.
This is not the market to over-leverage.
Protect your capital and position yourself wisely for the real opportunities ahead.
Patience now will pay off later.
Cheers.
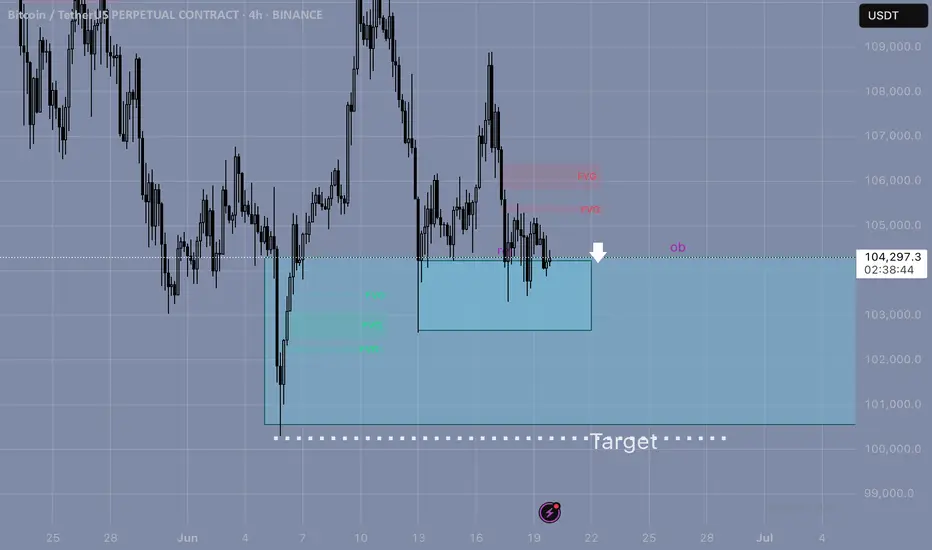
Squeeze Building in BTC – Targeting 100,500 ShortPrice is coiling between interest zones above and a heap of liquidity below. Expecting an impulsive break—looking to short down to ~100,500.
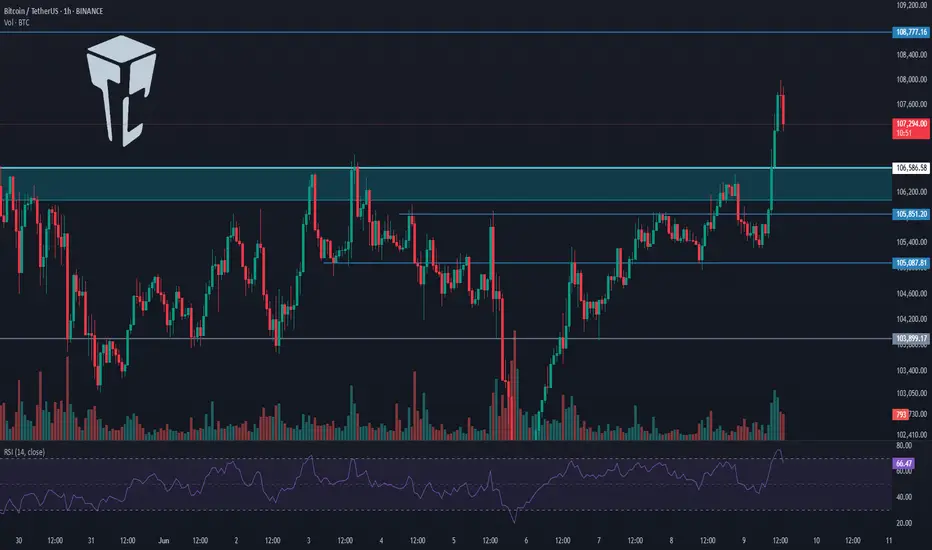
TradeCityPro | Bitcoin Daily Analysis #112👋 Welcome to TradeCity Pro
Let’s dive into the analysis of Bitcoin and key crypto indexes. As usual, in this analysis I’ll review the futures triggers for the New York session.
⏳ 1-Hour Timeframe
Yesterday, Bitcoin finally broke through the resistance zone it had formed. As you can see, it pushed through this level with strong buying volume and is now moving toward 108777.
🔍 If you entered a position using yesterday’s triggers, I’d be glad to hear about it in the comments. Your feedback gives me great energy.
⭐ Today, I cannot provide a specific trigger because the market has already made its move. If you do not have an open position, it is better to wait for a new market structure and then identify a fresh trigger.
💥 At the moment, I expect Bitcoin’s upward movement to continue toward 108777. Market volume is strongly supporting the trend and is aligned with price action. RSI is also in the overbought zone, indicating strong buyer presence. If RSI stays above 70, the sharp upward movement is likely to continue.
📊 If a market correction occurs, the price could pull back to the zone I marked. In future analyses, I will review triggers for both trend continuation and possible reversals.
👑 BTC.D Analysis
Bitcoin dominance formed a higher low above 6449 and has now broken the 6467 resistance, signaling the beginning of a new bullish leg.
⚡️ If this upward move continues, Bitcoin dominance may climb further. However, if a pullback to 6467 happens, altcoins could see a strong upward move as well.
📅 Total2 Analysis
Looking at Total2, this index was supported at 114 yesterday and is now moving toward 117.
📈 If Bitcoin dominance starts to drop, Total2 will likely break above 117 and begin a main bullish trend.
📅 USDT.D Analysis
Now for Tether dominance. After forming a lower high below 479, it broke below the 472 support and is now heading toward 464.
✅ In my view, this movement toward 464 is likely to continue, and as that happens, the overall crypto market is expected to keep moving upward.
❌ Disclaimer ❌
Trading futures is highly risky and dangerous. If you're not an expert, these triggers may not be suitable for you. You should first learn risk and capital management. You can also use the educational content from this channel.
Finally, these triggers reflect my personal opinions on price action, and the market may move completely against this analysis. So, do your own research before opening any position.
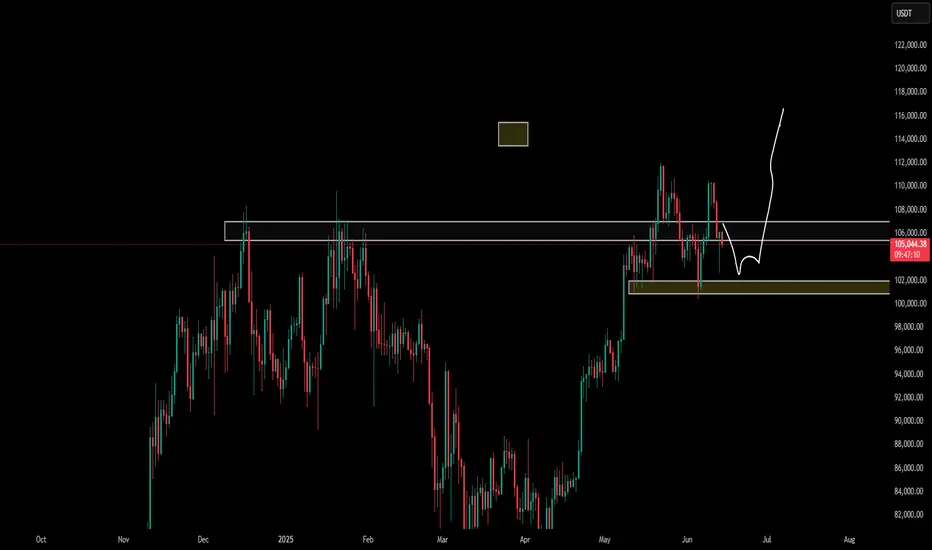
BTC long if it reclaims or holds ### 🔍 Breakdown of Chart:
* Timeframe: 15m BTCUSDT (Bybit)
* Current Trend: Sharp downtrend from the recent highs
* Zone Marked in Blue: Bullish Order Block / Demand Zone
* Yellow Path: Anticipated reclaim and reversal scenario
* White Curve: Possible double bottom (liquidity sweep)
---
### ✅ Why Long Plan Makes Sense:
1. Demand Zone (Blue Block):
This zone has previously caused a strong bullish reaction. It's likely institutional demand may rest here again.
2. Liquidity Grab Below:
Price might sweep the recent low (creating a trap for shorts) before reclaiming. That’s your “double bottom” logic.
3. Reclaim = Confirmation:
Waiting for a reclaim above the zone before longing shows patience and discipline — a smart move to avoid catching a falling knife.
4. Clear Invalidations:
If price fails to reclaim and breaks below the blue zone with momentum, your setup is invalidated — perfect risk control.
---
### ⚠️ Caution:
* If the red bearish OB above (around 104.6–104.8K) is respected, you might face rejection there. Consider partial profits before that area.
* Use confirmation (like a bullish engulfing, BOS, or FVG fill) after reclaim.
* If breaks blue zone then we might enter short

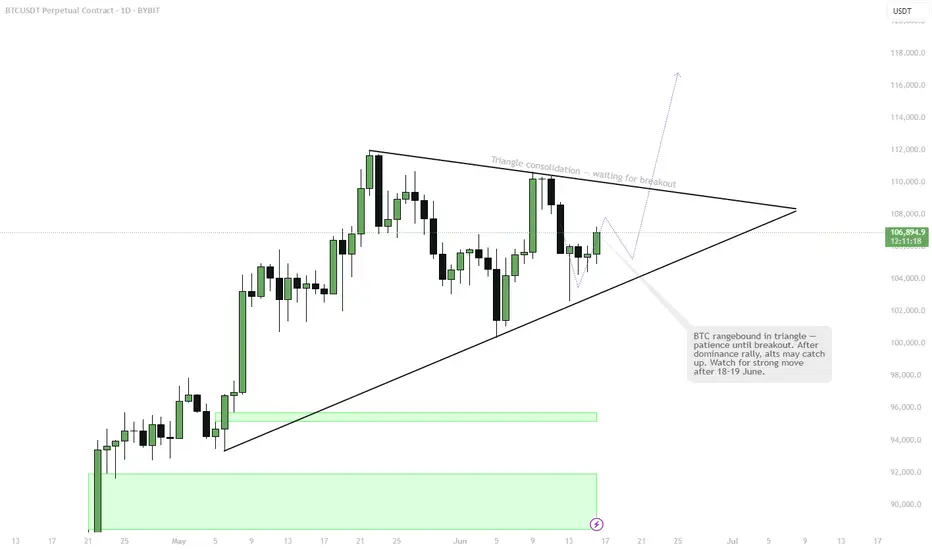
BTC is stuck in a tightening triangle — compression phaseVolatility building up into June 18–19.
Expect a big breakout.
Main scenario: breakout to the upside with a “God Candle” and new momentum for altcoins after prolonged BTC dominance.
Alts have been suppressed, but that’s part of the setup — don’t get tricked by the fake moves.
Stay patient, don’t lose focus, and be ready for a sharp move!
It is possible that Bitcoin is finishing wave 4It is possible that
Bitcoin is finishing wave 4
Will expand to wave 5
The target is more than 250,000 dollars
#Bitcoin Update - 19.06.2025🚨 #Bitcoin Update – 19.06.2025 🚨
For the first time after FOMC, Bitcoin is showing an unusual calm – and yes, that’s pretty strange, especially considering the ongoing tensions in the Middle East. But let's break it down clearly and from my point of view. 👇
🔹 Arrow #2 remains a crucial resistance level. Price *did* break above it, but there was no strong confirmation or momentum – it got rejected and pulled back.
🔸 Currently, Bitcoin is stuck in a range, moving between Arrow #2 and Arrow #4 (marked by black lines). This range-bound behavior might continue for a while unless we get a strong breakout.
🌟 Now, pay close attention to the yellow lines under Arrow #3 and Arrow #5 – these are key support zones. As long as these hold, bullish sentiment remains intact.
✅ Also, Arrow #6 (black line) is the last strong support – only if this breaks, we can start talking about a potential bearish move or at least a deeper retest.
📈 In my opinion, we might see another attempt to break the All-Time High (ATH) very soon. Price still looks bullish, and as long as we hold above Arrow #6, there’s no clear sign of weakness.
🎯 Summary:
* Market is calm but not dead.
* Still bullish unless Arrow #6 breaks.
* Range between Arrow #2 & Arrow #4 continues.
* Eyes on next ATH attempt! 🚀
🧠 Stay patient. Stay focused.
📊 Next up: ETH and Bitcoin Dominance analysis coming soon – make sure you follow so you don’t miss the update!
\#Crypto #BTC #Trading #BitcoinAnalysis #CryptoUpdate #BTCUSDT

Bitcoin (BTC): Buyers Accumulating Near 200EMA | Pump Incoming?Buyers are showing dominance near the 200EMA, which might lead the price to upper zones and give us a good bounce from here.
What we are expecting is some sort of sideways or neutral movement before the weekend hits, and during the weekend we are looking to see strong upside movement.
Swallow Academy

HolderStat┆BTCUSD forming a triangleBINANCE:BTCUSDT is bouncing from the 104 k pennant foot on trend support, turning squeeze into bullish advance. Holding the rising line preserves upside bias; clearing 111 k unlocks 121 k and ATH chase 🏆

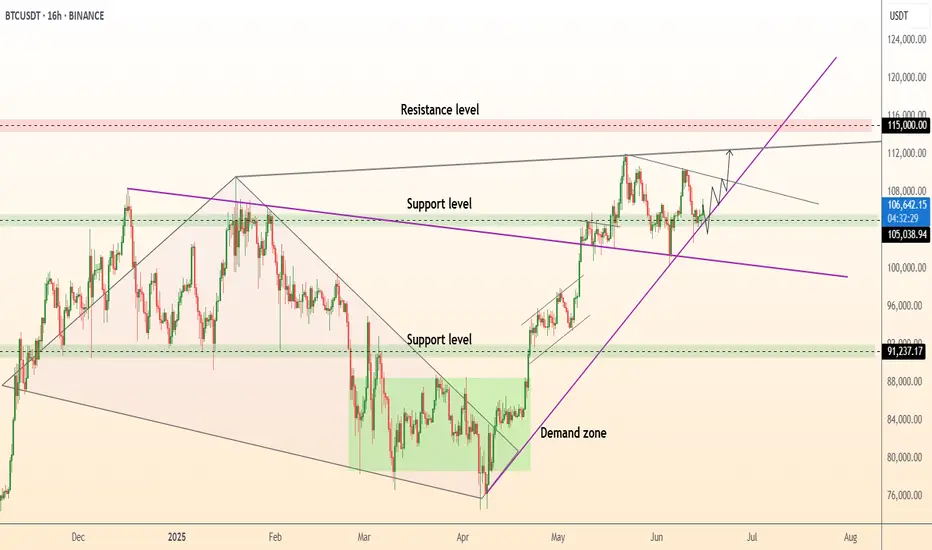
Bitcoin - Plan for summer 2025 (no new ATH, big range!)Bitcoin's price action is statistically very boring during summer seasons! Usually high volatility kicks in in September. I think we cannot really expect a new all-time high in the next few weeks. Instead, we should see a big range. Why? Let's take a look at technical analysis.
On the chart we can clearly see a blue trendline, and price went below this trendline at the end of May. This indicates that the uptrend is over and a consolidation/distribution phase is in progress. This phase is usually represented as a bull flag, triangle, rectangle, or wedge. When we look at the current price action, it looks like a bullish flag consolidation pattern. In this case we will probably see multiple liquidity sweeps below the previous swing lows to kick out early longs.
There are 2 types of traders. The first one they love to trade ranges, and the second they love to trade breakouts and higher volatility environments. Currently I think Bitcoin is creating a range, so do not expect any crazy movements until this range is valid.
Bullish flags are usually bullish patterns, but often they break down and act like bearish patterns. So what would happen if this bullish flag breaks down? That would send the price of Bitcoin to the 0.618 FIB, which is at 88,882 USDT. What is this bullish flag breaks out? That would send the price of Bitcoin to 116,000 to 125,000, but to establish this price we first need to see low of the bull flag, which is not confirmed yet. I will definitely inform you in one of my next analyses, so write a comment with your altcoin + hit the like button, and I will make an analysis for you in response.
At the end of each post, I share my professional trading tips: "If you realize you’ve made a poor trading decision, exit before the stop loss forces you out."
Trading is not hard if you have a good coach! This is not a trade setup, as there is no stop-loss or profit target. I share my trades privately. Thank you, and I wish you successful trades!
DeGRAM | BTCUSD formed the rising bottom📊 Technical Analysis
● BTC rebounded exactly at the purple long-term trend-line and green 102.5-104 k demand, reclaiming the 105-106 k support band; the old wedge cap is now acting as a floor.
● Price is coiling in a 16-h bull flag beneath 108 k; its 1.618 projection intersects the channel roof/ red supply at 111.6-115 k, while rising lows keep momentum pointed up.
💡 Fundamental Analysis
● U.S. spot-BTC ETFs attracted about $240 m of net subscriptions on 14 Jun, ending the outflow streak and signalling renewed institutional demand as exchange reserves slide to multi-year lows.
● Benchmark 10-yr Treasury yields are back under 4.45 %, easing dollar pressure and helping risk assets rebuild after the FOMC spike.
✨ Summary
Buy 105-106 k; flag breakout above 108 k targets 111.6 k → 115 k. Invalidate on a close below 101.8 k.
-------------------
Share your opinion in the comments and support the idea with a like. Thanks for your support!
BTC to 102.5k game plan. here you can see that bitcoin is trading within a zone that will likely lead to a breakout to the downside, unless geopolitical tensions somehow get freed up. I believe that we will see 102.5k by the end of the month, if not sooner.
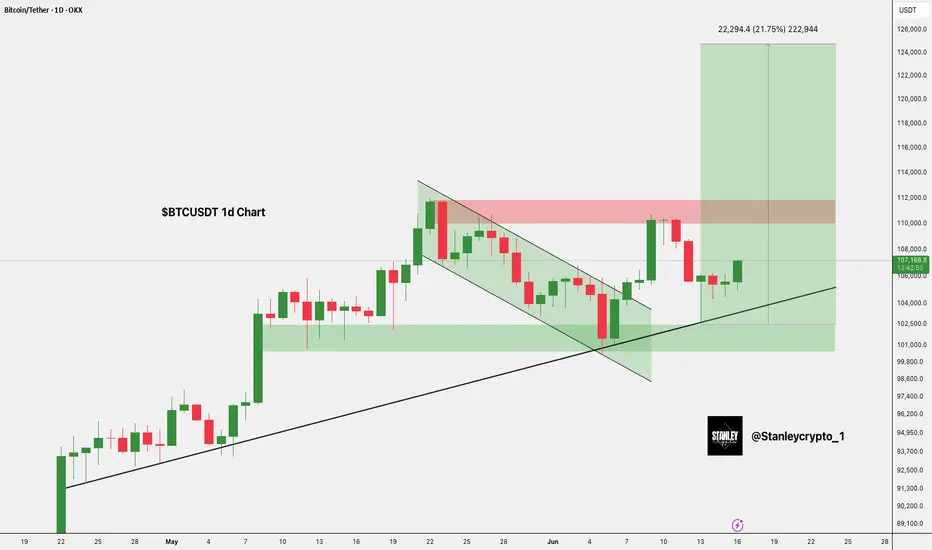
BTC: Bias Map 18/06/25Daily Bias Map:
- Bitcoin is trading within a HTF range between 110,700 and 100,700.
- Mid range sits around 105,700 aligning with a 4H bearish fair value gap.
- Higher timeframes are trending down no justification for looking at longs here. Especially after losing 106,500
- FOMC today at 7PM UK time
- Expecting major volatility looking to short any spike into resistance or inefficiencies.
- A scalp long might be valid around 104,115 (demand zone + 30min SFP), but that’s tactical only.
- No reason to flip bullish geopolitical tension (Israel/Iran) adds further downside risk.
- Main plan: scalp long if triggered early, then look to short FOMC-driven upside move.
- Risk is tight. If setups aren’t clean, I’ll sit out and wait for the FOMC dust to settle.

BTC at Risk Amid Technical Weakness and Geopolitical TensionsBitcoin has failed to break above the previous high of $110,264, and instead formed a lower high at $108,802, signaling potential weakness in the current structure. From a technical standpoint, this breakdown increases the likelihood of a bearish move — especially with today’s FOMC interest rate decision on the horizon and escalating geopolitical tensions, including the risk of U.S. involvement in the Middle East conflict.
We're also seeing increased volatility and market sensitivity to news, which can make short-term trading riskier than usual. Bitcoin remains inside the red consolidation box — and as previously mentioned, any breakout from this range is likely to be sharp and aggressive (whale-driven). That’s why positioning ahead of the breakout is crucial.
If BTC breaks below $103,608.67 and at the same time Bitcoin Dominance rises above 64.90%, it could be a strong signal that capital is exiting altcoins. In that case, short opportunities in altcoins may offer better setups, as they could drop more significantly than BTC.
🛑 Due to the high volatility and macro uncertainty, keep your risk low, use tight stop-losses, and don’t forget to secure profits quickly.
💬 What’s your take on BTC’s next move? Drop a comment below — let’s discuss! 👇

BTC/USDT Long Trade Setup – 1H Chart AnalysisBTC/USDT Long Trade Setup – 1H Chart Analysis
BINANCE:BTCUSDT
Hello traders! Sharing a recent long entry I took on Bitcoin (BTC/USDT) based on price action and liquidity concepts. This trade is taken on the 1-hour timeframe and aligns with my strategy of combining liquidity sweeps, support zones, and market structure shifts.
---
🔍 Trade Overview:
Entry Price: 104,704 USDT
Stop Loss: 103,660 USDT
Take Profit (Target): 108,349 USDT
Risk-to-Reward Ratio (RRR): Approximately 1:3
---
🧠 Trade Idea Behind the Entry:
As you can see on the chart, BTC had been in a downtrend and recently made a strong move into a key liquidity zone. This zone had previously seen multiple touches and rejections, making it an area of interest for both buyers and sellers.
The price swept liquidity below the previous low (labelled as “Liquidity Sweep $$$”), grabbing stop losses of early buyers and triggering limit orders of smart money. This move into the liquidity zone was followed by a strong bullish reaction – a signal that buyers may be stepping in.
Additionally, the "Break of Structure" (BOS) confirms a potential shift in market direction. The reaction from the liquidity zone indicates that this level is holding as new support.
---
🛠️ Why I Took the Trade:
1. Liquidity Sweep: The wick that pierced the liquidity zone signals stop-hunting and accumulation. These moves often precede a strong reversal.
2. Demand Zone Reaction: After the sweep, the candle closed bullish inside the demand box. This shows buyer strength.
3. Risk Management: The stop loss is set just below the liquidity zone to protect from deeper sweeps while keeping the RR healthy.
4. High Probability Target: The target is placed near the next resistance level around 108,349, which also aligns with a clean imbalance that price may want to fill.
---
📊 Technical Confidence:
Confluence Factors:
✅ Liquidity sweep
✅ Demand zone reaction
✅ Market structure shift
✅ High RR
✅ No immediate resistance till target
This type of setup reflects smart money behavior – first pushing price below structure to grab liquidity and then reversing sharply. The bullish momentum after the sweep gave extra confirmation.
---
🧭 What I’m Watching Now:
I will continue monitoring how price reacts around the 105,500–106,000 range. If momentum continues with higher highs and higher lows, I may trail my stop loss to lock in profits.
---
Let me know what you think of this setup! Have you taken a similar trade or are you waiting for confirmation? Drop your thoughts or charts below 👇
Stay disciplined, manage your risk, and trust the process. 🚀
#Bitcoin #BTCUSD #PriceAction #LiquiditySweep #SmartMoney #CryptoTrading #TradingSetup #TechnicalAnalysis #TradeJournal

btc for long 30m*The content on this analysis is subject to change at any time without notice, and is provided for the sole purpose of assisting traders to make independent investment decisions.
$BTC Breakout Targets $125KCRYPTOCAP:BTC has broken out of a falling wedge and is holding strong above the $103K support zone.
Price is pushing upward toward the key resistance at $110K– $112K.
A breakout above this zone could trigger a move toward $125K.
DYRO, NFA
Using double PAR to perfect entriesUsing double PAR to perfect entries - This is a crash course but can be more involved for continuation trades

BTC/USDT Technical Analysis, 2025-06-20 19:45 UTCBTC/USDT Technical Analysis, 2025-06-20 19:45 UTC
💡 Trade Setup Summary
Pattern Detected: Bullish Hammer at local bottom
Confirmed by bullish candle close above pattern high
Volume Confirmation:
Volume Flow Analysis → Increasing OBV
Current Volume = 5.17, which although lower than the short-term mean, is paired with a positive trend
Order Book & Whale Confirmation:
Whale Bids > 2 BTC detected: 1 order, 3.54 BTC
Order Book Imbalance: 36.84% favoring buyers
Technical Indicators :
✅ Oversold region confirmed (likely RSI < 30, inferred by engine)
✅ Bullish pattern with volume trend confirmation
✅ Order book imbalance > 2%
✅ Whale bid presence
✅ Market pressure shows buyer dominance
✅ OBV increasing
Entry Price: 103146.58
Target (TP): 105646.58
Stop Loss (SL): 102146.58
Risk:Reward Ratio: ~2.5:1
