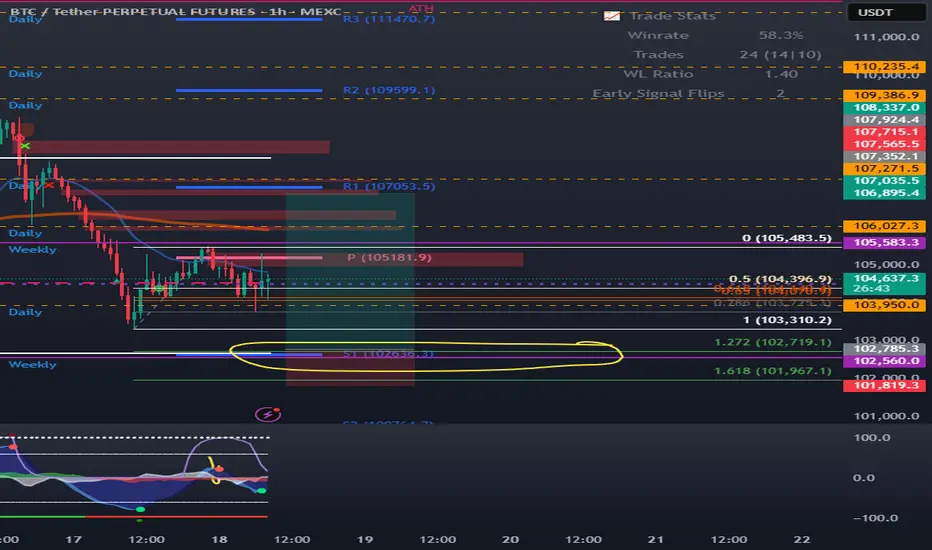
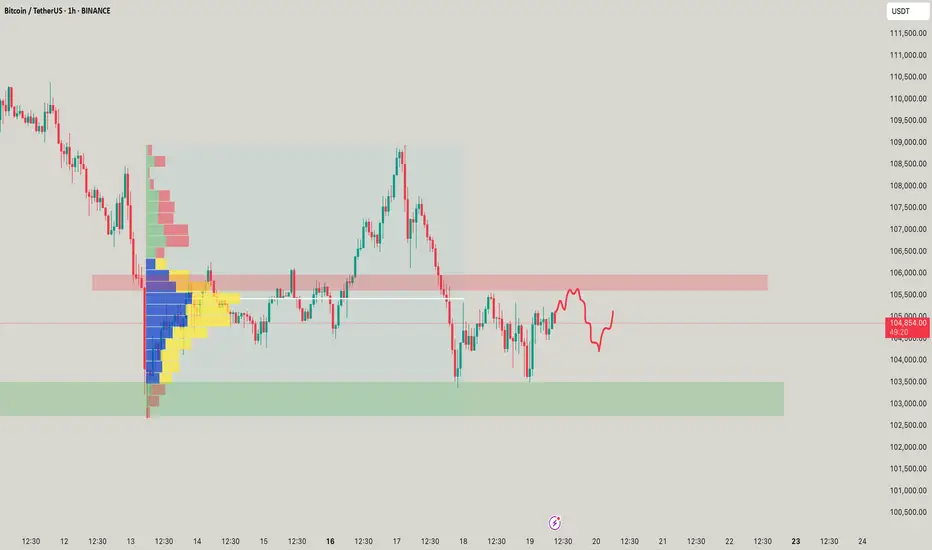
BTC Bitcoin VAL, S1, Weekly, 1.27 confluence at $102,700BTC Bitcoin VAL, S1, Weekly, 1.27 confluence at $102,700
If we do drop more, this is where I'm looking to buy. Lots of support in this area for a bounce back to the POC. A rejection of POC means we may be looking at 100k. Get past it, then target is VAH around 106k.
BTCUSDT.3S trade ideas
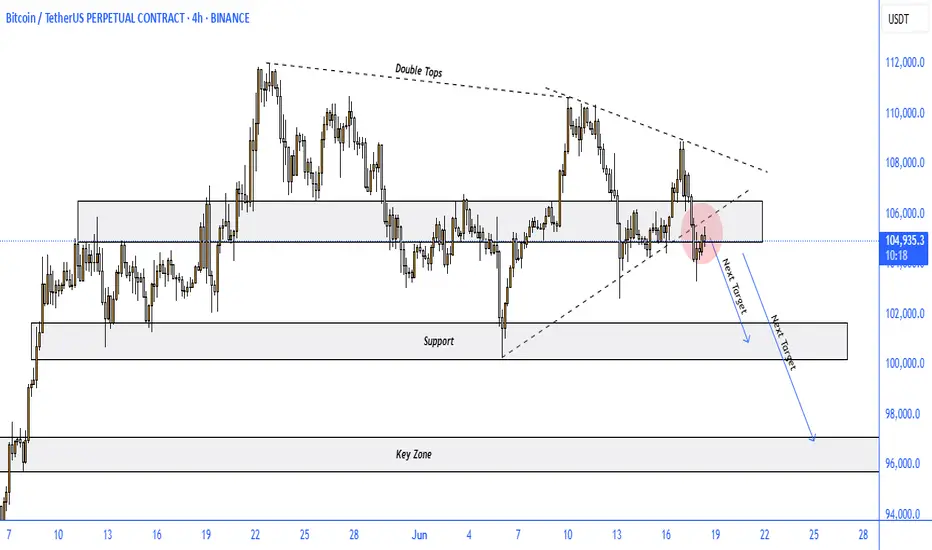
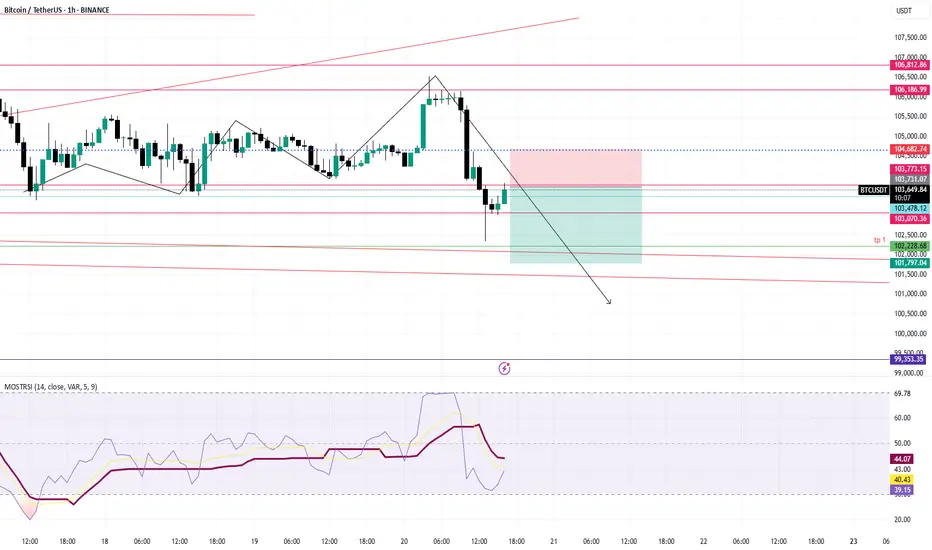
BITCOIN BEARISH SETUPTechnical Analysis Summary:
Pattern Formation: The chart shows a descending triangle pattern with double tops, indicating bearish pressure at resistance levels.
Breakdown Confirmation: Price has broken below a key ascending trendline (shown in dashed line) and retested the breakdown area, forming a bearish rejection (highlighted red zone).
Key Zone: The price is currently trading around $105,075, just under the previous support-turned-resistance zone (~$106,000). This confirms a failed bullish structure and strengthens the bearish outlook.
Targets:
First Target: Around $101,000–102,000, aligning with the next visible support zone.
Second Target: Around $97,000–98,000, which is a major support / key zone based on prior structure.
Bias: Bearish in the short term, as long as price remains below the $106,000 resistance zone.
Trade Setup Outlook:
A short position is implied by the arrows.
Best entries are around retests near $105,500–106,000 with stops above the recent highs (~$107,000).
Conservative profit-taking at the first target, with extended TP near the key support zone.
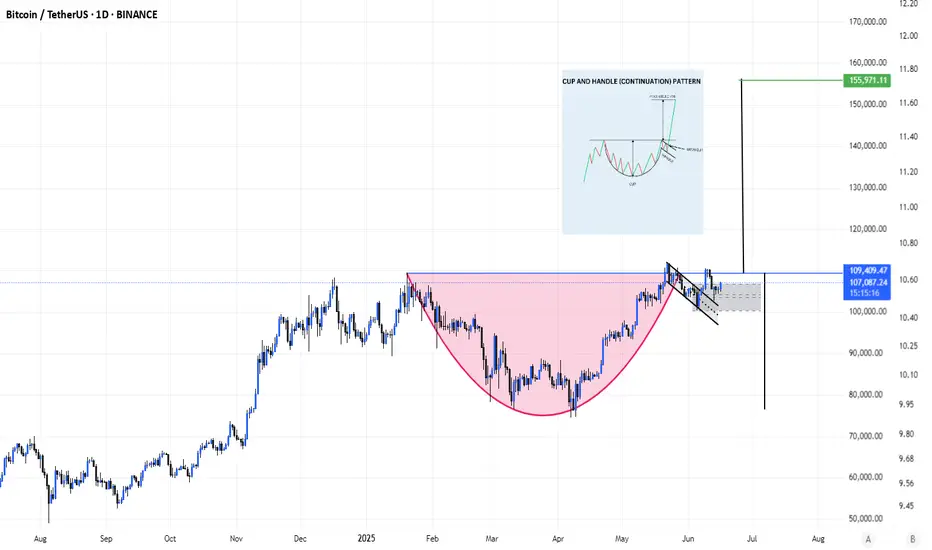
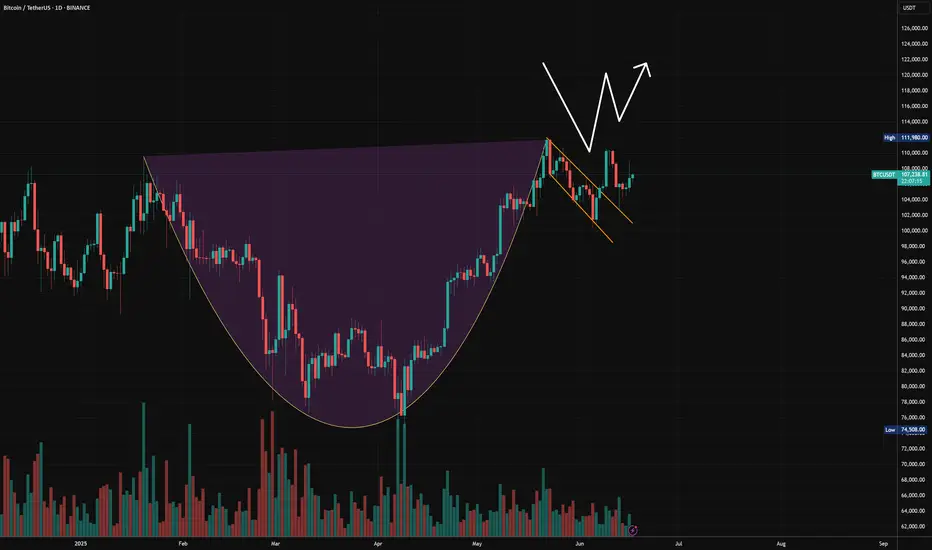
W pattern off the handle. #Bitcoin to 168K.From my most recent post of the Cup & Handle I see a W pattern. Price broke out of the handle to retest to confirm support creating a double bottom.
This is a very good sign to confirm the C&H for this bullish near future.
If we continue upwards and break the psychological resistance zone at 111K, I expect 168K within 3-6 months.
I attached the Cup and Handle analysis to the current.
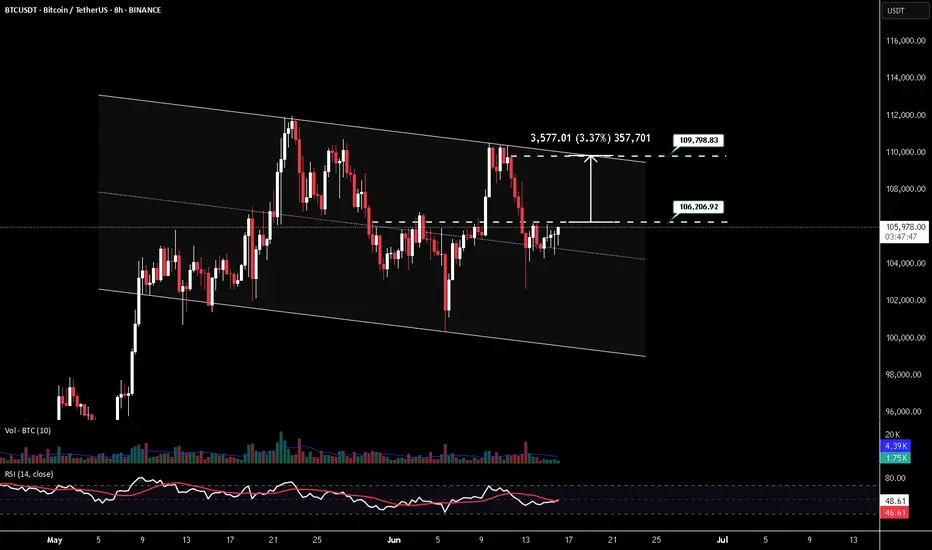
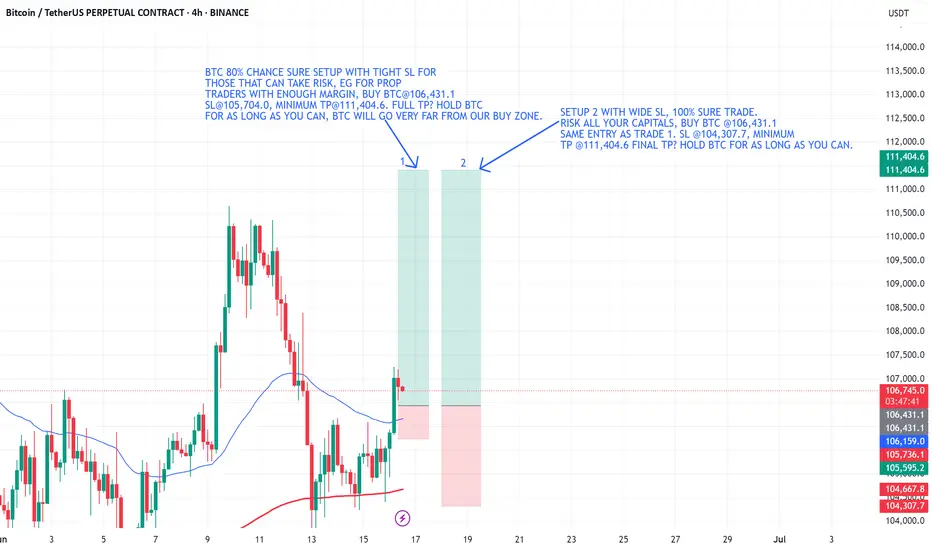
BTCUSDT LONG POSITIONENTRY: 106206.92
TAKE PROFİT : 109798.83
STOP LOSS : 1/3
Do not use high leverage!
Remember cash management (planning)!
Please follow the stop-loss rule!
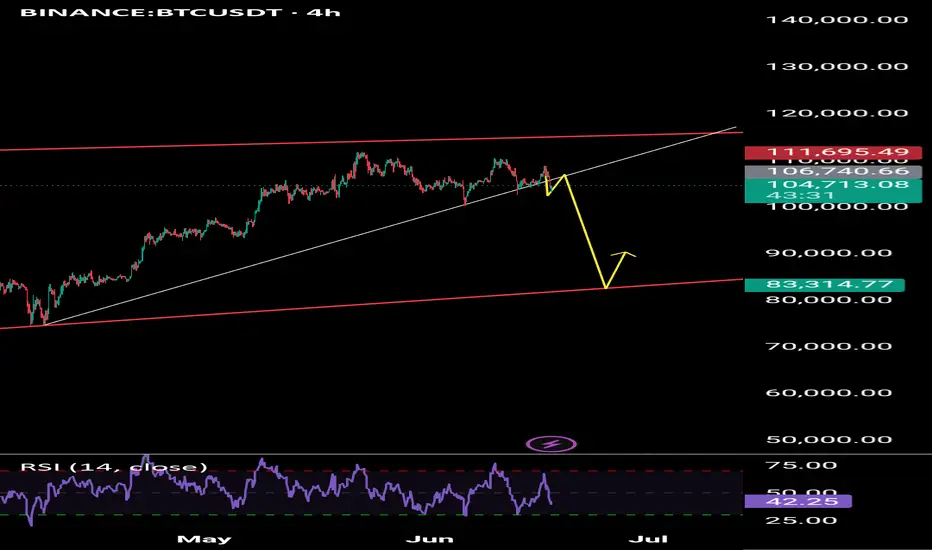
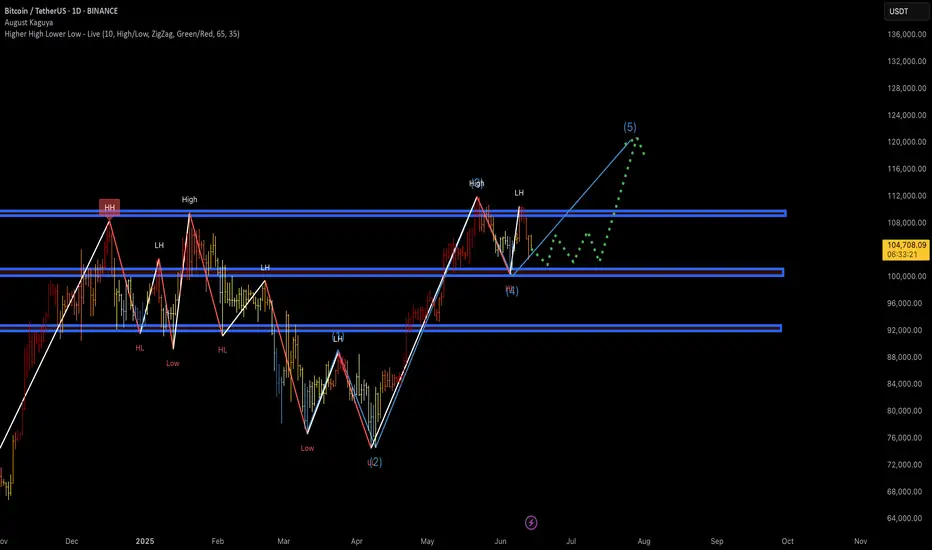
Wave (4) Correction Completed? Wave (5) ImminentBitcoin appears to be completing an Elliott Wave structure, currently sitting around the (4) pullback area with signs of a potential continuation into wave (5) to new local highs. The recent LH and bounce from demand could mark the beginning of the impulsive move.
Key Observations:
✅ Elliott Waves Count (1–2–3–4–5) in Play
Wave (3) completed near ~$113K
Wave (4) correction retraced into the ~$98K support zone
Structure looks corrective (ABC style), typical for wave 4
Wave (5) projection aims towards ~$120K+ based on symmetry
✅ Market Structure
Higher High (HH) → Higher Low (HL) pattern intact
Price respected a key demand zone and bounced
Green dotted line shows potential consolidation → breakout behavior
✅ Support Zones
~$98K = key demand + previous HL
~$92K = macro structure support
Holding these levels = bullish continuation scenario likely
✅ Resistance Ahead
~$113K = recent local high
Break and close above this = wave (5) confirmed
Final TP area ~$120K–124K based on Fibonacci extensions and wave symmetry
🎯 Trade Plan (Idea)
Entry: On confirmation above $106K
Targets:
TP1: $113K (retest)
TP2: $120K
TP3: $124K
Bitcoin long 97kPlanning on a push below 100k over the next few days, I'll be looking for possible entry around 96 - 98k if LTF shows good support.
The monthly open is at 100k so Id expect to see some rejection at that level, there's also a monthly FVG around 97k which price could revisit.
My target will be the BTC highs, areas of interest marked on the chart.

Bitcoin | Long | 3hrsThis technical analysis is for informational and educational purposes only. It does not constitute financial advice. Remember to always research and consult with a professional before making investment decisions. Good luck! 📈💼🚀

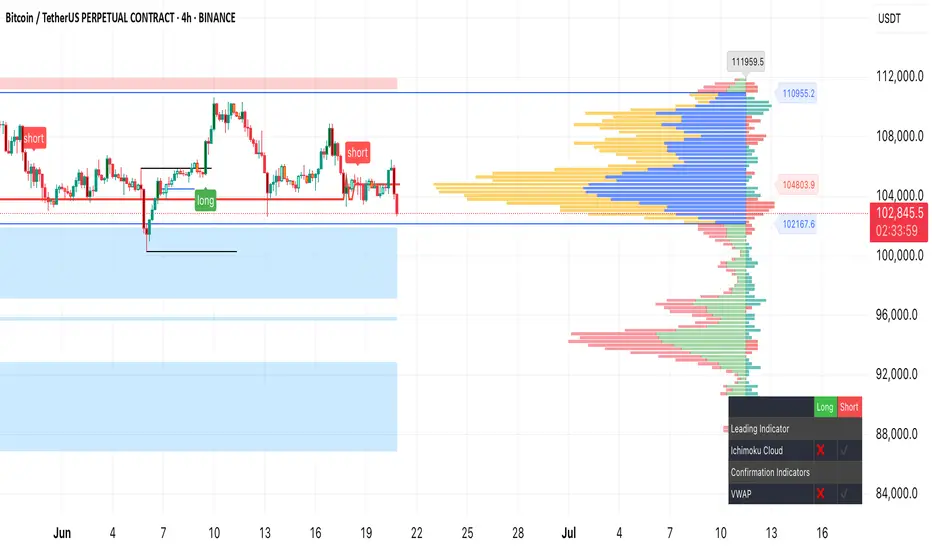
BTCUSDT - 4H Supply-Demand + Order Flow ViewBINANCE:BTCUSDT is struggling to hold above the 103K zone, which has now flipped into resistance. Price recently tapped into the 104K–105K supply zone and faced rejection, confirming bearish pressure. The most recent short entry aligns with overhead liquidity absorption and weakness near the high-volume node (~105K) on the volume profile.
We're now revisiting the previous demand zone (101K–102K), which has held multiple times but is weakening. A breakdown below this level opens up the next major demand zone around 98.5K–99K and possibly 94K if momentum accelerates.
🔻 Bias: Bearish unless 104K is reclaimed.
🔍 Watching: Reaction at current support and volume cluster near 100K.
📊 Tools Used: S/D Zones, VWAP, Volume Profile, Confirmation Indicators.
📌 Trade safe. Set alerts and don’t chase.
BTC is squeezing between descending resistance.📊 BTC/USDT – 1H Chart Analysis: The Calm Before the Storm?
Bitcoin is currently coiling within a symmetrical triangle on the 1-hour chart – a technical pattern that often signals a strong breakout is just around the corner. The market is compressing, and momentum is building.
🔍 Key Levels to Watch:
🔹 Symmetrical Triangle:
BTC is squeezing between descending resistance and ascending support. This equilibrium usually doesn’t last long – expect a sharp move soon.
🔹 Demand Zone ($$$ / BPR):
A solid floor is forming near the BPR (Bullish Price Range), signaling potential buyer interest and liquidity resting just below.
🔹 Fair Value Gap (FVG):
To the upside, BTC is facing a liquidity pocket (FVG) that could act as a magnet if bulls take control.
⚡ Potential Scenarios:
📈 Bullish Breakout: A break and close above the triangle could trigger a rally towards the $105K–$106K zone. Watch for volume to confirm!
📉 Bearish Breakdown: Losing the lower trendline support might send BTC into a deeper correction toward previous demand zones.
🧠 Final Thoughts:
We're approaching a critical inflection point. The triangle is narrowing, and Wednesday, June 25 could be the date the market decides. Both bulls and bears should prepare for volatility.
🚨 As always: This is not financial advice.
🧠 DYOR – Do Your Own Research.
Manage risk. Trade smart. Stay sharp. 💹

BTC will get doomed to 96k?NO not now, but you can see it ditto follows the movement as said earlier and shown. with little liquidity left on the top of it!

BTC/USD – Price Rejected at ATH | Key Support in PlaY Bitcoin recently reached a new all-time high at $111,942, but the daily candle closed lower around $109,550, signaling a potential rejection.
On the 1D timeframe, we are now watching the $100,725 level closely. A confirmed break below this support would be a strong signal to consider short positions.
Until then, BTC may consolidate or attempt another push higher. Patience is key here — wait for confirmation.
📌 Key levels:
• Resistance: $111,942 (ATH)
• Support: $100,725 (critical break level)
🧠 Trade safe, manage risk, and follow for more analysis.

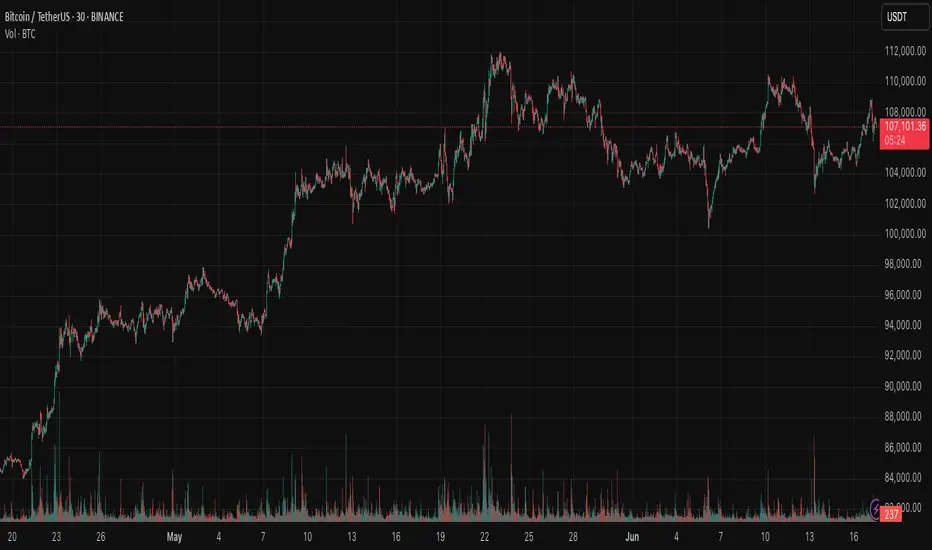
BTC - 106k now, whats next?106k is a rotational move, means the top liquidity get inside at first hence and then it goes down, watch it for
BTCUSDT. Initiative Analysis Market OverviewHey traders and investors!
📍 Context
On the daily and 4H timeframes, the market is in a sideways range (Black lines = range boundaries).
Buyer initiative is active on 4H. The target initiative is 108,952.
However, on the daily timeframe, the seller initiative is in control, and a seller zone has formed. The seller zone is the red rectangle on the chart.
📊 Key actions
The buyer attempted to break out of the range on the daily timeframe twice, but both times the seller pushed the price back inside.
The price is currently interacting with the seller zone. Watching for the reaction.
🎯 Trade Idea
🔸 Long positions — with caution. Only valid if the price holds above 105,336, aiming for the target at 108,952.
🔸 Until that happens, the priority is on further downside, in line with the current seller initiative on the daily. It’s reasonable to look for short setups if the seller defends 105,336.
This analysis is based on the Initiative Analysis concept (IA).
Wishing you profitable trades!

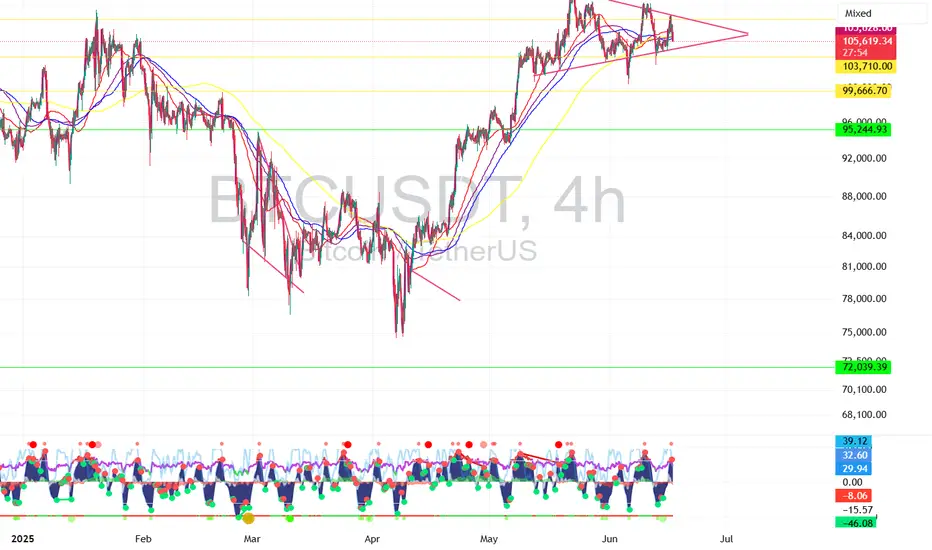
$BTC 4hr - The Calm Before Bitcoin’s Next Move💡 In bull markets, triangles break UP more often than down.
But volume + macro + ETF flows > patterns.
Set alerts, manage risk, stay nimble.
#BTC #CryptoAlpha #RiskManagement
🎯 Key Levels Analysis:
✅ Resistance: 106.3K
→ This level matches the upper bound of the symmetrical triangle and is reinforced by multiple recent rejections. Also aligns with previous highs.
✅ Support: 103.7K
→ Mid-range horizontal support. Price reacted here multiple times. It's also near the triangle base.
✅ Support: 99.6K
→ Clean psychological + technical level. A previous consolidation zone. Would likely trigger a strong reaction.
✅ Last Line of Bull Defense: 95.2K
→ Major horizontal support from the April/May breakout structure. Losing this would likely invalidate the bullish structure.
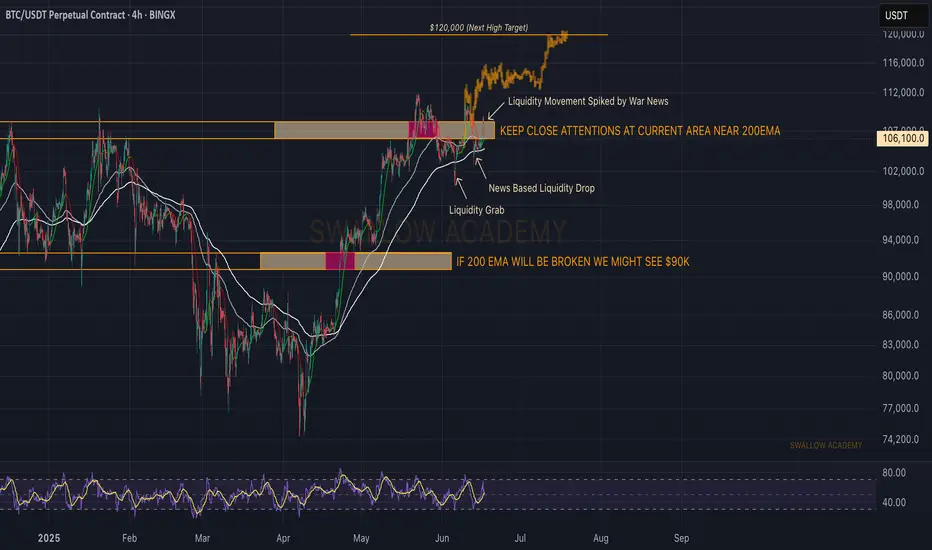
Bitcoin (BTC): Markets are Cooked | Big Volatility IncomingYes, markets are cooked....all those tensions and news that are pressuring markets from every corner might result in a very explosive movement.
Now we've been looking for a new ATH to form near $120K and we still keep that game plan as long as buyers keep the dominance above the 200EMA line.
There is not much we can do now but just speculate. Speculate that when the war between Russia and Ukraine happened, what markets did exactly was they dumped and then shot highly up (talking mainly about Bitcoin).
So we might see similar things in the markets depending on what will happen next in the world, but one thing is sure: some will make a lot of money soon and some will lose a lot. Be sure to have proper risk management, as this is crucial!
Swallow Academy
bitcoin is pumpingBitcoin has been pumping in the past few days pretty massively. Why? There are 2 main reasons - the first reason is that Bitcoin has finished a major WXY corrective wave, and the second is that Bitcoin swept liquidity below a triangle (see my previous post for details). That was a very good opportunity to buy/long Bitcoin at that specific level I described in the previous analysis. But let's focus on the present and future!
We always want to find strong levels on the charts so we have a great entry point/take profit target. The next strong level is definitely the 0.618 FIB, which Bitcoin can hit in the very short term. Also, below the 0.618 FIB, we have a strong horizontal zone, which can also act as a strong resistance. Bitcoin should definitely go there and retest this zone.
We want to see how Bitcoin is going to react in the zone and FIB, but you can create a new limit order to short Bitcoin there so you don't miss anything. So currently I am temporarily bullish on Bitcoin, and in the next update I will make a big analysis on Bitcoin and a very likely scenario for the next months. What will the price of Bitcoin be in December? Please like/boost my idea right now.
Write a comment with your altcoin + hit the like button, and I will make an analysis for you in response. Trading is not hard if you have a good coach! This is not a trade setup, as there is no stop-loss or profit target. I share my trades privately. Thank you, and I wish you successful trades!
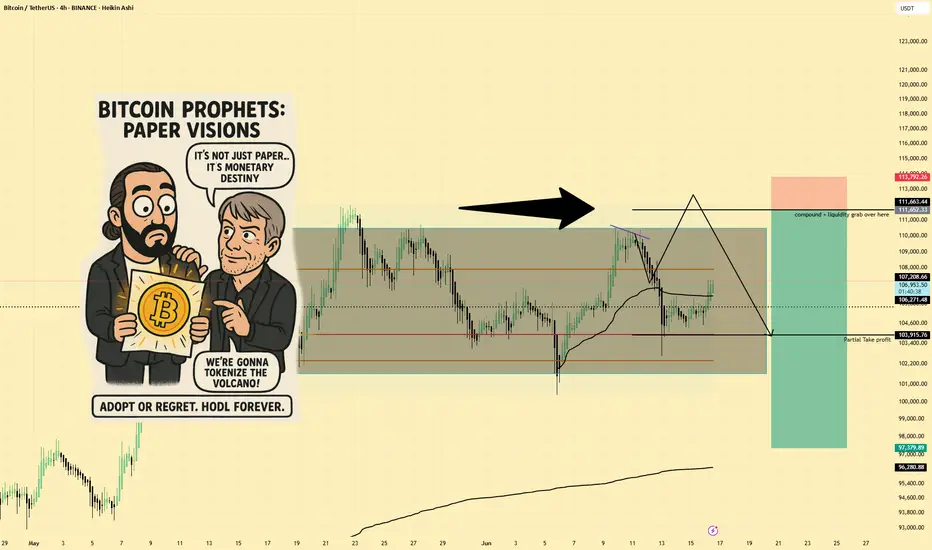
BTCUSD | Short Bias | Liquidity Grab | (June 16, 2025)BTCUSD | Short Bias | Liquidity Grab Setup | (June 16, 2025)
1️⃣ Short Insight Summary: Bitcoin hit a solid take-profit earlier, but now I’m watching for a potential liquidity grab near the highs to set up a short opportunity. The next key zone to watch is around 1:11 PM if price quickly spikes and reverses.
2️⃣ Trade Parameters:
Bias: Short
Entry: Around 113 (after a confirmed liquidity grab at the top)
Stop Loss: Just above the liquidity grab zone
TP1: Around 103900 (Point of Control zone)
TP2: Final target at 97900
Partial Exits: Possible scaling out at POC zone
3️⃣ Key Notes: Spot selling is active, but there's also a lot of buying interest—especially from those trying to long this dip. That mix can lead to a fast liquidity grab, flushing out early shorts before a reversal. Open interest suggests there's still a lot of activity, so I’m being patient and only acting on confirmation.
4️⃣ Optional Follow-up: I’ll keep an eye on this setup and update if the reversal confirms after the grab.
Please LIKE 👍, FOLLOW ✅, SHARE 🙌 and COMMENT ✍ if you enjoy this idea! Also share your ideas and charts in the comments section below! This is best way to keep it relevant, support us, keep the content here free and allow the idea to reach as many people as possible.
Disclaimer: This is not financial advice. Always conduct your own research. This content may include enhancements made using AI.
Btcusd buy ideaBTCUSD experienced a sell-off, filling the gap, but buyers stepped in, mitigating the decline. If buyers hold and consolidate above $105,500, it could pave the way for a potential rally towards $108,000-$110,000. What's your outlook, traders
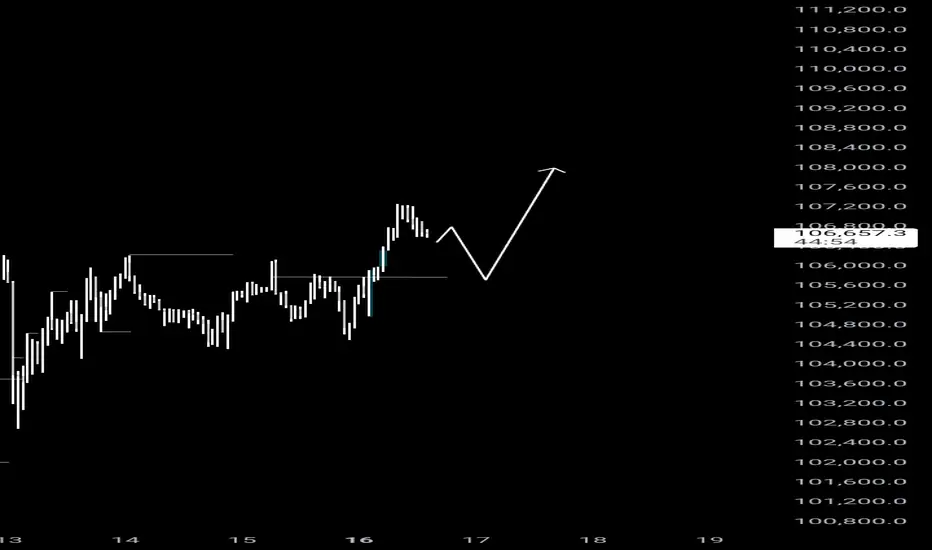
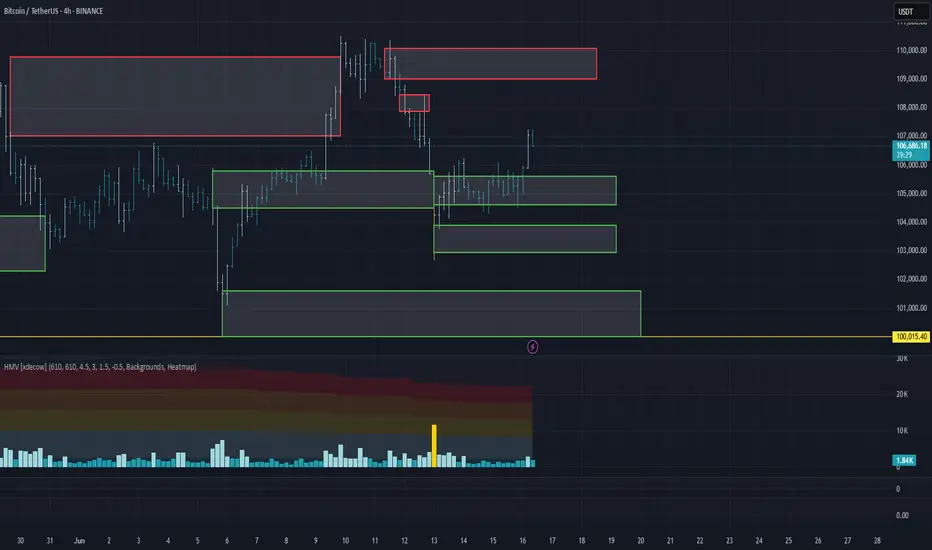
Market Overview
WHAT HAPPENED?
Strong sales resumed last week after a short period of growth. This was provoked by the escalation of the conflict in the Middle East.
After testing and fixing the $105,800-$104,500 zone (accumulated volumes), strong volume deviations appeared, which should be perceived as protection on the part of the buyer.
WHAT WILL HAPPEN: OR NOT?
At the moment, an attempt is being made to position the volumes accumulated in the range of $105,600-$104,700 in the direction of growth. Strong support has already been formed in the area of $104,000-$102,900 (abnormal volumes).
When the four-hour candle closes above the $106,400 mark, it’ll be possible to additionally consider the zone of accumulated volumes for buys (if there is a reaction from it).
The main scenario is a long position with targets up to the nearest resistance. In case of easing of geopolitical tensions, there remains the possibility of updating the ATH.
Alternative scenario: correction to the support zone of $101,600-$100,000 (volume anomalies). With this development, a prolonged rebound is possible.
Sell Zones:
$109,000–$110,000 (accumulated volume)
Buy Zones:
$105,600–$104,700 (accumulated volume)
$104,000–$102,900 (volume anomalies)
$101,600–$100,000 (significant volume anomalies)
$98,000–$97,200 (local support)
Level at $93,000
$91,500–$90,000 (strong buying imbalance)
IMPORTANT DATES
Macroeconomic developments this week:
• Tuesday, June 17, 03:00 (UTC) — publication of the Japanese interest rate decision;
• Tuesday, June 17, 12:30 (UTC) — publication of the core retail sales index for May in the United States, the volume of retail sales for May in the United States;
• Wednesday, June 18, 06:00 (UTC) — publication of the UK consumer price index compared to May last year;
• Wednesday, June 18, 9:00 (UTC) — publication of the consumer price index in the Eurozone compared to May last year;
• Wednesday, June 18, 12:30 (UTC) — publication of the number of initial applications for US unemployment benefits;
• Wednesday, June 18, 18:00 (UTC) — publication of FOMC economic forecasts, FOMC statement, US Federal Reserve interest rate decision;
• Wednesday, June 18, 18:30 (UTC) — US FOMC Press Conference;
• Thursday, June 19, 7:30 (UTC) — publication of the Q2 interest rate decision in Switzerland;
• Thursday, June 19, 8:00 (UTC) — press conference of the National Bank of Switzerland;
• Thursday, June 19, 11:00 (UTC) — publication of the June interest rate decision in the UK;
• Thursday, June 19, 12:30 (UTC) — publication of the number of initial applications for unemployment benefits in the United States;
• Friday, June 20, 12:30 (UTC) — publication of the Philadelphia Federal Reserve's index of manufacturing activity for June in the United States.
*This post is not a financial recommendation. Make decisions based on your own experience.
#analytics
BTC/USDT.dBtc forming a beautiful Cup and Handle chart pattern. Target is $150k roughly. Price should really move hard once BTC goes above the neckline into price discovery. This is a good risk to reward setup. Enjoy!