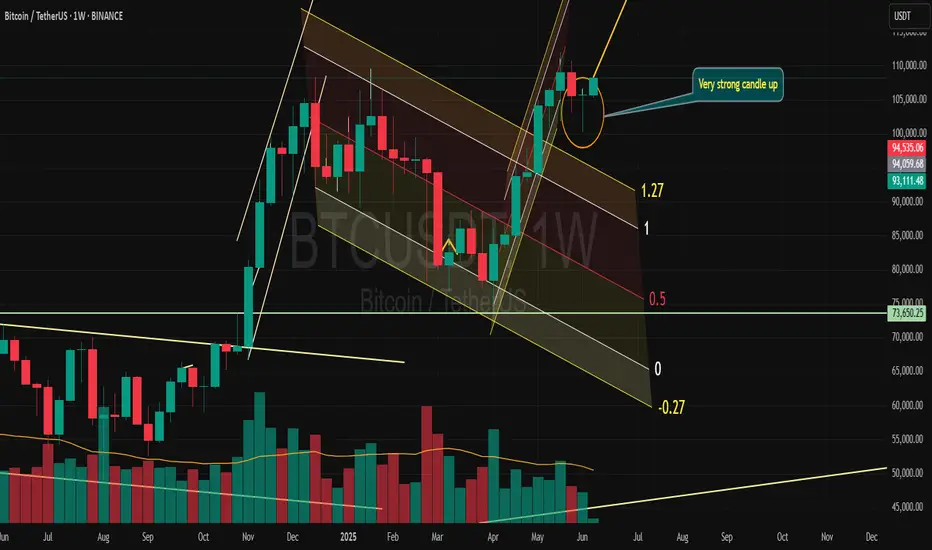
BULLISH!💰 #BTC successfully retested the broken weekly resistance with a positive outcome✅
a Morning Star bullish candlestick pattern is forming✨
BULLISH🚀
BTCUSDT.3S trade ideas
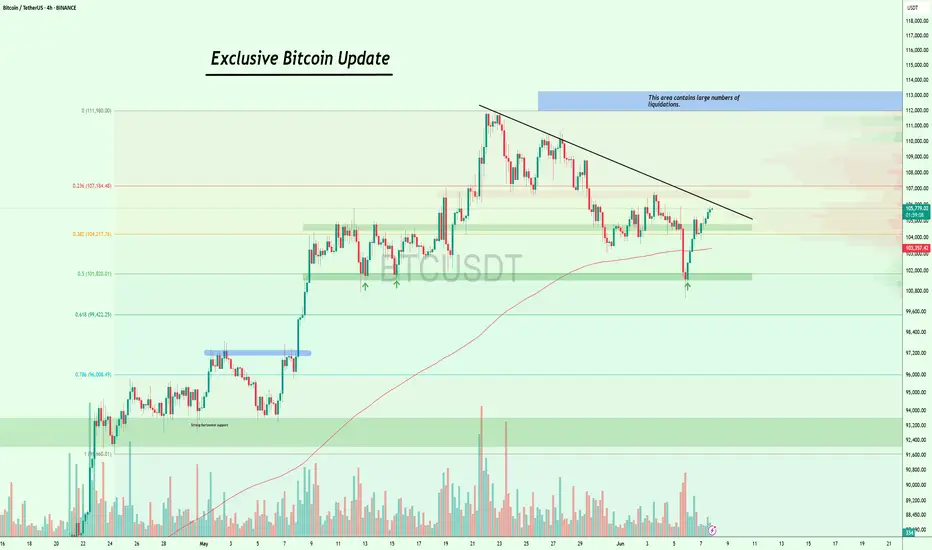
No Change in Plan! $BTC Targeting Major Liquidation ZoneAs I warned you guys, CRYPTOCAP:BTC came down to the $100K exactly as expected, and then we bounced from the $100K level!
That lower trendline once again acted as strong support, just as expected.
Now #Bitcoin is pushing back up toward the major trendline and eyeing the $107K–$112K zone, which holds large liquidations.
No changes in the game plan, watching the daily and weekly closes closely.
If Bitcoin breaks above this trendline clearly, we could see a strong move up. 🚀
I’ll keep you posted as things unfold. If you find my updates helpful, don’t forget to like and follow for more!
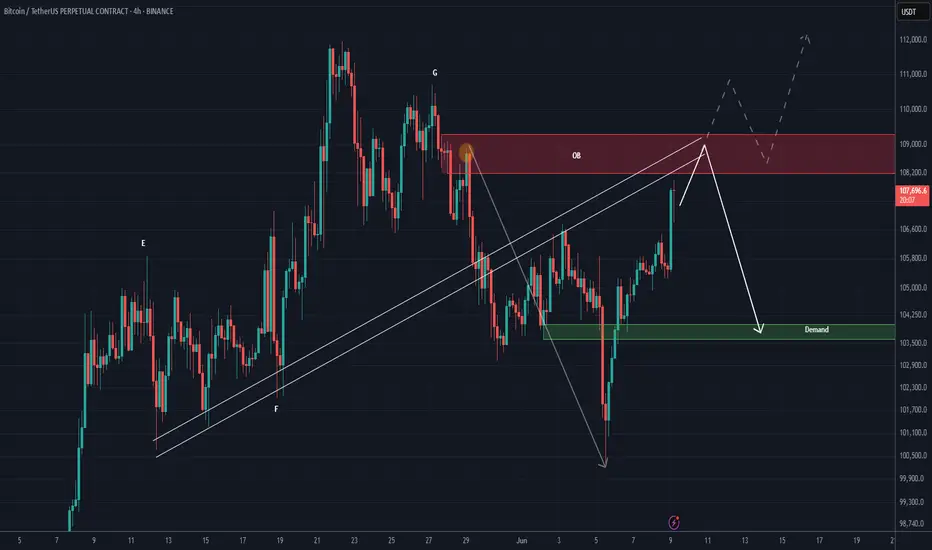
BTC NEW UPDATE (4H)This analysis is an update of the analysis you see in the "Related publications" section
These days, Bitcoin's movement is mostly driven by liquidity hunting and is caught in complex and risky corrections.
The resistance zone currently in front of Bitcoin is marked in red. If the price is going to get rejected, it should happen from this zone. However, if this zone is broken and price stabilizes above it, Bitcoin could turn bullish again.
Considering today is Monday, volumes are still low, and the price is near a strong order block | you should be careful with your positions.
For risk management, please don't forget stop loss and capital management
Comment if you have any questions
Thank You
Monday trade update!💭 In today’s class, we covered:
🧠 Trading Psychology – mastering mindset and emotional control
🔭 Long-Term Outlook on BTC – big picture perspectives
📅 This Week’s Trade Setups – potential plays and key levels to watch
👀 I’m currently eyeing a 4H continuation higher low setup – mainly focused on BTC for now, but let’s see how the market unfolds this week.

BTCUSD is replaying the 2021 double top a bit too perfectlyTracing the weekly highs of Bitcoin's 2021 double top and translating them onto the current highs reveals some startlingly similar patterns.
Removing just a couple of week's bars between the two tops in 2021 gives a very close match to the current pattern we see unfolding.
Are we just watching an action replay?
If so, we would be looking at ~$140k highs by early August followed by a huge retracement to the long term trendline in the c. ~$90k region. Such a retracement is not unprecedented, and from these lows I would expect the price to rise at or above the trend once again, keeping Bitcoin on track to hit $1m by 2029, so this is by no means a bearish prediction.

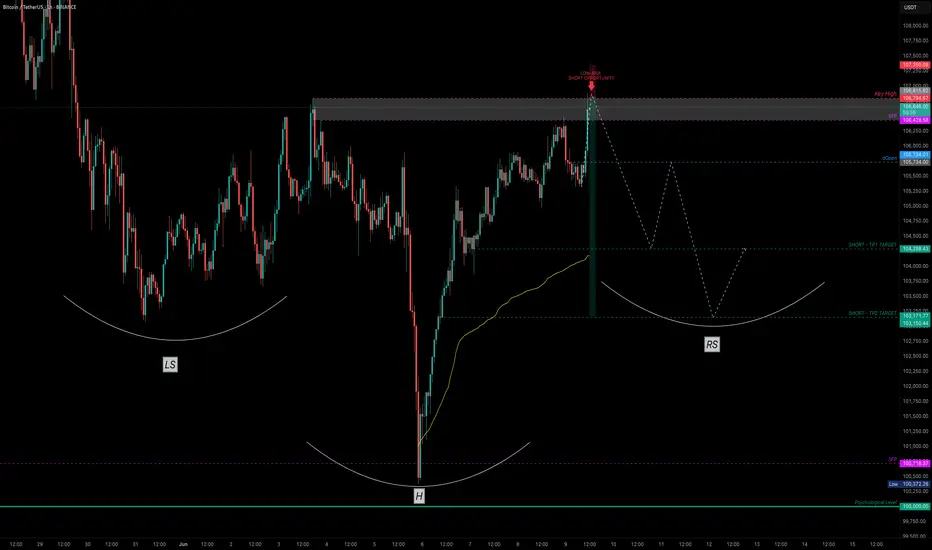
Bitcoin — Breakout or Bull Trap? SFP Setup ExplainedAfter a clean drop that nearly tagged the psychological $100K level, Bitcoin printed a Swing Failure Pattern (SFP) — sweeping the lows and snapping back with strength. That bounce wasn’t just a reaction — it was a liquidity reclaim.
Now, price structure is shaping into a potential Inverted Head & Shoulders — a classic reversal pattern often forming before a bullish continuation.
🔍 Key Level to Watch:
$106,694.63 — This recent key high was just taken out. If we see rejection here (SFP), it could set up a high-probability low-risk short opportunity.
🎯 Short Trade Idea (Only on SFP confirmation):
Entry: After price sweeps $106,694.63 and shows rejection
Stop-Loss: Above wick high (e.g., ~$107.4K)
TP Zones: $103.5K and $101.7K
R:R: ~1:7
✅ Cleaner setup with confluence from structure and liquidity — high probability if confirmed.
📚 Educational Insight: Why SFPs Work So Well
SFPs (Swing Failure Patterns) are some of the most powerful setups in trading because they:
Trap breakout traders
Sweep liquidity and reverse quickly
Offer clear invalidation (wick high/low)
Allow for tight stop-loss and high R:R setups
Using SFPs in conjunction with key highs/lows, volume, and structure dramatically increases your edge.
📈 Why Order Flow Is Crucial for SFPs
1. See the Trap Form in Real Time
SFPs are essentially traps — price sweeps a key level, sucks in breakout traders, and then reverses. Order flow tools let you see this happen:
A spike in market buys above resistance
Followed by a lack of follow-through (no new buyers)
And then an aggressive absorption or reversal (selling pressure hits)
Without order flow, this is all hidden in the candles.
2. Confirm Liquidity Sweeps with Delta & CVD
Watch for a delta spike or Cumulative Volume Delta (CVD) divergence — a clear sign that aggressive buyers are getting absorbed.
This gives you confirmation that the sweep failed, not just a random wick.
3. Tight Entries with Confidence
When you see actual trapped volume or liquidation clusters at the SFP level, you can enter tighter with conviction — because you're not guessing, you’re reacting to actual intent and failure in the market.
4. Early Warning System for Reversal or Continuation
If the SFP fails to trigger a reversal (e.g. buyers step back in with strength), you’ll see it early in the flow — and can quickly reassess.
🧠 Bottom Line:
Order flow lets you stop guessing and start seeing the actual fight between buyers and sellers. Combine it with SFPs, and you're not just trading price — you're trading intent. That edge is huge.
_________________________________
💬 If you found this helpful, drop a like and comment!
Want breakdowns of other charts? Leave your requests below.
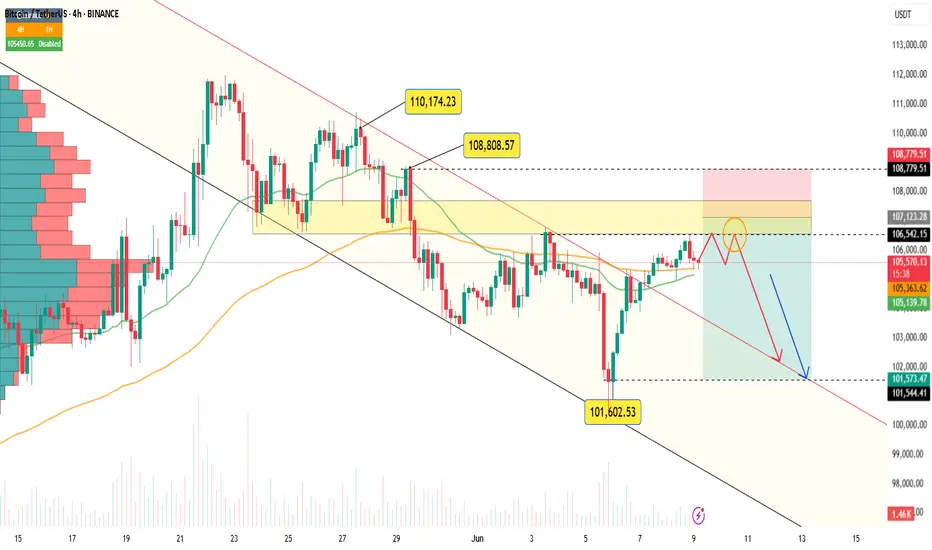
BTCUSDT – Is This Just Resistance or a Bull Trap?Bitcoin is now pressing against the key resistance zone around $106,920—a level that has consistently rejected price advances in recent weeks. After a decent recovery, momentum seems to be stalling, and often, that quiet before the storm tells us more than a breakout ever could.
Zooming in, we may be witnessing a classic fake-out formation—a subtle move above resistance to trap late buyers before a sharp reversal. If bulls can’t firmly hold this zone, BTC could very well slip back toward $101,500, aligned with the broader descending trendline.
⚠️ This isn’t about calling tops—it’s about respecting structure and understanding exhaustion. Resistance exists for a reason, and history reminds us: when enthusiasm fades, gravity returns.
Bitcoin Still Looks Bearish, but the Situation Is More ComplexBitcoin Still Looks Bearish, but the Situation Is More Complicated
Bitcoin tested 106700 again. This is the third time it has hit this level.
It might drop further, but the current situation is more uncertain.
You may watch the analysis for further details!
Thank you and Good Luck!
❤️PS: Please support with a like or comment if you find this analysis useful for your trading day❤️

CONGRATULATIONS IF YOUR SHORTED AT 2300! 2X UP🚨 BIG congrats to those of you who shorted yesterday’s setup around 11PM — we got a perfect entry signal for the short we planned!
Did I catch it? Nope.
Was I deep in dreamland? 😴 Absolutely.
We’re starting the week 2X up — if you're still riding that trade, consider de-risking at the very least. 📉🛡️
Today, I’m watching the internal range setup, along with any reaction from the last demand zone in the previous expansion leg.
I’ll be waiting for a clear market structure shift on the 10-minute before pulling the trigger. ⏳⚡
🗓️ Class Schedule This Week:
Monday: 4PM
Tuesday: TBC
Sunday: TBC
Let’s stay sharp and trade smart this week! 💼📊

BTC Dominance, Alt CAP (in BTC) and BTCBTC Dominance, Alt CAP (in BTC) and BTC
This chart compares those three trends and their relationship between them

TradeCityPro | Bitcoin Daily Analysis #111👋 Welcome to TradeCity Pro!
Let’s take a look at Bitcoin and key crypto indicators. As usual in this analysis, I’ll review the futures triggers for the New York session.
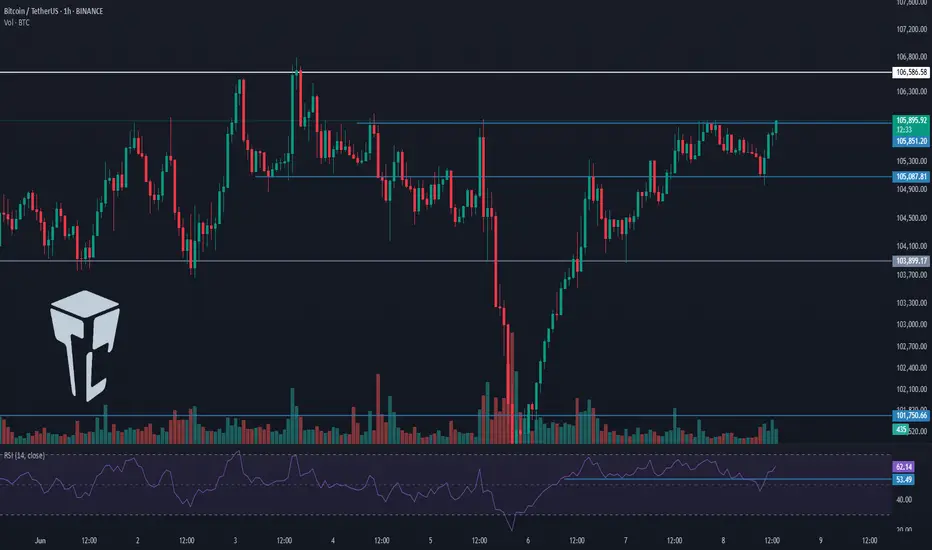
⏳ 1-Hour Timeframe
As you can see in the 1-hour timeframe, none of our triggers were activated yesterday and Bitcoin has been ranging.
⭐ There was an important RSI level at 53.49, which was tested multiple times. I mentioned that breaking this level could trigger a slight correction — and that’s exactly what happened. The price pulled back slightly to 105087, retested this zone, and now RSI has returned above 53.49. Price is also moving with strong bullish momentum toward the 105851 resistance.
📊 The buying volume entering the market is quite strong, and if this increase continues, the price could begin an upward move. So in terms of both momentum and volume, we have bullish confirmation and can enter a position if the triggers activate.
📈 For a long position, the trigger we’re watching is 105851. While the main resistance is at 106586, I prefer to take the risk and open the position earlier, because I think the 106586 break won’t provide a clean entry and would be harder to act on.
✨ So my chosen trigger for a long position is 105851. Given the rising volume and high RSI momentum, we have the confirmations needed to open this trade.
🔽 For a short position, the first trigger is the break of 105087. This is a risky position since we haven’t yet confirmed a trend reversal — this would be the first signal if a downtrend begins. Personally, I’ll wait for confirmation of bearish momentum before opening a short.
👑 BTC.D Analysis
Bitcoin Dominance is still below the 64.67 level and is ranging under this resistance.
🧩 A break above 64.67 would confirm a bullish move in dominance. A break below 64.49 would signal a bearish reversal.
📅 Total2 Analysis
Total2 is ranging below the 1.15 level. A break above this zone could initiate a bullish move.
🔔 On the bearish side, the current trigger is the 1.13 level. We need to wait for this level to be broken for a trend reversal confirmation.
📅 USDT.D Analysis
Tether Dominance stabilized below the 4.79 zone yesterday and has now pulled back to it, preparing for a possible second leg downward.
🔑 If that happens, the crypto market could move upward. However, if USDT.D rises back above 4.79, its uptrend could continue.
❌ Disclaimer ❌
Trading futures is highly risky and dangerous. If you're not an expert, these triggers may not be suitable for you. You should first learn risk and capital management. You can also use the educational content from this channel.
Finally, these triggers reflect my personal opinions on price action, and the market may move completely against this analysis. So, do your own research before opening any position.
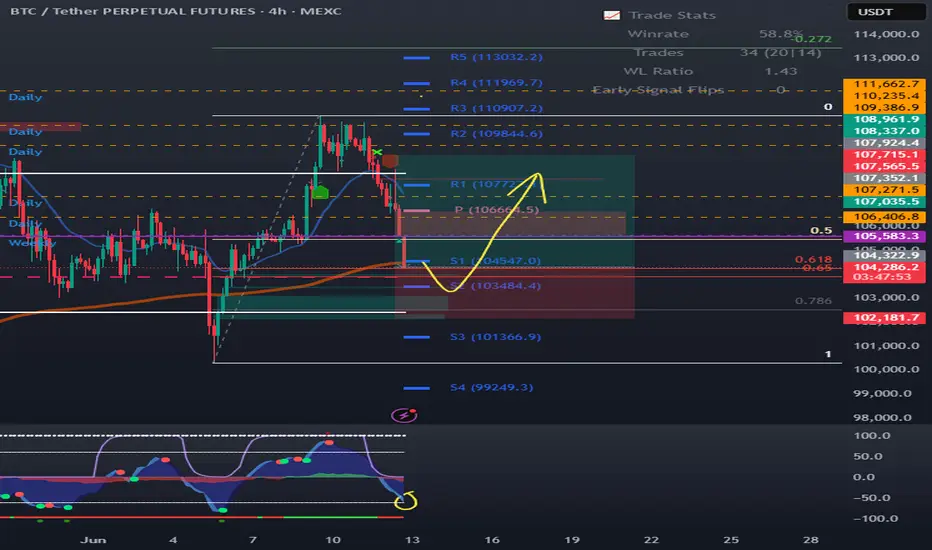
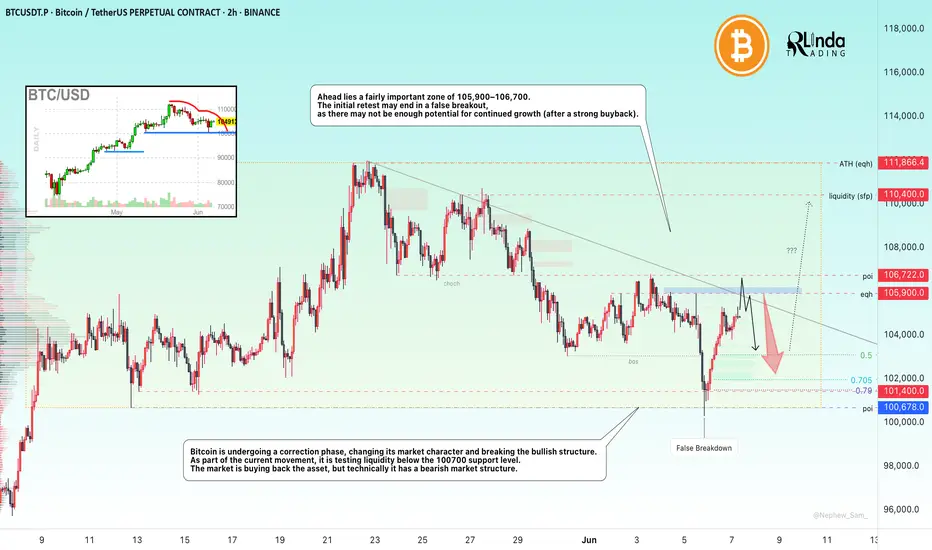
BITCOIN → Correction. The hunt for liquidity...BINANCE:BTCUSDT.P is recovering after liquidity was captured in the 100K zone. Locally, the technical situation is controversial despite the global bullish trend
Bitcoin is changing its market character (106700) and breaking the bullish structure (103000) during a correction phase. As part of the downward momentum, the movement is testing liquidity below the 100700 support level. As for the liquidation, there are several reasons: the conflict between Trump and Musk, strangely enough, the market reacted with a fall; the liquidation of whales, history repeats itself...
Traders are buying back Bitcoin, but technically the market has a bearish structure. Locally, there is a bearish trend, and a countertrend correction, “liquidity hunting,” is forming.
Ahead lies a fairly important zone of 105900-106700. The initial retest may end in a false breakout, as there may not be enough potential for continued growth (after a strong buyback).
Resistance levels: 105,900, 106,720, 110,400
Support levels: 103000, 101400, 100K
After a correction from 105900, which could target half (0.5) of the trading range, the market may attempt to return to a bullish phase, provided that the bulls keep the price from falling and do not allow it to update local lows. That is, in the short term, I expect a decline from 105900 to 103000, but further, if the price starts to return to 105500-105900, there may be chances for growth to 110K
Best regards, R. Linda!
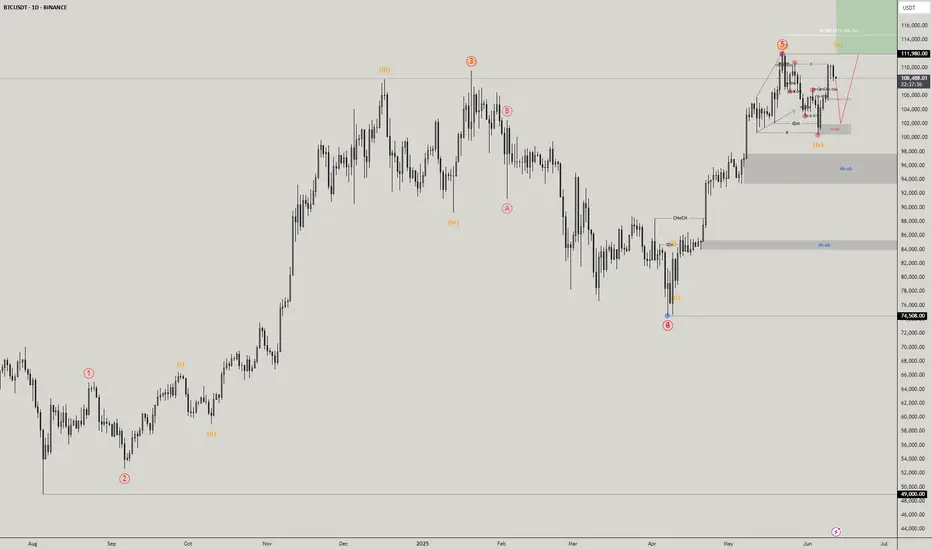
BTCUSDT Possible Sell BTCUSDT completed wave 4 of 5 and currently in wave 5 of 5 . wave 5 targets are on green and a possible sell is in place to finish wave 2 of 5 .
Good LUck
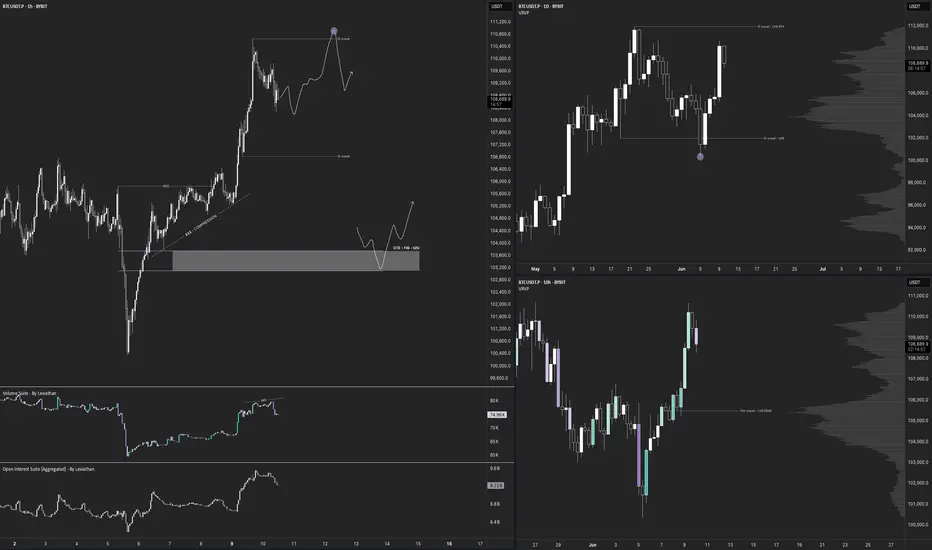
$BTC - Top Down BYBIT:BTCUSDT.P Top Down (10/06/25)
V-Levels Bias
Weekly = Bullish
Daily = Bullish
10-Hour = Bullish
1-Hour = Bullish
V-Levels Momentum
Weekly = Bullish
Daily = Bullish
10-Hour = Neutral
1-Hour = Neutral
Analysis & Insights
DeCode Market Breakdown
Macro Context
Overall, the Weekly structure remains bullish — both in bias and momentum. We’re trading below a key level at $111,968.0, and continuation is likely unless we see a clear Failed Auction at that level.
That would trigger some serious red flags and force a reevaluation of the directional bias.
Daily Chart
Daily structure is extremely bullish at the moment.
The price recently showed a Failed Auction around the $102,000.0 V-structure Higher Low — indicating aggressive absorption and buyer strength.
As long as price holds above that area, the priority is to stay on the long side.
⸻
10-Hour Chart
Still holding a bullish structure overall.
One thing I’ll be watching closely: the price reacting to the previous High at $110,660.8.
If we get a rejection + Failed Auction at that level, that opens up the possibility for intraday shorts; as a short-term shift in momentum and local resistance kicks in.
1-Hour Chart
📈 Long Setup: Waiting for a clean entry from an OTE / Fib zone + Over/Under structure.
📉 Short Setup: Watching for a sweep of the current highs + a clear Failed Auction (ideally with footprint confirmation).
There’s visible compression between $104k and $105k, so price might look to grab liquidity there first before any real move upward.
10-Min Chart
Currently, no clear trade setups on the 10M.
The 1H hasn’t reached optimal trade zones yet. I’ll be watching closely for any structure shifts or setups aligning with the macro bias.
⸻
🔍 Trading Plan Summary
Bias: Bullish (Weekly + Daily)
Look for longs aligned with HTF support + intraday confirmation
Short opportunities only if we get clear rejection from $110,660.8 + footprint signals
Bitcoin Near Breakout – CPI Miss Could Be the Catalyst?Just Released: Key U.S. Inflation Data:
Core CPI m/m: 0.1% (vs. 0.3% forecast)
CPI m/m: 0.1% (vs. 0.2% forecast)
CPI y/y: 2.4% (vs. 2.5% forecast)
Market Reaction & Outlook:
The softer-than-expected inflation figures suggest easing price pressures in the U.S. economy — a potential bullish signal for risk assets, such as Bitcoin ( BINANCE:BTCUSDT ).
-----------------------------
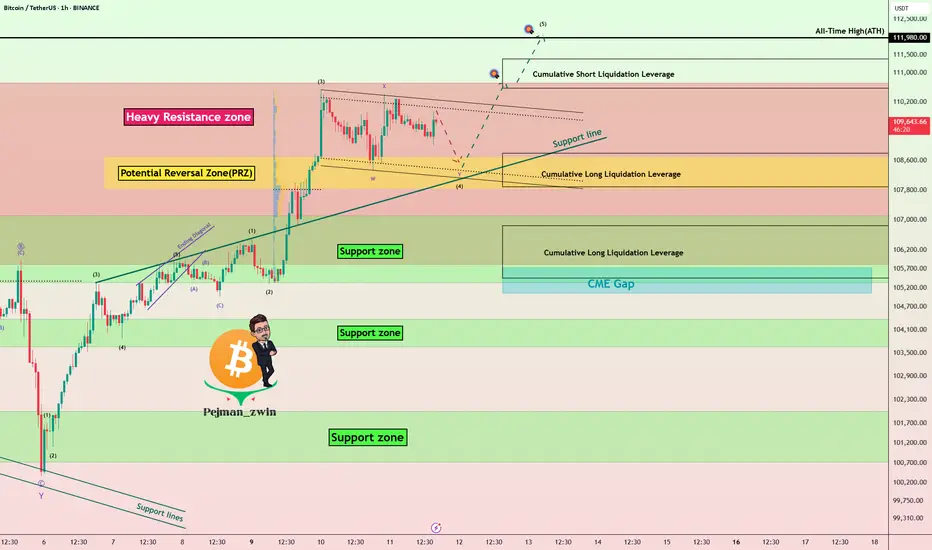
Now let's take a look at the Bitcoin chart on the 1-hour time frame .
Bitcoin is trading in the upper part of a Heavy Resistance zone($104,380-$103,670) and is trying to break through this zone. The announcement of US indexes could be a trigger for a breakout of this zone .
In terms of Elliott Wave theory , Bitcoin appears to be completing microwave 4 of the main wave 3 . The structure of microwave 4 is a Double Three Correction(WXY) .
I expect Bitcoin to start rising from the Potential Reversal Zone(PRZ) and near the Support line again and rise to at least $110,670 and if the Heavy Resistance zone($104,380-$103,670) is broken we should expect new ATHs in the coming days .
Cumulative Long Liquidation Leverage: $108,791-$107,887
Cumulative Long Liquidation Leverage: $106,840-$105,457
Cumulative Short Liquidation Leverage: $111,381-$110,568
Note: If Bitcoin falls below $105,700(Worst Stop Loss(SL)), we should expect further declines.
If you want to know my weekly analysis about BTC , I suggest you check out the following idea:
Please respect each other's ideas and express them politely if you agree or disagree.
Bitcoin Analyze (BTCUSDT), 1-hour time frame.
Be sure to follow the updated ideas.
Do not forget to put a Stop loss for your positions (For every position you want to open).
Please follow your strategy and updates; this is just my Idea, and I will gladly see your ideas in this post.
Please do not forget the ✅' like '✅ button 🙏😊 & Share it with your friends; thanks, and Trade safe.
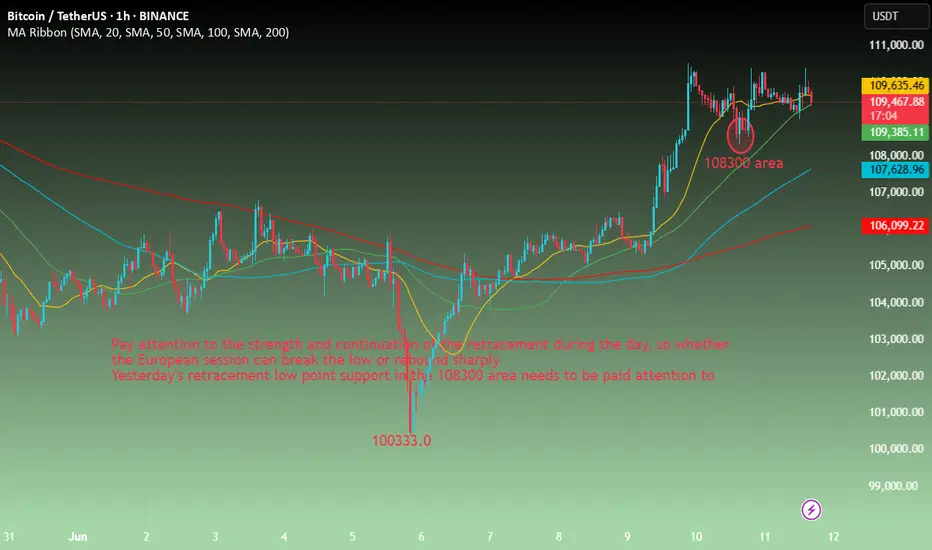
BTC-----Sell around 109500, target 108500 areaTechnical analysis of BTC contract on June 11:
Today, the large-cycle daily level closed with a small positive line yesterday, and the K-line pattern continued to rise. The price was above the moving average. The attached indicator was golden cross. The general trend of the rise was relatively obvious, but it should be noted that the large upward trend last week caused the current daily price to deviate from the moving average. Then the return to the moving average is a correction and retracement trend. The support position is near the 107000 area, so pay attention to avoid the risk of retracement; the short-cycle hourly chart yesterday's intraday retracement correction European session continued the US session support rebound, but did not break the previous high position. Today, the current pressure retracement, the K-line pattern continued to be negative, so the intraday still has to go through the retracement trend, the low point support position is 108300 area;
BTC short-term contract trading strategy:
sell at the current price of 109500, stop loss in the 110000 area, and the target is near the 108500 area;
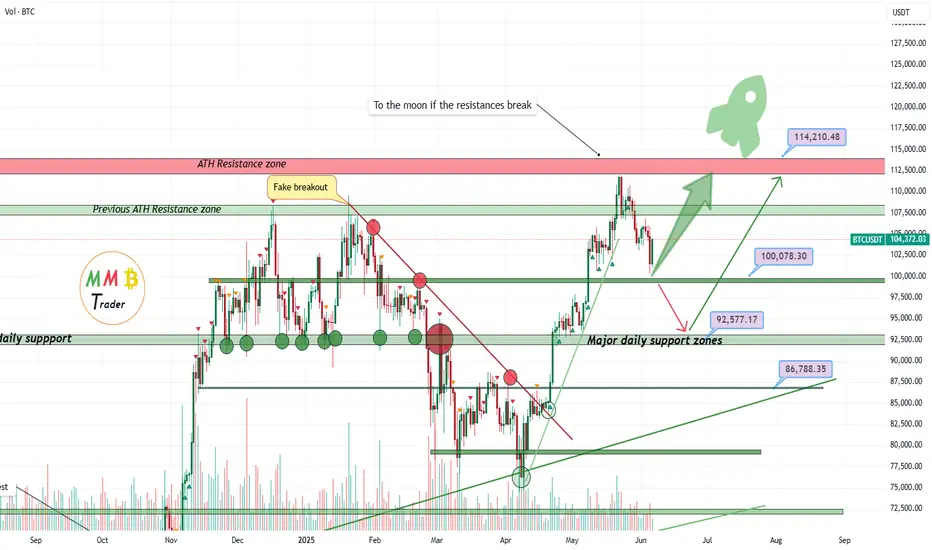
Bitcoin is ready for next ATH (if 100K hold)As we can see two major daily supports now can pump the price and one is 93K$ support zone and the other which is already started to pump the price is 100K$ support zone and price above these supports means market is still bullish and we can expect more rise and gain like the green arrows on chart to the new ATH.
DISCLAIMER: ((trade based on your own decision))
<<press like👍 if you enjoy💚
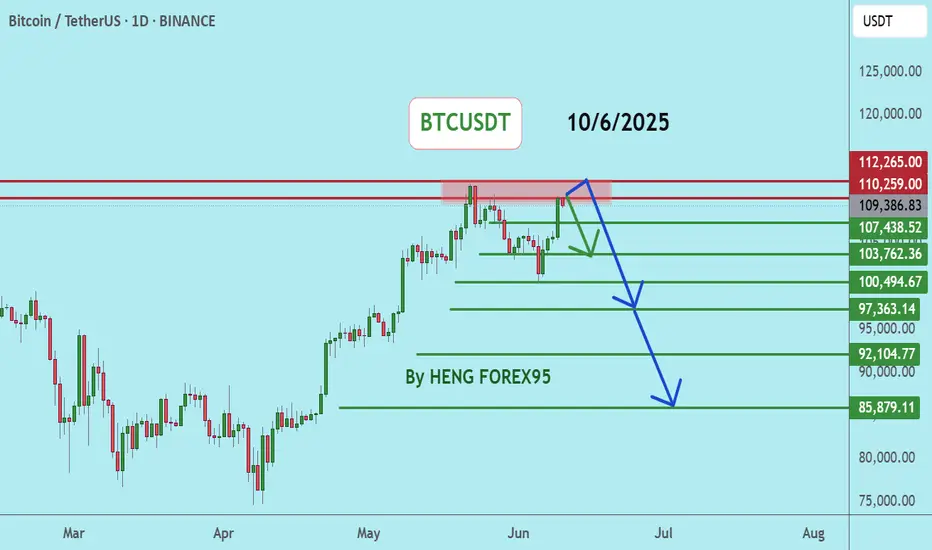
BTCUSDTBTCUSDT price is now near the resistance zone 110259-112265. If the price cannot break through the 112265 level, it is expected that the price will drop. Consider selling the red zone.
🔥Trading futures, forex, CFDs and stocks carries a risk of loss.
Please consider carefully whether such trading is suitable for you.
>>GooD Luck 😊
❤️ Like and subscribe to never miss a new idea!
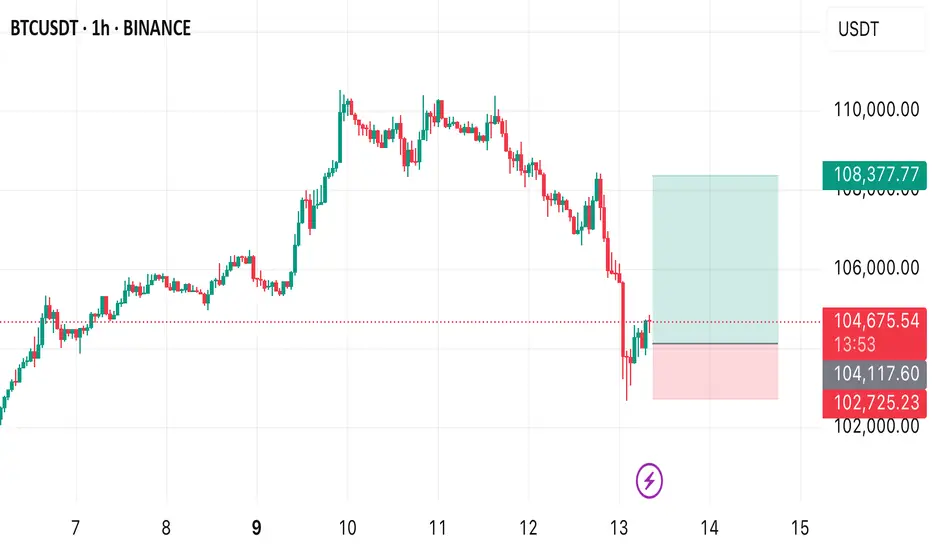
A BUY OPPORTUNITY ON BTCUSDPrice currently trade at 104,730.33 In today’s analysis, I anticipate a buy opportunity to emerge from the current market price. I expect price to rise up to 108,377.77
A buy opportunity is envisaged.
TradeCityPro | Bitcoin Daily Analysis #110👋 Welcome to TradeCity Pro!
Let’s dive into the Bitcoin analysis and major crypto indexes. In this review, as usual, I’ll cover the key futures triggers for the New York session.
⏳ 1-Hour Timeframe
As you can see in the 1-hour timeframe, Bitcoin formed a higher low yesterday and has now reached the 105087 resistance. It seems likely that this level will be broken soon.
✨ Currently, a candle has closed above 105087, but price hasn’t yet confirmed a breakout, and the move hasn’t taken off.
📈 For a long position, we can enter once the price confirms a breakout above this level. If 105087 breaks, price could target 106586. The main long position will be opened upon breaking 106586.
🛒 Strong buying volume is a very good trigger for this setup. RSI entering the Overbought zone would also provide a powerful momentum confirmation, and price could rise accordingly.
💥 If the current upward move fails and price falls below the recent low, we can open a short position upon breaking 103899, targeting 101750.
⚡️ The 53.49 level on RSI is critical — its break would serve as a strong confirmation for the short position.
👑 BTC.D Analysis
Looking at Bitcoin Dominance, yesterday it once again moved toward 64.67, but failed to break it and is now heading downward after being rejected from that resistance.
🔑 The trigger for bullish continuation remains 64.67, while 64.49 serves as the trigger for a bearish move.
📅 Total2 Analysis
This index formed a higher low at 1.13 yesterday and is now testing the 1.15 resistance. If this level breaks, the price could head toward 1.17 and 1.18.
📊 A break above 1.15 would be a valid long trigger. However, if price is rejected and moves downward, breaking 1.13 could send it back toward 1.1.
📅 USDT.D Analysis
USDT Dominance closed below the 4.79 level yesterday and is now moving toward 4.70. If this continues, the crypto market could see bullish momentum.
🧩 However, if dominance moves back above 4.9, the next bullish leg in USDT.D could begin.
❌ Disclaimer ❌
Trading futures is highly risky and dangerous. If you're not an expert, these triggers may not be suitable for you. You should first learn risk and capital management. You can also use the educational content from this channel.
Finally, these triggers reflect my personal opinions on price action, and the market may move completely against this analysis. So, do your own research before opening any position.

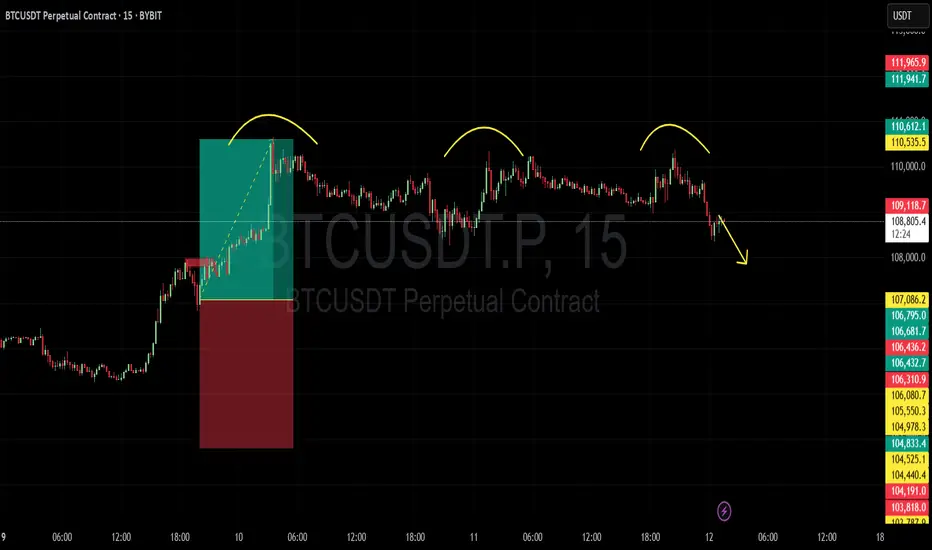
BTC weak wicks 🔎 Breakdown of Market Structure:
Triple Top Region (Resistance Zone):
Approximate level: $110,500–$111,000
Price failed to break this zone three times, forming rounded tops.
Sellers are heavily active here.
Neckline / Support Area:
The horizontal level price was bouncing from before breaking down: around $108,800
This area has now been broken, confirming the Triple Top breakdown.
Current Price Action:
Trading at $108,819, just below the neckline — indicating potential continuation to the downside unless a reclaim happens.
Bitcoin - Will the $100K Level Hold?Since reaching its all-time high (ATH) on May 22nd at an impressive $112,000, Bitcoin (BTC) has entered a corrective phase that has caught the attention of traders and analysts alike. After a strong and relentless move to the upside, such a phase is not uncommon in crypto markets, where rapid rallies are often followed by cooling-off periods. As of now, BTC is trading at around $101,000, marking a decline from its peak but still maintaining a significant portion of its recent gains. This retracement has not only been healthy in terms of price structure but also offers potential opportunities for those closely monitoring key technical levels.
4H FVG
One important aspect of the move leading up to the ATH was the formation of a 4H Fair Value Gap (FVG). These imbalances, left behind during aggressive moves in the market, are often revisited and filled as part of a broader effort by price to return to equilibrium. The current FVG spans from approximately $100,500 to $99,800. This range is especially noteworthy, as such gaps tend to act as magnets for price action, creating zones of potential support where buyers may step in to defend the structure. As BTC approaches this region, it's plausible to expect at least a temporary bounce, particularly if market sentiment remains constructive.
Golden Pocket Fibonacci
Adding further weight to this zone is the confluence of the Golden Pocket, the area between the 0.618 and 0.65 Fibonacci retracement levels, derived from the latest upward leg. This specific Fibonacci region is widely regarded in technical analysis as a high-probability reversal zone, often attracting significant buying interest. Interestingly, the Golden Pocket aligns almost perfectly with the aforementioned FVG, both residing in the $100,500 to $99,800 range. The overlapping of these two technical indicators strengthens the case for this area to act as a firm support level, or at the very least, a point where the ongoing correction could take a breather.
Conclusion
Taken together, the alignment of the 4H FVG and the Golden Pocket around the $100,000 mark creates a technically compelling scenario. The psychological impact of a round number like $100,000 only adds to its potential as a battleground between buyers and sellers. If this zone holds, it could spark a notable bounce, either a temporary relief rally or potentially the beginning of a renewed leg to the upside, depending on broader market conditions.
Thanks for your support.
- Make sure to follow me so you don't miss out on the next analysis!
- Drop a like and leave a comment!

BTC 4hr POC, 200EMA, Golden pocket confluenceBTC 4hr POC, 200EMA, Golden pocket confluence.
Looking at smaller timeframes for bullish divergence for entry.
This could be the bounce to test new ATH.
Break of all these support will be a big drop.