BITCOIN 2.5% Potential DropIt seems like BINANCE:BTCUSDT has lowered its trading volume and is potentially looking to make a correction in the upcoming days.
BTCUSDT.3S trade ideas

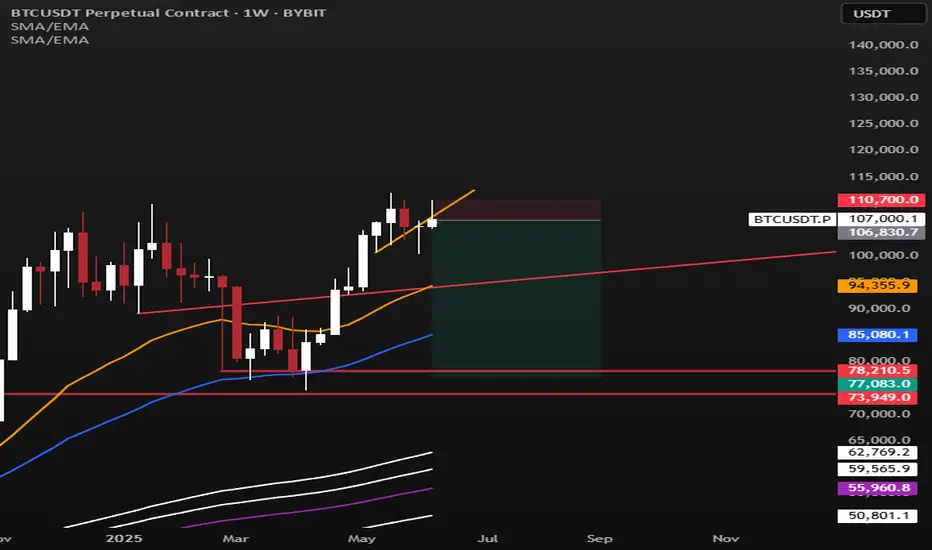
BTC/USD: More Bullish MOVE Ahead? (READ THE CAPTION)By analyzing the #Bitcoin chart on the weekly timeframe, we can see that the price has finally reached our expected level of $111,880, setting a new all-time high.
Currently, Bitcoin is trading around $110,800, and if it manages to hold above this key level, we could expect further bullish movement.
The next potential targets are $130,000 and $163,000, respectively.
Please support me with your likes and comments to motivate me to share more analysis with you and share your opinion about the possible trend of this chart with me !
Best Regards , Arman Shaban
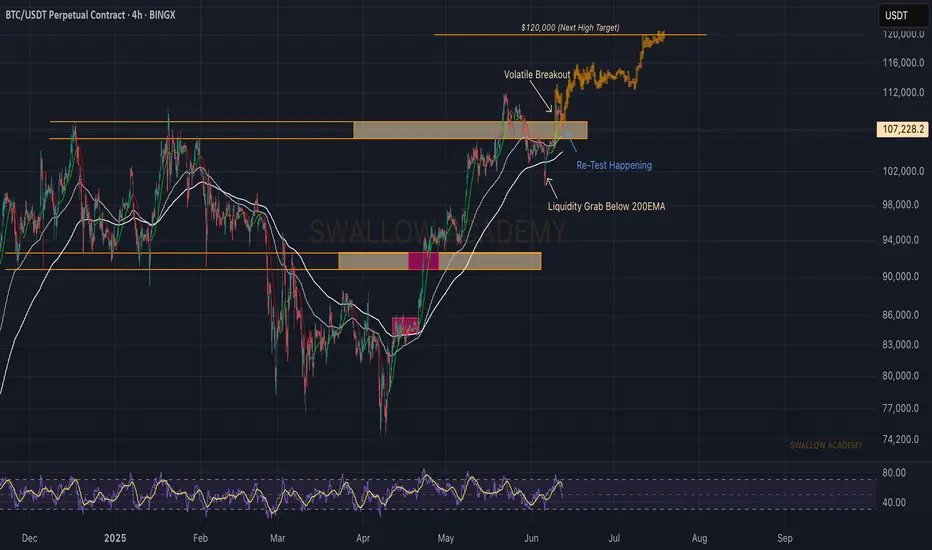
Bitcoin (BTC): Sellers Taking Over | Re-Test of Important ZoneWe are dropping hard, where after a clean breakout price is heading now back to the retest area, which will determine the next major movement from here on.
What we are seeking is a successful re-test (which then would trigger our buyside scenario), but if we see that sellers will keep the pressure and take over the control near current region, then we might be looking for slight dip towards the 200EMA line ($104,500)
Swallow Academy
Is Bitcoin Ready to Launch? In-Depth Analysis of BTC, ETH, XRP, Hello everyone, I hope you're doing well.
Due to time constraints, I won't be analyzing each asset individually. Instead, I’ll provide a collective technical overview in this post.
This analysis includes the following cryptocurrencies: **Bitcoin, Ethereum, Ripple, Solana, Sui, and Chainlink**.
⚠️ **Please note:** On the **daily timeframe**, most of these assets are forming different patterns. However, the **weekly timeframe** provides a clearer and more reliable outlook.
---
### 🔍 **Technical Overview:**
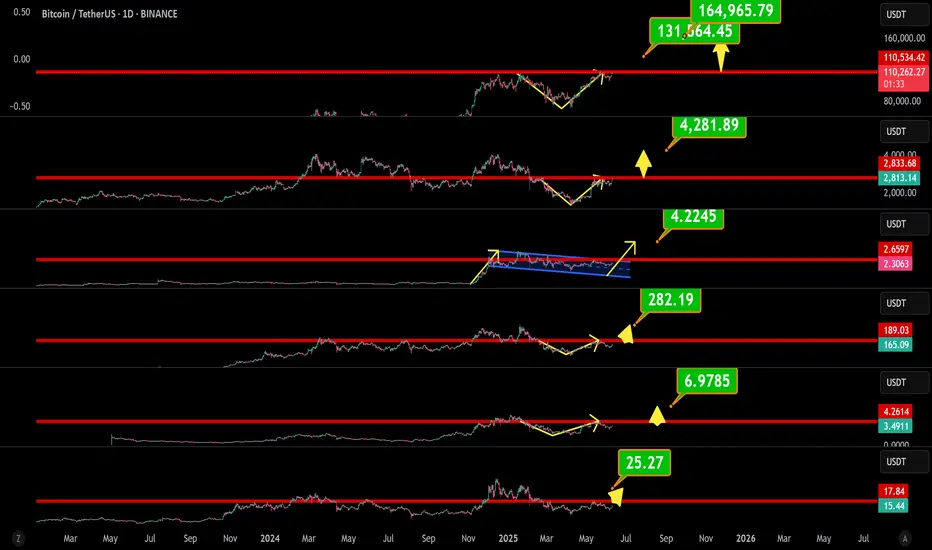
📌 **Bitcoin (BTC)**
Currently forming a **"V" pattern**.
If BTC closes **above \$110,500 on the weekly timeframe**, the first target is **\$131,500**, and the second target is **\$165,000**.
📌 **Ethereum (ETH)**
Also in a **"V" pattern**.
If ETH closes **above \$2,833 on the weekly timeframe**, the first target is **\$4,200**.
📌 **Ripple (XRP)**
Forming a **bullish flag** pattern.
If XRP closes **above \$2.65 on the weekly timeframe**, the first target is **\$4.22**.
📌 **Solana (SOL)**
Forming a **"V" pattern**.
If SOL closes **above \$190 weekly**, the first target is **\$282**.
📌 **Sui (SUI)**
Also forming a **"V" pattern**.
If SUI closes **above \$4.26 weekly**, the first target is **\$6.97**.
📌 **Chainlink (LINK)**
Needs a **weekly close above \$18** to confirm breakout.
First target: **\$25**.
---
### 🧠 **Brief Fundamental Insights:**
* **Bitcoin** is being heavily accumulated by institutional investors and whales. On-chain metrics suggest we are **not at a cycle top**, and the ongoing **supply shock** and **massive exchange outflows** are strong bullish signs.
* **Ethereum** is under **strong accumulation** from both retail and institutional investors, as confirmed by recent **CoinShares reports**.
* **Ripple** is awaiting resolution of its ongoing lawsuit with the **SEC**.
* **Sui** is consistently rolling out updates and shows **unstoppable DeFi ecosystem growth**, giving it strong fundamental support.
* **Solana** is being accumulated by institutional players, including **SOL-specific strategies** and funds.
* **Chainlink** is seeing buying pressure supported by **positive news and strategic partnerships**, some of which are from **anonymous large players**.
---
🧠 Updated Fundamental Analysis (June 2025)
Bitcoin (BTC)
New Investment Record: In May, total investments in crypto funds reached $167 billion, with Bitcoin accounting for $5.5 billion, signaling strong institutional demand.
Institutional Buying Surge: ETF purchases, entries by institutions like Paris Saint Germain, and even countries like Pakistan have contributed to declining exchange reserves of Bitcoin.
Favorable Macro Conditions: Rising bond yields, stock market volatility, and a weakening U.S. dollar have made Bitcoin more attractive as a hedge asset.
Ethereum (ETH)
Consistent Inflows: Ethereum funds have seen seven consecutive weeks of capital inflows, with nearly $296 million added in the past week alone.
Institutional Confidence: Assets under management (AUM) in ETH funds have reached approximately $14 billion, indicating strong long-term faith by institutions.
Solana (SOL)
Strong Institutional Demand: Firms like Société Générale and Siebert Financial have recently invested in Solana.
On the Verge of ETF Approval: Franklin Templeton filed for a spot Solana ETF back in February, potentially boosting demand.
Whale & DeFi Growth: Increased whale activity, growing DeFi ecosystem, and rising developer engagement hint at a potential price rally to $200 and beyond.
Ripple (XRP)
While there is no major new fundamental data recently, the listing of XRP futures on CME and broader access for institutional investors may have a positive impact.
The ongoing legal case with the SEC remains a crucial factor in XRP’s future outlook.
Sui (SUI)
DeFi Expansion: Active daily users have grown by over 14%, and decentralized exchange volume has reached around $34 million per day.
TVL Growth: Suilend’s Total Value Locked (TVL) has hit $700 million, ranking 8th among all blockchains.
Institutional Attention: There are reports suggesting that an ETF for SUI may be under consideration, with on-chain utility continuing to expand.
Chainlink (LINK)
Collaboration with Major Financial Institutions: Chainlink is participating in CBDC pilots between Hong Kong and Australia, working with Visa, ANZ, and the Hong Kong Monetary Authority.
Ecosystem Growth: Development is supported via grants, like the $150K funding provided to Lightchain AI, strengthening Chainlink’s infrastructure.
Strategic Partnerships: Collaborations with JPMorgan, Ondo Finance, and Swift highlight Chainlink’s growing influence in connecting real-world data to blockchains.
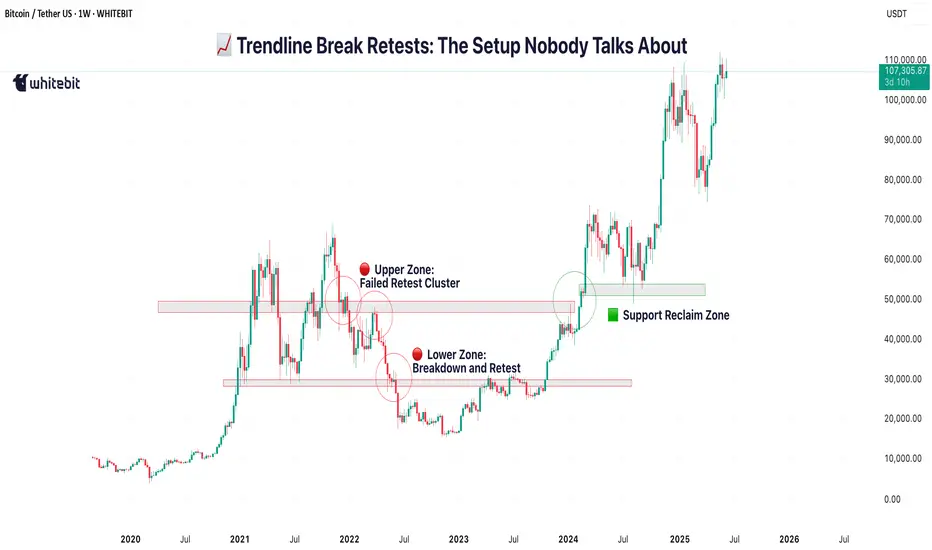
Trendline Break Retests: The Setup Nobody Talks AboutHello, Traders! 😎
It’s one of crypto's most overlooked yet commonly recurring structures: the trendline break and retest.
You’ve probably seen it without even realizing it. A clean trendline gets broken, price pulls away, and then, quietly, almost politely, comes back to “kiss” the line before taking off again. Or dropping.
That’s the retest. And in the chaotic crypto world, where hype often drowns out structure, this simple behavior deserves more attention.
🔍 First, What Is a Trendline Really?
A crypto trendline connects key highs or lows on a chart, not to predict the future, but to help visualize the mean price trendline: the market's directional bias. In rising markets, we draw support lines connecting higher lows. In falling markets, resistance lines link lower highs.
Learning how to draw trendlines in crypto properly is a skill in itself. Use wicks or closes? Log scale or linear? Everyone has a method, but consistency is key. If you’re unsure, zoom out and let the chart speak first. But once that line is broken, something changes.
🧠 Why Breaks (Alone) Are Not Enough
In theory, a break of the trendline means momentum has shifted. But in practice? Breaks happen all the time in crypto; many are fakeouts or short-lived. That’s where the trendline break and retest come in. It’s the market asking: “Are we done with this trend?”
Retests often create the cleanest entries for trend continuation, not because they guarantee success, but because they offer structure. They provide a technical “moment of truth” when buyers or sellers show their true strength. And if the retest holds? The move that follows tends to be more confident and less noisy.
📐 Trendline Break & Retest: Mapping the Larger Structure
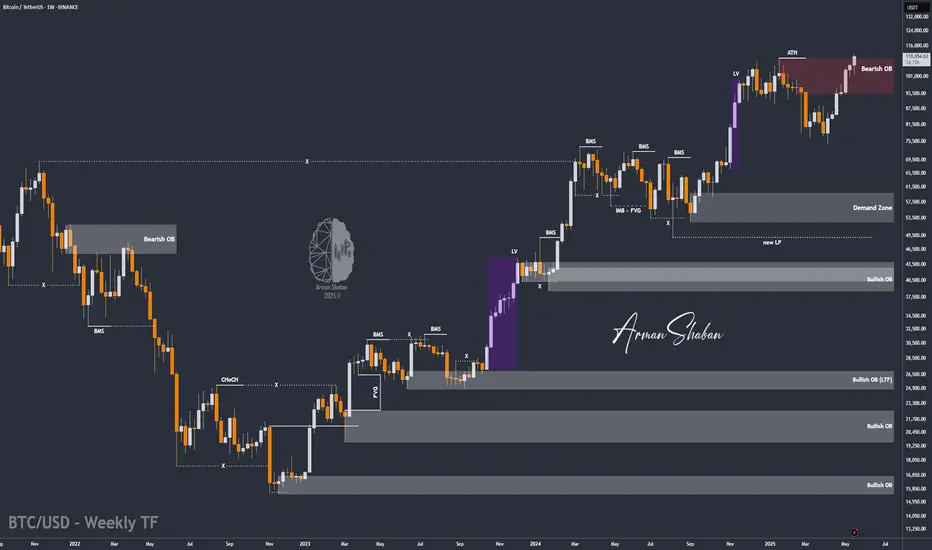
Looking across the full BTC/USDT weekly chart, several major shifts can be framed through the lens of trendline crypto behavior, particularly the classic sequence of break → retest → continuation.
🔻 2021–2022: Macro Breakdown
After the bull run to ~$69K in 2021, Bitcoin started forming a descending series of lower highs, which gave rise to a macro-level downward trendline — a key reference point for many traders at the time.
🔴 Upper Zone: Failed Retest Cluster
The upper horizontal band (~$47K–$52K) highlights a zone where BTC repeatedly attempted to reclaim the broken structure. Each time the price rallied into this region, sellers stepped in, forming local highs and multiple failed retests (marked with red circles). This wasn’t just resistance — it was a battleground where buyers tried to flip the trend… and couldn’t. This behavior often signals a trendline break rejection, where the market tests the underside of prior structure, then resumes the existing trend.
🔴 Lower Zone: Breakdown and Retest That Held
The lower zone (~$28K–$32K) was formerly a strong support area during mid-2021. Once it was broken in early 2022, the price returned to retest from below, failing to reclaim it, confirming it had turned into resistance. This is a textbook example of trendline retest turned supply, and after the failed reclaim, BTC slid further into the ~$16K range.
✂️ Late 2023: The Breakout
In late 2023, BTC finally broke above the descending trendline, confirming a long-term shift in momentum. Importantly, this wasn’t just a clean breakout. The market returned shortly after to retest the broken trendline, around the $42K–46K range, forming a consolidation zone.
🟩 And Then Came the Retest from Above
Let’s fast-forward to early 2024. After months of chop, Bitcoin finally breaks through that upper red zone (the same one that previously acted as resistance and rejection city). But here’s the part many miss:
It didn’t just moon.
It came back.
Look closely at the green zone around ~$46K–$48K, the same area where BTC got rejected multiple times in 2021–2022. And now? Price pulls back, taps that level from above, and holds.
That makes this zone so interesting: 👉 It’s a classic “retest from the other side”, where former resistance becomes support. The market is saying: “This level matters. Let’s make sure it holds before we go further.” It’s a quiet confirmation and a great example of how crypto trendlines and price memory shape behavior, even months or years later.
🪞 It’s Not Just About Lines — It’s About Psychology
Why does this pattern repeat?
Because breakouts are emotional.
They create FOMO. Traders rush in. Then the market pauses, tests your conviction, and shakes out the impatient.
Retests act like a filter.
They flush out the noise — and confirm who’s really in control.
That’s why drawing trendlines in crypto isn’t just about geometry. It’s about crowd behavior. When enough traders see the same line, and price respects it after the break, it becomes a self-fulfilling zone of interest.
🧭 A Word of Caution
This isn’t a secret formula. Not every trendline crypto setup will play out cleanly.
SOME BREAKS NEVER RETEST.
SOME RETESTS FAKE YOU OUT.
AND SOMETIMES, THE LINE YOU DREW ISN’T THE ONE THE MARKET IS ACTUALLY WATCHING.
But if you learn to draw trendlines in crypto clearly, stay patient, and observe the trendline break retest behavior, you’ll begin to see this pattern appear again and again. Quietly. Consistently.
It won’t make the headlines like “BTC Hits 100K,” but it might just tell the story behind that move. This is just one example. In reality, charts are full of these zones. Each one tells a part of the story. And honestly, why not listen?
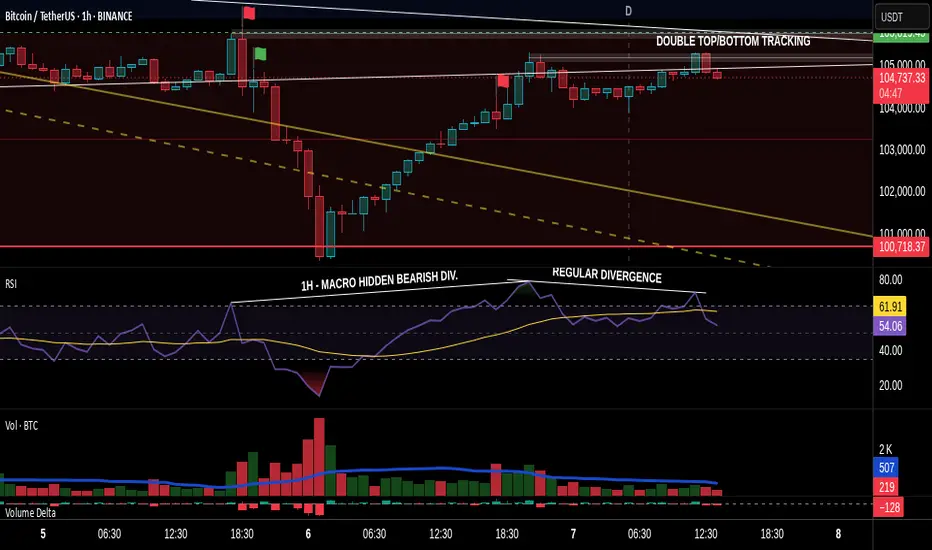
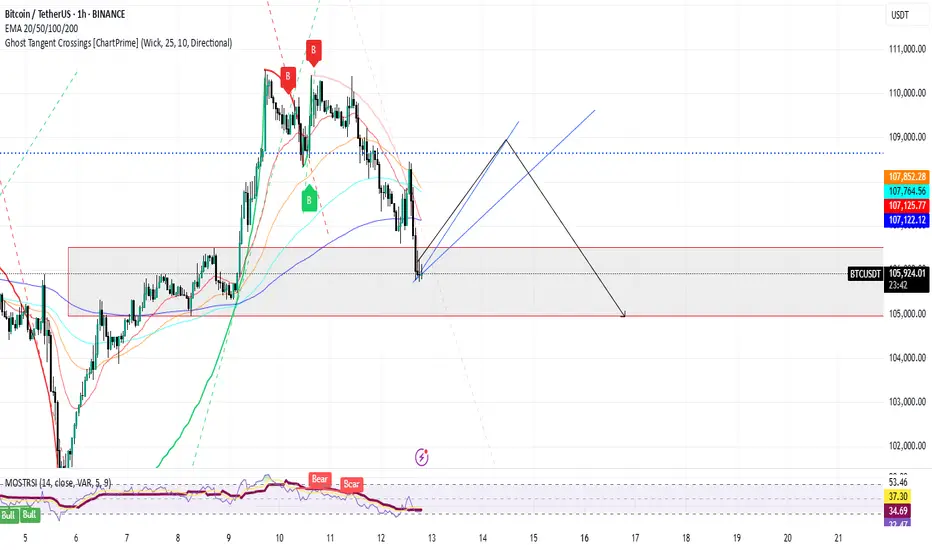
A Follow up to: “Adjustments for Better Readings & VSA vs BTC"When a trend approaches its end, we typically observe the formation of a buying or selling climax. That was certainly the case during Wyckoff’s era. Everything he described—market manipulation, signals, footprints—remains relevant today. But you know what that also means: if it's out there, it’s old news.
Yes, this is still happening, but we need to acknowledge that this information is no longer exclusive. And when a method becomes well-known—especially among retail traders—it can be used against them. Wyckoff himself hinted at this: the manipulators can and do use these same technical patterns to deceive. His real message?
“Keep an open mind.”
📉 In our current BTC chart, we’re seeing a textbook example of potential manipulation. A selling climax is visible—normally a sign of trend exhaustion and a bullish reversal. But is that really the case here? Did the downtrend truly end?
On the 1-Hour timeframe, both the RSI and volume indicators suggest otherwise: a bearish continuation seems more likely.
🧱 We're also witnessing a real-time formation of a Double Top pattern, taking shape since June 6. Measured by body candle spreads (excluding wicks), we observe four touches within a key price rectangle. These align with a known candlestick pattern: the Tweezer Top, commonly associated with bearish reversals.
What’s more, all of this is happening within a supply zone—actually three marked zones on the chart. The most recent zone shows signs of offloading pressure, amplified by both the Double Top and bearish candlestick formations.
And I haven’t even touched on the rejection wicks or how bearish volume spikes are gaining strength. That’s where the principle of Effort vs. Result comes in—remember, nothing in the market is free.
📊 In line with our past two posts, note how price action (PA) shows equal highs while RSI diverges, reinforcing earlier signals. The signs are stacking up.
So, the critical question now is:
Are we heading below the $100.718 level for a confirmed Head & Shoulders pattern?
Or is this just a retest before another move?
If this way of reading the market resonates with you and you want to go deeper—whether it’s building confidence or spotting signals before they play out—I work with a small circle of traders sharing TA privately on a daily basis. Feel free to reach out.
Till next time be well and trade wisely!
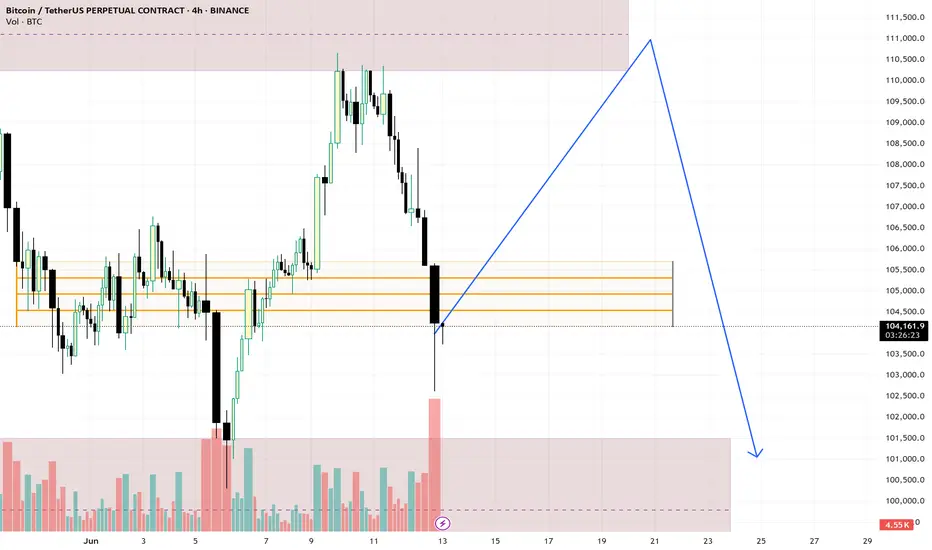
BTC SMC distribution BITSTAMP:BTCUSD That's my prediction about next BTC moves. It looks like classic SMC distribution phase. After reach ATH price failed to break it and fall. Soon I'm expecting move towards 108-110k before final strike down deeper than last time. According to my previous idea it was correct only I was wrong about top. Bearish harmonic pattern on daily time frame were correct
While they panic at 0.618, I loadThis is the type of setup that filters out noise traders. Four-hour price delivered into a stacked FVG zone — aligned with equilibrium, and structured to reprice.
Here’s the logic:
After taking out short-term highs near 111.9k, price repriced sharply — not randomly, but with algorithmic precision — into a series of untouched 240min FVGs.
Price tapped the upper imbalance, hovered at the 0.618 fib retrace (107.3k), and held. That’s not weakness. That’s orderflow.
Below this sits the final FVG + golden 0.786 (106.4k) and round number zone near 105.2k. That’s your invalidation layer. Anything inside it? Still Smart Money accumulation.
Above? The draw remains clear: inefficiency fill to 110.6k and liquidity resting above 111.9k.
My framework:
Bias: Bullish unless 105.2k gets violated with intent
Entry: 107.3k–106.4k
TP1: 108.5k (fib 0.382)
TP2: 110.6k (inefficiency fill)
Final objective: 111.9k raid
Volume confirms the handoff — sellers are trapped chasing the leg, Smart Money has already shifted to accumulation.
Final thought:
I don’t wait for signals. I wait for price to make sense. And here, it’s giving every reason to load.
“Fear at 0.618 is the edge of amateurs. Patience at imbalance is where precision lives.”

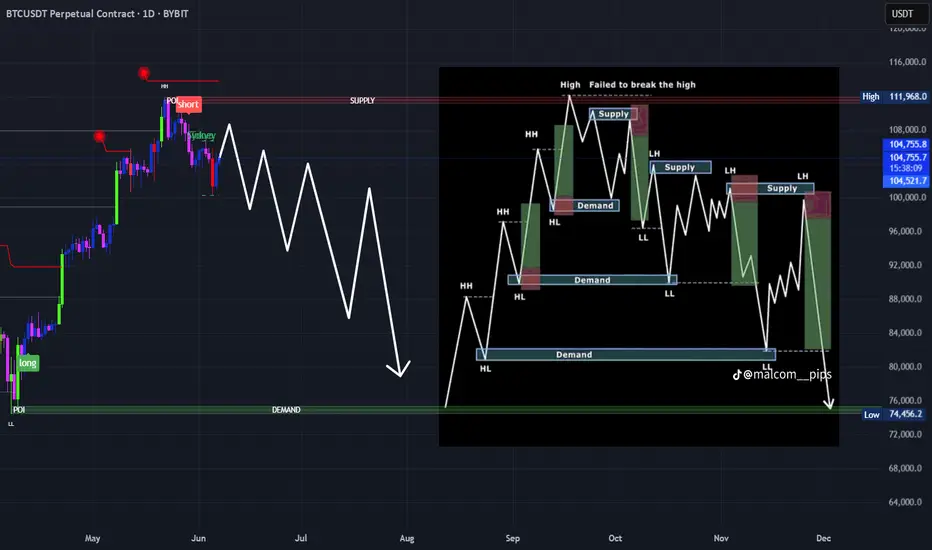
BTC ENDED WITH ITS BULL RUN AND NOW IS THE STARTING LINE OF BEARMark my words down as BITCOIN started with its bear RUN!!!
From the view, we can know that bitcoin is unable to break HH recently, and fall sharply align with Nasdaq100, which break through the bull trend from the 4hr view and also daily view. 4% SL and TP 27% pullback bear run is very beneficiary.
When more and more big whale players come in to this game, you have to know who is the banker for now. Binance? Coinbase? Nope. The boss is CME.
$BTC/USDT MAJOR PUMP? or MAJOR DUMP?BTC, the worlds biggest and fastest growing coin. With a market cap in the Trillions, we are facing a major moment.
Will price dump? or will it pump and go above and beyond.
Lets find out in this analysis!
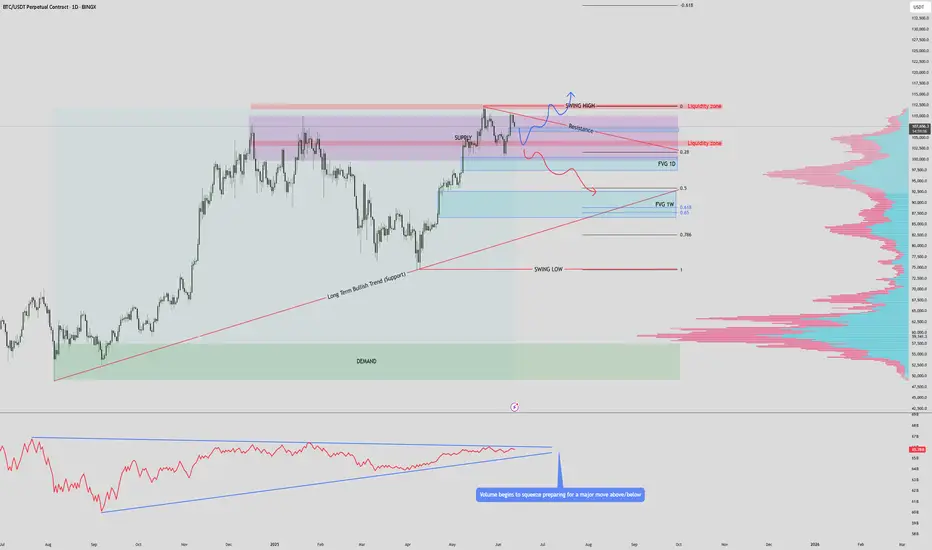
1. Trend Overview
HTF Bullish:
Price remains above the long-term bullish trendline, showing strong macro support.
Recent price action is consolidating within a major supply zone and liquidity cluster — signaling indecision before a breakout or breakdown.
📈 2. OBV (On-Balance Volume) Analysis
OBV is coiling in a symmetrical triangle, indicating a volume squeeze.
This tightening range typically precedes a major breakout or breakdown, matching the price consolidation near resistance.
🔄 Market Structure
Price has formed a potential top just under the supply/liquidity zone (~$110,000–$112,000).
Swing High is defined just below $112K.
Key structure zones are:
Resistance zone at current levels.
Support zones:
1D FVG ($97K) and Weekly FVG ($87K–$93K)
🟪 Supply & Demand Zones
Supply Zone: $100k - $112k — multiple rejections here indicate this is a key short-term ceiling.
Demand Zone: Deep support between $50-$57K, aligns with trendline and historical value area.
🔵 Fair Value Gaps (FVGs)
1D FVG: $97K area — may act as magnet if price breaks below resistance.
1W FVG: $87K–$93K — stronger structural level to watch.
If both are filled, price may meet the bullish trendline around $90K.
🧠 Liquidity Zones
Above current price: ~$112K is marked as a liquidity grab area — stop hunts may occur before major reversal.
Below: FVG zones could trigger a liquidity sweep downwards before reversal.
🔴 Volume Profile
Strong high-volume node (HVN) around $80K–$97K: acceptance zone, likely to act as magnetic support.
Above $110K is a low-volume node (LVN): if broken cleanly, price may accelerate quickly toward $120K+.
✅ Bullish Scenario
Break above $112K → sweep liquidity → continuation toward $120K–$125K. (Price Discovery)
OBV breakout upwards would confirm.
Hold above FVG 1D if retested = healthy bullish continuation structure.
❌ Bearish Scenario
Rejection at supply → drop to FVG 1D ($97K), then potentially Weekly FVG (~$93K).
If OBV breaks downward, it confirms bearish volume divergence.
Breakdown below trendline could target deeper into demand zone (~$70K+).
📌 Summary
Bias: Neutral-bullish short term, bullish macro (above trendline).
Key Breakout Level: $112K.
Critical Support: $91K–$97K (FVG cluster).
Confirmation: OBV breakout + clean structure break.
Invalidation: Weekly close below long-term trendline and FVG zones.
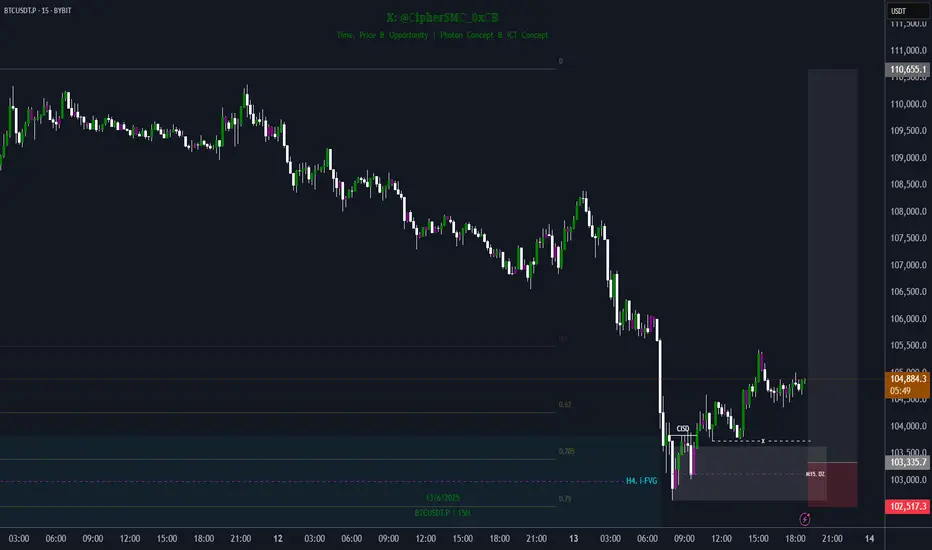
BTC Long Trade Setup IdeaWhy go long here?
1. Fill H4 i-FVG
2. OTE Zone
3. Bullish CISD
Trade Setup Idea:
- Entry Range: 103734.2 - 103020.2
- Stop Loss (SL): 102517.3
- Target Level: 100350.0
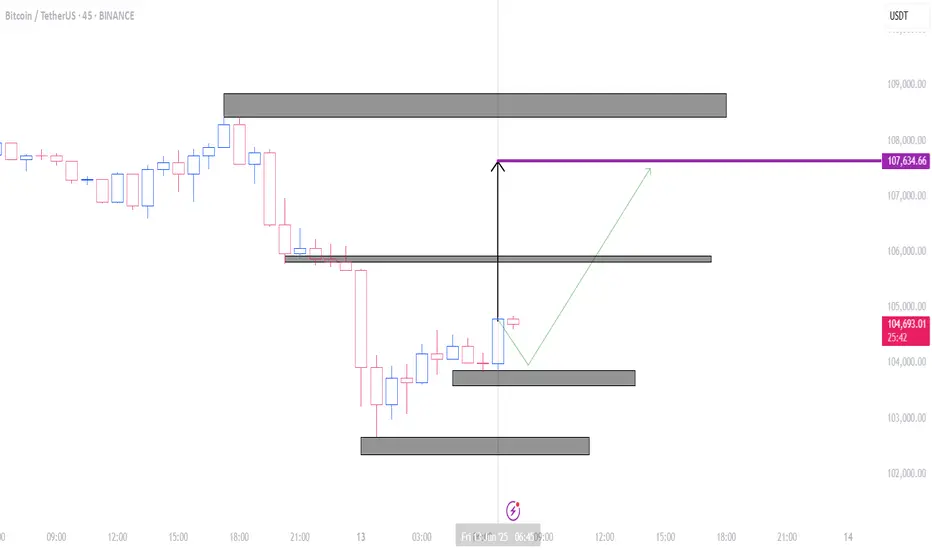
btc movement in 45minAfter the formation of strong bullish candles, in my opinion, an upward movement can be expected. The targets are shown on the chart.
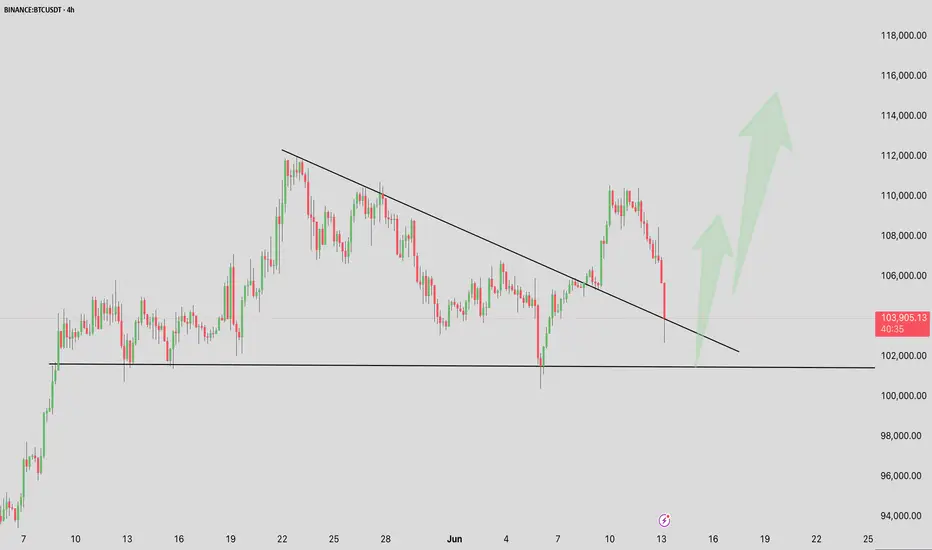
BTC/USDT 4H Chart Update –BTC/USDT 4H Chart Update –
After a strong rejection from the $110K+ zone, Bitcoin is now retesting a critical trendline support on the 4-hour chart.
Key Highlights:
Price dropped sharply to $103K, almost tagging the key ascending support zone.
The previous breakout from the descending trendline is now being retested, which is a classic bullish retest pattern.
If bulls defend this region successfully, expect a potential bounce towards $108K–$ 114 K.
However, a clean breakdown below $102K would shift short-term momentum bearish.
Eyes on this zone. High-probability decision area.
Watch for reaction candles and volume spikes to confirm the next move.
Thanks for your support!
DYOR. NFA
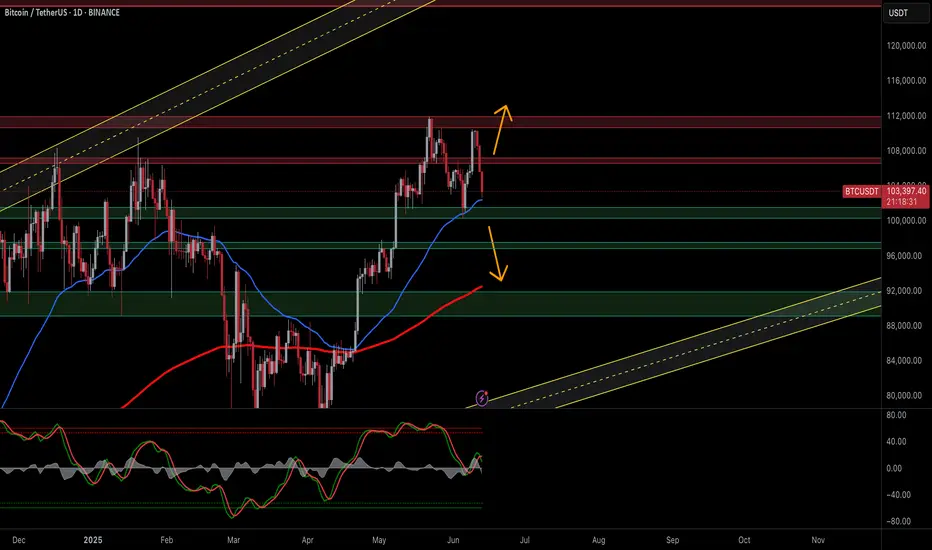
BTC Reacts to Iran–Israel Escalation: Risk-Off Sentiment GrowsBitcoin (BTC/USDT) — Caught Between Fear & Fundamentals
Technical Outlook — 13 June, 2025
Current Market Condition:
Bitcoin has dropped to $103,818 after facing rejection from the $106.8K–$108K resistance zone, coinciding with heightened geopolitical stress following renewed military escalation between Iran and Israel. Traditional markets are showing signs of risk aversion, and while Bitcoin is often seen as a hedge, the current flight to USD liquidity and defensive assets is putting pressure on high-beta instruments like crypto.
The psychological $100K support zone, which aligns with the EMA 50 and a key Fib level, is the immediate area to watch. A failure here could expose Bitcoin to deeper retracement toward $96,800 and potentially $92K, especially if global tensions worsen or investors rotate further into cash and gold.
Key Technical Highlights:
Rejection at supply zone near $106,888–$108,000.
Support at $100K holds structural and psychological importance.
Stochastic shows bearish momentum crossover, increasing downside probability.
EMA 200 at $92K could act as ultimate cushion in a full-blown correction.
Volatility likely to remain elevated amid Middle East conflict and global uncertainty.
Trade Plan:
🔼 Bullish Relief Bounce (Long Bias):
Trigger: Reclaim and hold above $106,888 with rising volume
Target: $108K → $112K → $116K
Stop Loss: Below $103,500
🔻 Geopolitical Risk Sell-Off (Short Bias):
Trigger: Break and close below $100,000
Target: $96,816 → $92,000 → $88,000
Stop Loss: Above $102,500
📉 Dip Buy Strategy:
Trigger: Price stabilizes at $96.8K with divergence and calming geopolitical headlines
Target: $103K → $106K
Stop Loss: Below $95K
🛡️ Risk Management Note:
With geopolitical risk driving short-term sentiment, expect volatility spikes, whipsaws, and fake breakouts. Remain nimble and manage exposure carefully — especially during weekend sessions when crypto trades unhedged and news developments can occur without warning.
📢 If you found this analysis valuable, kindly consider boosting and following for more updates.
⚠️ Disclaimer: This content is intended for educational purposes only and does not constitute financial advice.
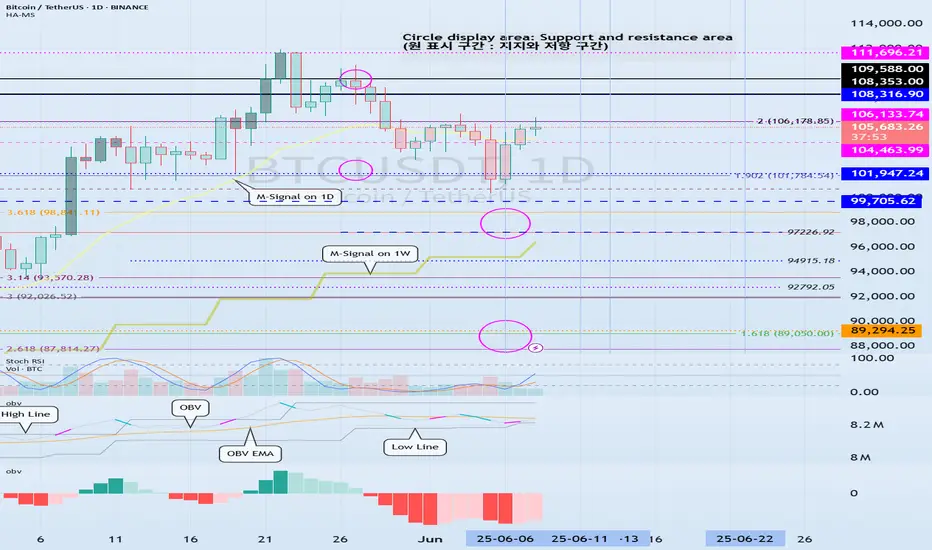
Support and resistance zone: 104463.74-106133.74
Hello traders.
If you "Follow", you can always get new information quickly.
Have a nice day today.
-------------------------------------
(BTCUSDT 1W chart)
When a new candle is created, you should check if the HA-High indicator is created at the 99705.62 point.
The reason is that the HA-High indicator was created, which means that it has fallen from the high point range.
In other words, it also means that it can fall to around or below the 97705.62 point.
Since the current candle fell to around 99705.62 and then rose, it can rise like this when a new candle is created.
We have several indicators that can determine the high point.
Representative indicators include DOM (60), StochRSI 80, and HA-High.
Therefore, the high point range is 104463.99-104984.57 and 97705.62.
Therefore, in order to turn downward, it is likely to start when it falls below 104463.99-104984.57 and shows resistance, and it can be interpreted that the downtrend is confirmed when it falls below 97705.62.
If we think about it the other way around, if the price stays above 104463.99-104984.57, it will eventually create a new high.
-
When we first study charts, we start to become curious about charts as we learn about price moving averages.
As such, when we look at charts, our understanding of charts changes depending on how well we understand the average value.
However, when we first learn about price moving averages in chart analysis, we start to study all sorts of different analysis techniques as we realize that there are ambiguous parts in conducting transactions.
As a result, chart analysis becomes more and more difficult, and we end up giving up on chart analysis.
If you have studied chart analysis in your own way without giving up on it, you will realize that it will eventually converge to the average.
No matter what indicator or analysis technique you use, you will eventually converge to the average and then diverge.
Therefore, we should try to analyze the chart using the easiest and most convenient method.
The reason is that chart analysis is ultimately just a means to create a trading strategy and has no other meaning.
-
The basic trading strategy on my chart is to buy near the HA-Low indicator and sell near the HA-High indicator.
The HA-Low and HA-High indicators are indicators created for trading on the Heikin-Ashi chart and ultimately represent the average.
The HA-High indicator is the average value that represents the high point range, and the HA-Low indicator is the average value that represents the low point range.
Therefore, if it is supported and rises near the HA-Low indicator, it is a buying period, and if it is resisted and falls near the HA-High indicator, it is a selling period.
However, since it is an average, if it is supported and rises near the HA-High indicator, it is likely to show a stepwise upward trend, and if it is resisted and falls near the HA-Low indicator, it is likely to show a stepwise downward trend.
Because of this, we need to adopt a split trading method.
-
The auxiliary indicator, StochRSI, is an indicator that moves based on the 50 point.
Therefore, when the StochRSI indicator value is below 50, we need to focus on finding a buying point, and when it is above 50, we need to focus on finding a selling point.
A decisive hint for this is when it enters the overbought or oversold zone.
The auxiliary indicator, OBV, is an indicator that adds up the difference in trading volume according to price.
If you divide the OBV indicator into High Line and Low Line and understand the movement of OBV, you can understand the movement of the price to some extent.
However, since not all indicators follow the price trend exactly, you should not try to judge everything with just one indicator.
If you express the OBV indicator in the form of an oscillator, it will look similar to the MACD oscillator.
As I mentioned earlier, this is because the chart eventually converges to the average value.
Using this characteristic, we combined the OBV indicator with a MACD-type oscillator.
If it is located below 0 based on the 0 point, it means that the selling pressure is high, and if it is located above 0, it means that the buying pressure is high.
No matter what indicator or analysis technique you study, you must have a solid basic understanding of the average value.
If not, no matter how good the indicator or analysis technique you learn, you will not be able to analyze it as you studied and create a trading strategy when you actually trade.
-
(1D chart)
It is highly likely that the uptrend will resume if it rises above the HA-High indicator point of 108316.90.
To do so, it is important to see if it can receive support and rise around 104463.99-106133.74.
If it fails to rise, it will eventually show a downward trend again.
If it meets the HA-High indicator and falls, it is likely to fall until it meets the HA-Low indicator.
Currently, the HA-Low indicator is formed at the 89294.25 point, but as the price falls, the HA-Low indicator is likely to be newly created.
Therefore, we need to check if the HA-Low indicator is newly created when the price falls.
Since the OBV of the auxiliary indicator is located near the Low Line and the OBV oscillator is also located below the 0 point, we can see that the selling pressure is strong.
Therefore, we need to check whether the OBV rises above the High Line when it is supported near 104463.99-106133.74 or whether the OBV oscillator rises above the 0 point.
-
I think that all indicators or analysis techniques are ultimately tools that confirm whether there is support at the support and resistance points or sections drawn on the 1M, 1W, and 1D charts.
Therefore, in order to use indicators or analysis techniques, it depends on how well you understand and draw the support and resistance points or sections according to the arrangement of the candles.
Therefore, you need to first check how reliable the support and resistance points you drew are and practice creating a trading strategy accordingly.
Ultimately, it can be seen that how well the support and resistance points are drawn depends on how well the chart analysis or trading strategy is made.
-
If you look at the 1W chart and the 1D chart, you can see that the important volatility period is around June 22.
The volatility period of the 1W chart is from June 16 to 29.
The volatility period of the 1D chart is from June 10 to 14 and from June 21 to 23.
Therefore, when the HA-High indicator of the 1W chart is generated at the 99705.62 point, it is important to maintain the price above 99705.62 after passing the volatility period of the 1W chart.
Since the HA-High indicator on the 1D chart is formed at 108316.90, we need to see if it can be supported and rise near 108316.90.
In summary, we can see that the important support and resistance range in the volatility period is 99705.62-108316.90.
Among these ranges, it is expected that the wave will start depending on whether the current price is supported in the 104463.99-106133.74 range.
In other words, the 104463.99-106133.74 range corresponds to the middle range of the 99705.62-108316.90 range, the average value.
-
Thank you for reading to the end.
I hope you have a successful transaction.
--------------------------------------------------
- This is an explanation of the big picture.
(3-year bull market, 1-year bear market pattern)
I will explain more details when the bear market starts.
------------------------------------------------------
Bitcoin Double Top FormationIf we lose 102k we will dump to 97-93k and alt will rugged
but if we can hold maybe sideway and retest 110k again

BTC - On its way down from these trendlines How low can we go? We will find out.
Three bearish intersecting trendlines above.
Short began initiating from above as per my previous post.
I personally am not ruling out a flash crash to 10,000.
DXY is breaking down a major bearish trendline on the weekly / monthly - Market has a prime opportunity to manipulate Bitcoin into all of these long stop losses and trigger a massive liquidation event.
Stay alert and safe!

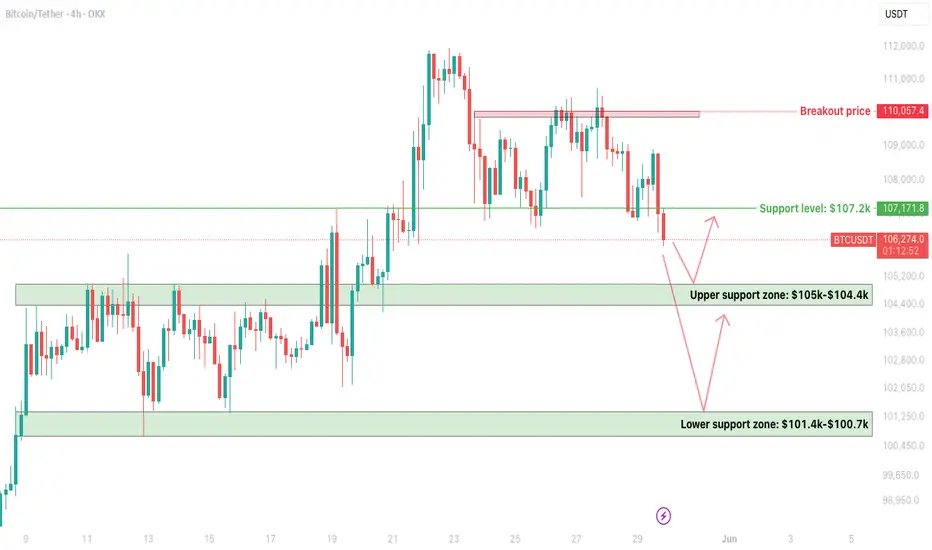
BTC 4H – Critical Support Zones Being TestedCRYPTOCAP:BTC is currently retesting its $107.2k support, which has now turned into resistance after a decisive breakdown.
Support Levels to Watch:
- Upper Support Zone: $105k – $104.4k
- Lower Support Zone: $101.4k – $100.7k
Bounce from $104.4k–$105k will be a temporary relief, but it needs strength to reclaim $107.2k.
If the upper zone is not held, the next leg will be towards the lower zone, near $101.4k—$100.7k.
Breakout confirmation only above $110k (previous rejection zone).
The market is showing signs of weakness, especially with increased selling around resistance. Avoid rushing into trades—better setups may come if key zones hold or break.
Tip: Watch for bullish divergences or strong volume at the lower support for potential reversal setups.
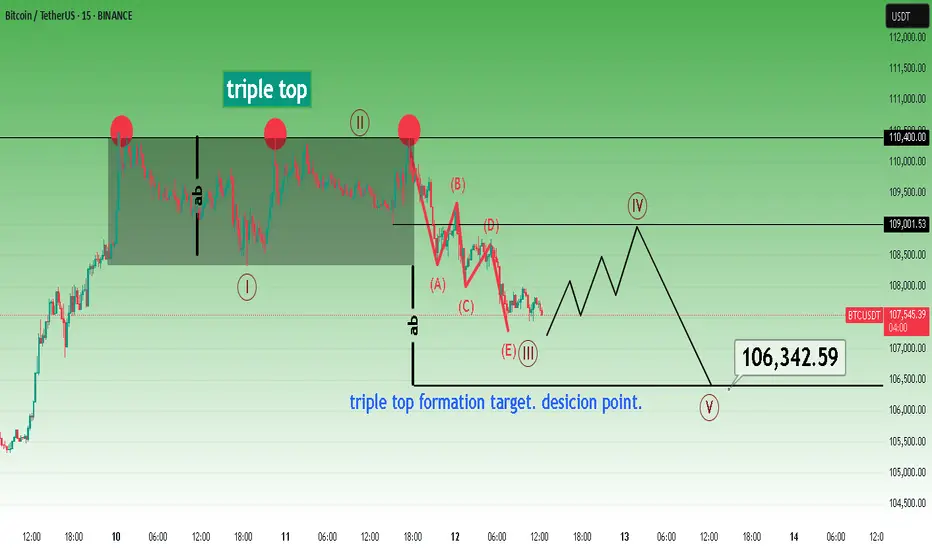
Bitcoin short term triple top pattern target.The most likely scenario in my opinion.
* The purpose of my graphic drawings is purely educational.
* What i write here is not an investment advice. Please do your own research before investing in any asset.
* Never take my personal opinions as investment advice, you may lose your money.
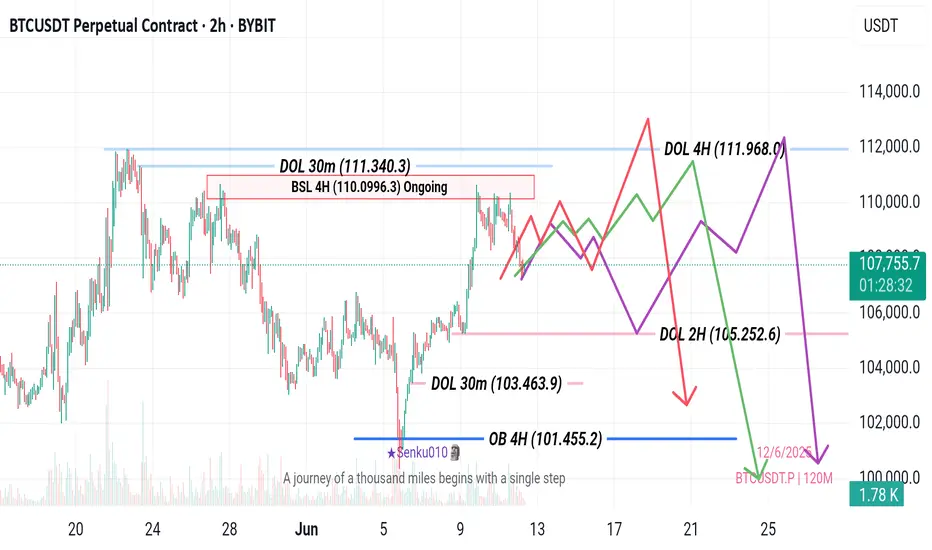
BTC Bias Update tug-of-war between key liquidity zones
• Liquidity Magnets:
• Upside: Identified Draw on Liquidity (DOL) at higher levels (e.g., 111,968.0 (4H), 111,340.3 (30m)) and an "Ongoing" BSL 4H at 110,0996.3 present resistance and potential targets for bullish moves.
• Downside: Prominent DOLs (e.g., 105,252.6 (2H), 103,463.9 (30m)) and a critical SSL zone between 100,500.0 - 100,000.0 (4H, 2H, 1H) act as significant downside targets.
Bias Assessment:
• Bearish Bias: 65%
• The immediate price action suggests a likely "Draw on Liquidity" towards the substantial Sellside Liquidity (SSL) zone around $100,000, consistent with recent minor bearish momentum.
• Bullish Bias: 35%
• The bullish case hinges on a potential strong reversal from the confluence of the $100,000 SSL and the powerful Bullish Order Block, which could then target the overhead Buyside Liquidity.
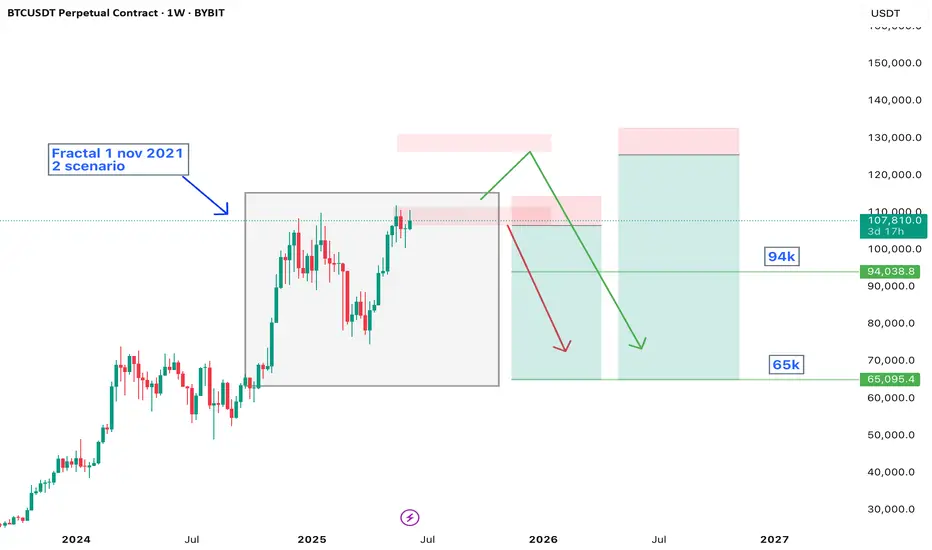
BTC game plan. 65k soon?This is my gameplan to trade Bitcoin.
Technically, there's 2 key zones to short with a nice Risk-Reward.
It's minimum profit reward on 94k, and possible to see 65k breakeven free trade.
Subscribe to earn more