Layout TestHello World
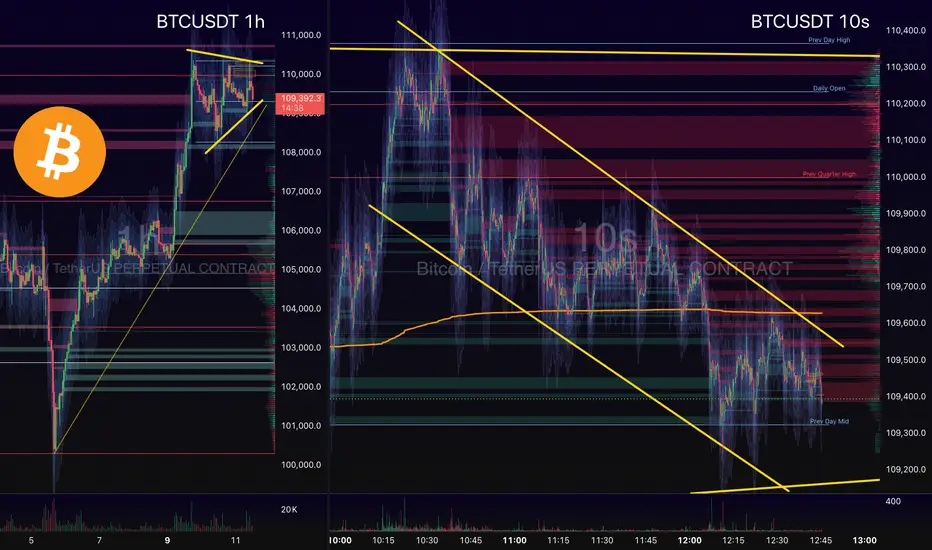
HTF - 1h timeframe on left
LTF - 10s timeframe on right
FVG zones and Volume Profile
Key Levels
BTCUSDT.3S trade ideas
Trade #12: $BTC - Bullish Alignment Confirmed! Long Setup WatchRecap & Lesson Learned:
In Trade #11, I noted the daily structure was strongly bullish, but the 1HR chart was bearish. My expectation was for price to dip toward the 98,000 daily demand zone. However, the 1HR structure reversed structure before reaching that level — a reminder that markets don’t always follow our ideal path.
The Shift: Timeframe Synced = Conviction Amplified!
Now, BOTH daily AND 1HR structures are BULLISH and aligned. This synchronization signals robust momentum, and I’m positioned fully bullish — awaiting the right technical trigger to enter a long trade.
The Opportunity: Precision Entry at Demand
I’m eyeing the green demand zone near 106,500 for a potential long entry. This is where buyers previously stepped in aggressively, making it a high-probability reaction area.
Key Refinement: Patience & Confirmation
(Learning from Trade #11):
I will NOT enter blindly at 106,500. Instead, I’ll:
1️⃣ Watch price behavior for signs of strength
2️⃣ Confirm my entry criteria are met
3️⃣ Execute ONLY if evidence validates the setup.
Why This Discipline?
"It’s better to enter slightly higher WITH confirmation than chase a ‘sniper entry’ without confirmation."
No confirmation = No trade. Period.
My Plan:
WAIT for price to test ~106,500.
CONFIRM buyer strength and alignment with my rules.
EXECUTE a long position only if all boxes are checked.
Stay Alert, Stay Patient.
The trend is our friend — but only if we respect its rhythm. Updates to follow!
✅ Key Takeaways:
Daily + 1HR = Bullish Synergy.
Watch 106,500 for a confirmed long entry.
No confirmation = No trade. Discipline over FOMO.

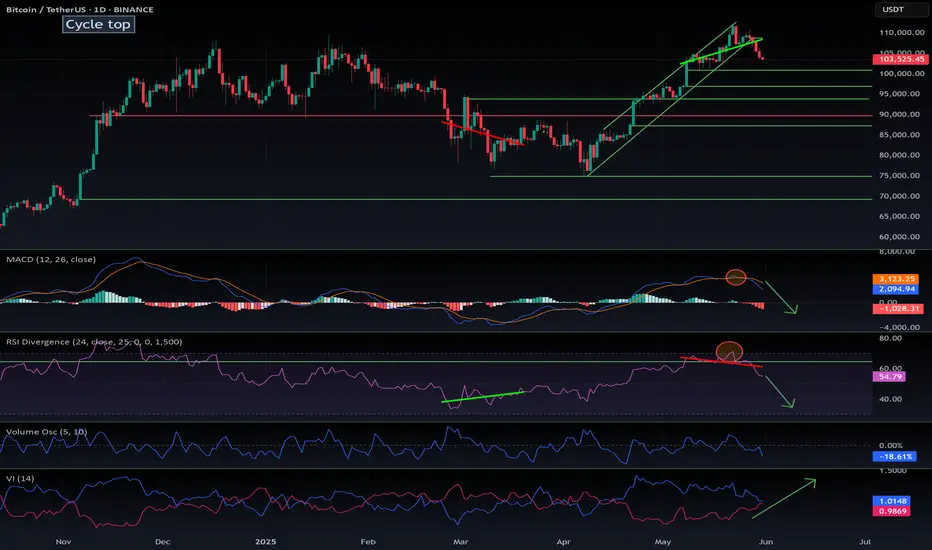
$BTC correction has just started. What is coming next?As I previously stated in my CRYPTOCAP:OTHERS , CRYPTOCAP:BTC.D , and CRYPTOCAP:TOTAL2 analysis — this move was expected. Check out my other ideas for more detailed breakdowns.
So, what’s happening?
Bitcoin maximalists have been buying heavily at the top, right when RSI and MACD were in overbought territory, creating a clear bearish divergence.
Something Saylor and others seem to ignore: you can't defy mathematics — what needs a correction will correct.
CRYPTOCAP:BTC still looks bullish on the weekly timeframe, so we’re not entering a bear market. However, the pump is over, key supports have broken, and altcoins are correcting — some by -25% in a single day.
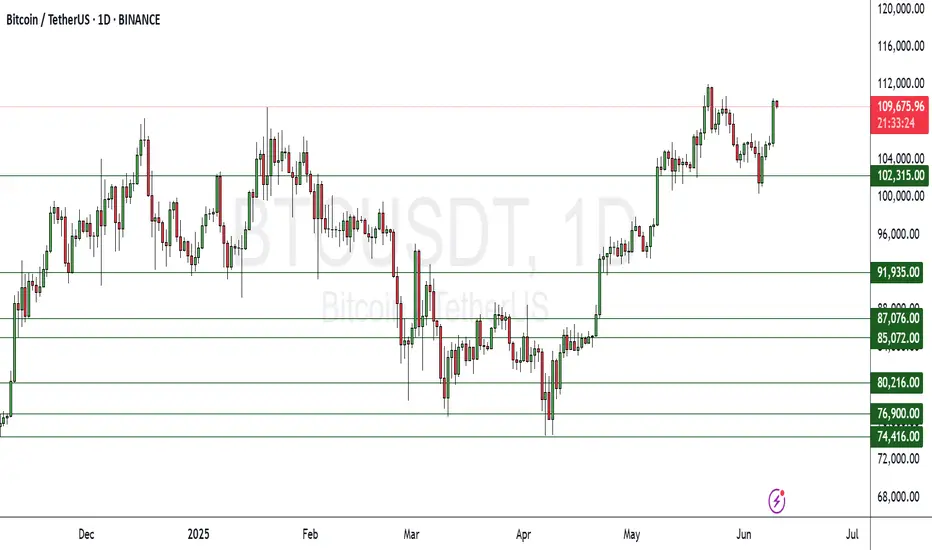
Purely from a charting perspective, we can identify multiple potential support levels for CRYPTOCAP:BTC :
$101K, $94K, $89K, $87K, with a lower-probability retest down to $75K.
We’re likely entering a 2-week correction, after which CRYPTOCAP:BTC could resume its uptrend — potentially closing June at a new all-time high.
DYOR.
#Bitcoin #BTC #Altcoins #CryptoCrash #TechnicalAnalysis #BTCdominance #TOTAL2 #BearishDivergence #Saylor #RSI #MACD #ATH #DYOR
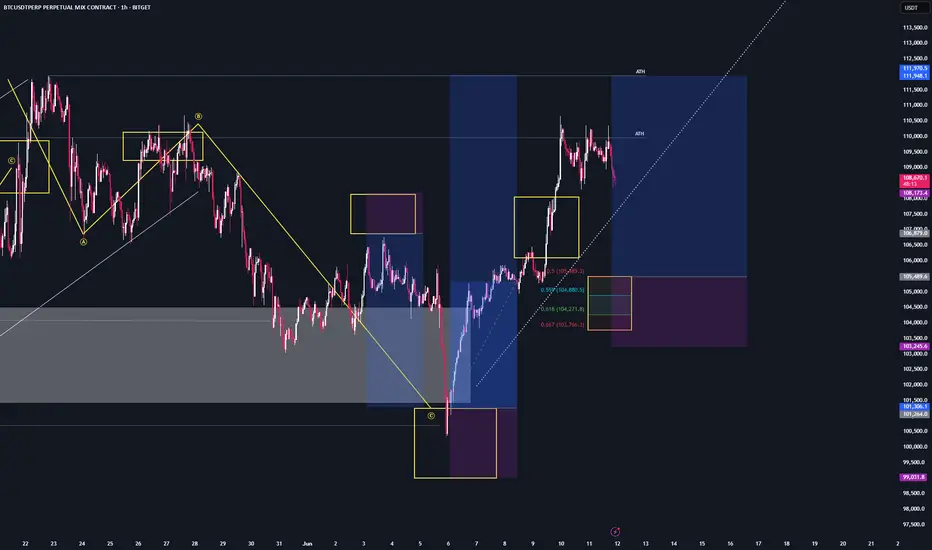
Bitcoin Rally Overextended: Patience is Key for the Next Move💹 BTC/USDC – Bullish Outlook, heres my Trade Plan.
Bitcoin (BTC/USDC) is currently maintaining a strong bullish trajectory 🚀, showing impressive momentum after breaking through recent resistance levels 🔓.
However, price is now overextended from the last swing low, and I’m anticipating a pullback into value 🔄 — specifically targeting the 50%–61.8% Fibonacci retracement zone drawn from the latest swing low to swing high 📐. This zone often acts as a rebalancing point for institutional traders and provides confluence for smart entries 🎯.
I’ll be closely watching this retracement area for signs of support forming, and more importantly, a bullish break in market structure 🧠📊. Only after that confirmation, would I consider executing a long position — no structure break, no trade ✅.
This isn’t about predicting — it’s about reacting with discipline.

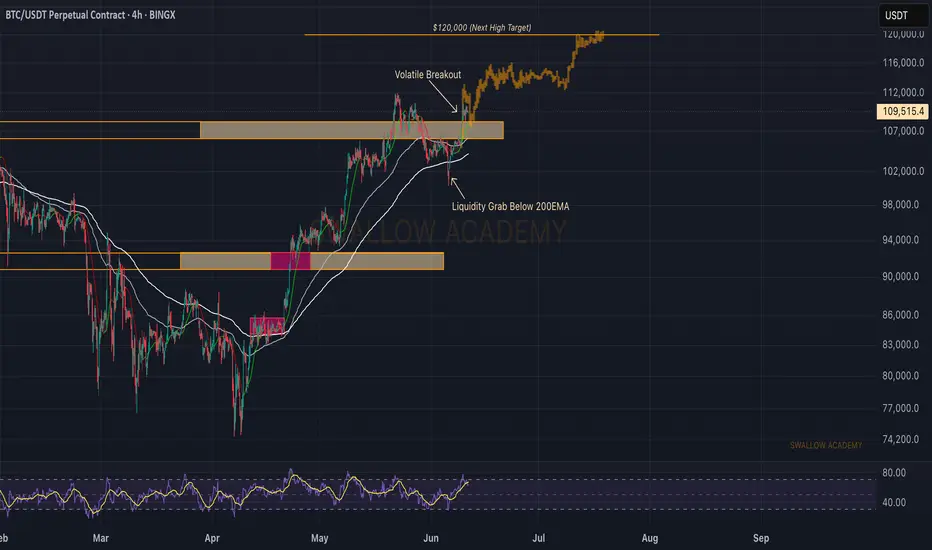
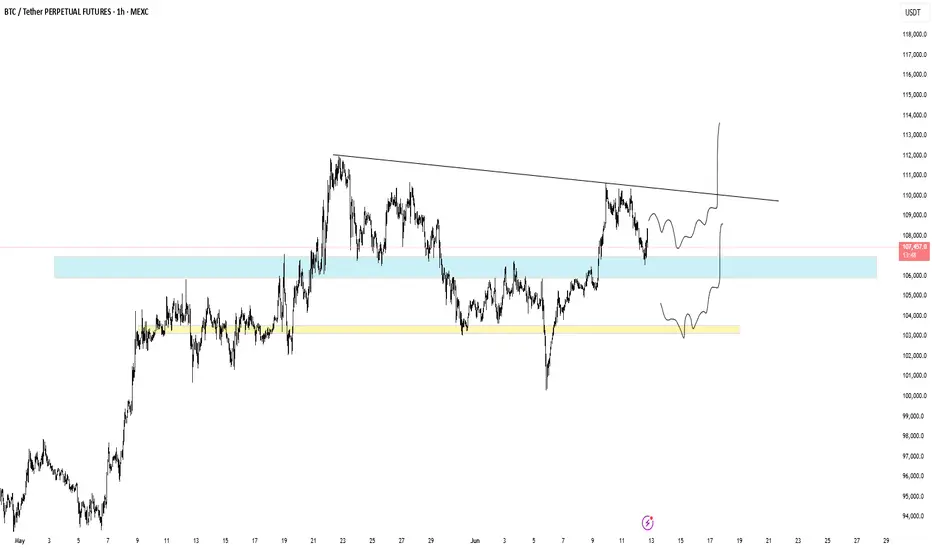
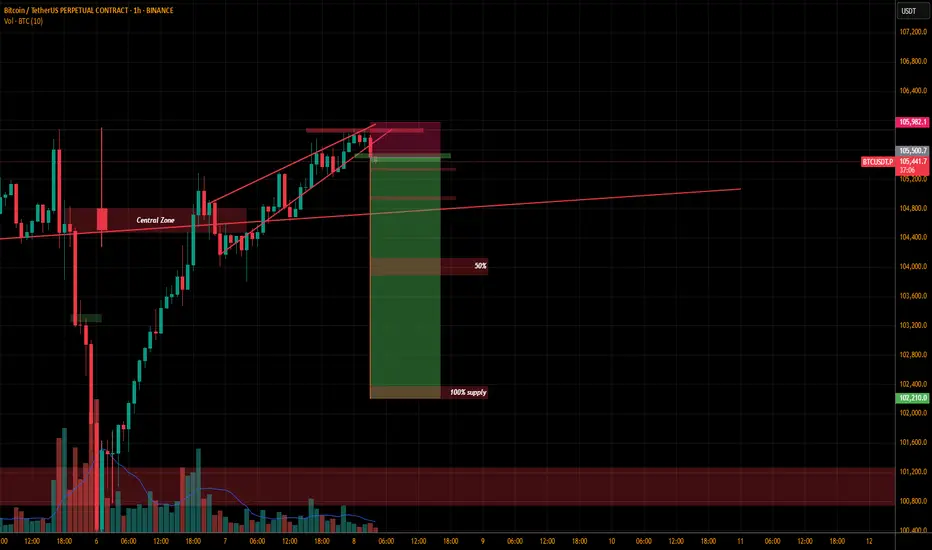
Bitcoin (BTC): Buyers Maintain The Dominance After BreakoutBuyers keep the dominance after we had that volatile breakout near $106K. As we see that buyside volume is growing, we are expecting to retest the local ATH, which is basically 1.5K away from the current price (basically nothing).
After that, we are expecting to see some volatility, which eventually will turn into a breakout and a new ATH!
Swallow Academy
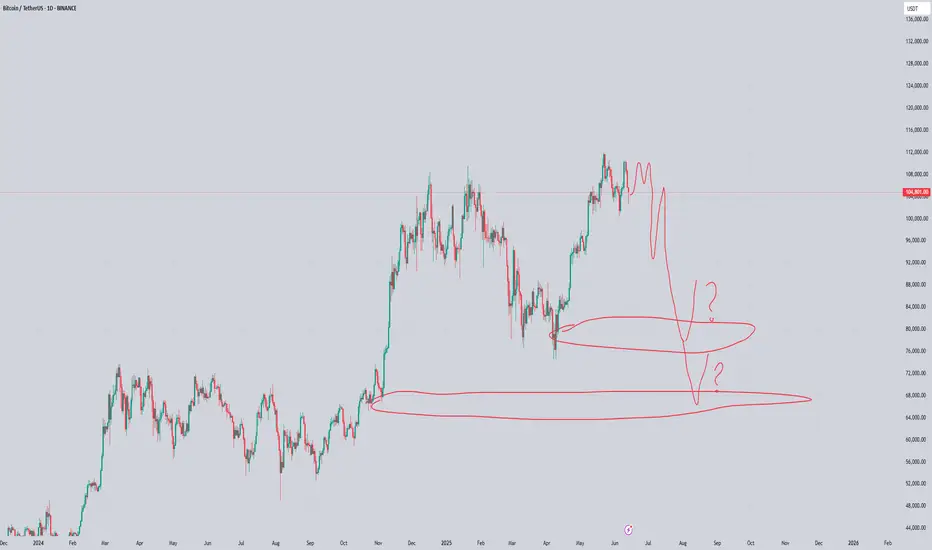
A possible 100k scenario?Good day!
Its been a while since a bloodbath. And there is another possible cycle down to 100k. Will this continue?
#NFA
#TYOR

CAN YOU SPOT THE BULLISH FLAG THERE?As usual, I love clean chart. too much is too much. So, tell me whether there is a formation of bull flag there? (are we seeing the same continuation?) retracement a bit this weekend and it will continue to bull next week?
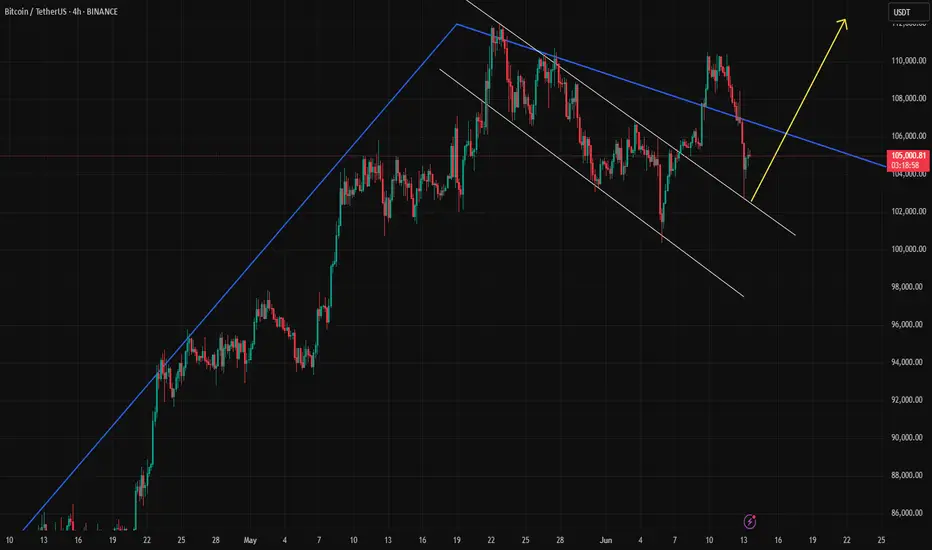
BTC will be 74k soon/i sell all my altcoins I found fractals that confirm my idea, let's call this pattern “dragon wings.” I think the price will fall to $74k at best, and from there I will consider buying.
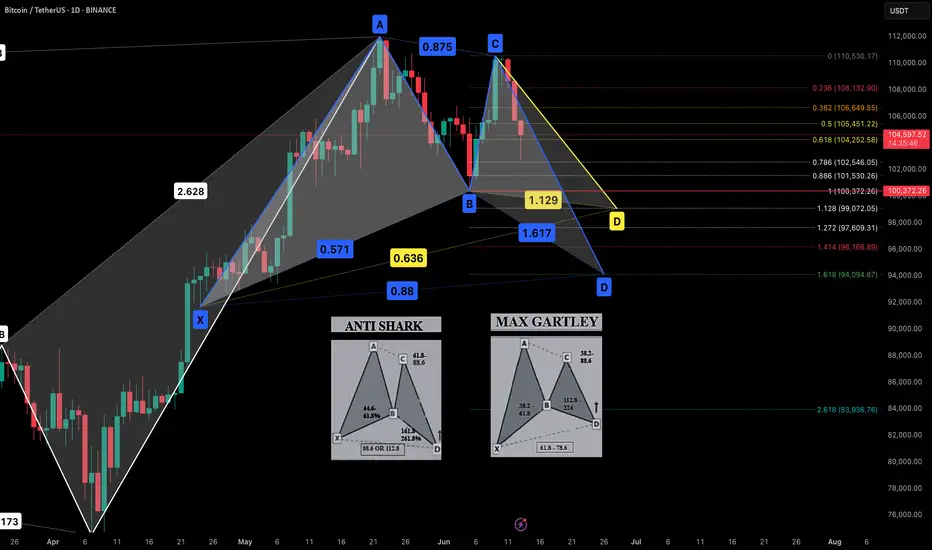
BTC harmonics2 btc harmonic possibilities to watch out for. Of course, everything can be invalidated, but they are on the chart for now until invalidation.
DeGRAM | BTCUSD correction from the 110k level📊 Technical Analysis
● Price has reclaimed the rising-channel median at ≈106.8 k and immediately made a higher-high on expanding volume; hourly RSI also pierced its two-week bear trend, flagging fresh upside energy.
● An ascending triangle is forming between 107 k support and a 109.5 k ceiling; its measured move coincides with the red supply/upper rail at 111.6-112 k.
💡 Fundamental Analysis
● Softer US PPI (-0.1 % m/m) dragged real 2-yr yields to one-month lows, easing dollar pressure, while spot-ETF desks soaked up another ≈4 600 BTC this week, signalling renewed institutional demand.
✨ Summary
Stay long above 107 k; triangle break over 109.5 k unlocks 111.6 k then 115 k. Long view invalidated on a 4 h close beneath 103 k.
-------------------
Share your opinion in the comments and support the idea with a like. Thanks for your support!

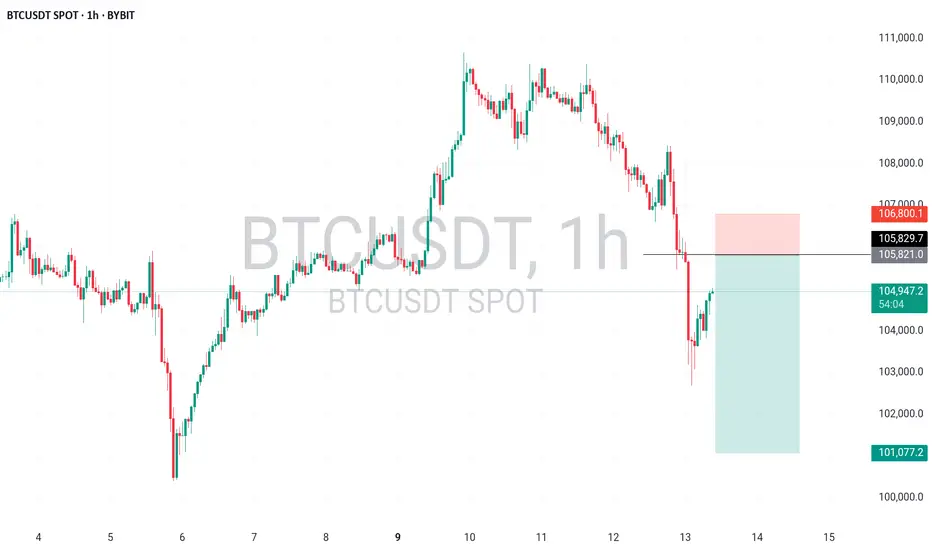
BTCUSDT ShortBTCUSDT – Watching 105.8K–106.5K Supply Zone
Price currently retracing after a strong dump from 108K. I'm eyeing the 105.8K–106.5K zone for a potential short — previous order block + premium zone for smart money selloff. If price rejects there, I’ll target 103.5K and possibly 101K. SL above 106.8K.
Structure still bearish until proven otherwise.
BTCUSD Long-Term Buy Recommendation📌 BTCUSD Long-Term Buy Recommendation
🚨 BTCUSD Buy Recommendation – Magnet Area Identified
Here is the Magnet Area for a potential buy zone on BTCUSD, marked clearly with the green line on the chart.
This area has been technically identified as a strategic accumulation zone for long-term investment.
It is crucial to consider partial buying in this zone using a portion of your capital allocated for long-term crypto exposure.
🟩 Green Line = Suggested Buy Area
💰 Strategy: Gradual accumulation, not all-in
⏳ Timeframe: Long-term holding (2–5 years)
🎯 Objective: Build position during discounted price range
Patience and risk management are key. Long-term opportunities often begin where fear dominates.
⚠️ Disclaimer:
This content is for educational purposes only and does not constitute financial advice. Always do your own research and consider your risk tolerance before making any investment decisions. You are solely responsible for any trading or investment actions taken based on this information.
btcwill be looking on long on BTC using 2 confluence.
1 is under nearest resistant that turn to support
or the
0.75 confluence
$BTC - Possible CME Gap FillBINANCE:BTCUSDT | 4h
Watching 106.2k-106k for a potential bounce taking those singleprints/imbalances.
However, if 108.3k rejects, CME gap below likely gets filled around 104k to 102k zone (pink squiggly)

When will #BTC hit a new high?📊When will #BTC hit a new high?
🧠From a structural point of view, we have come to the weekly resistance zone, so it is very reasonable to consolidate sideways here. Only if we successfully break through the resistance here and stabilize above the resistance zone, can we remain optimistic.
➡️The short-term support is around 108800. If we can hold here, then we have the opportunity to build an ascending triangle, which means that we will continue to hit new highs soon, otherwise we need to be alert to the occurrence of a pullback.
➡️106500-107000 is the conversion area of resistance and support, and it is also the psychological defense line of long transactions. If we can't hold here, then we need to be alert to the occurrence of in-depth adjustments.
⚠️Currently in a complex consolidation stage, we need more patience!☕️
🤜If you like my analysis, please like💖 and share💬 BITGET:BTCUSDT.P

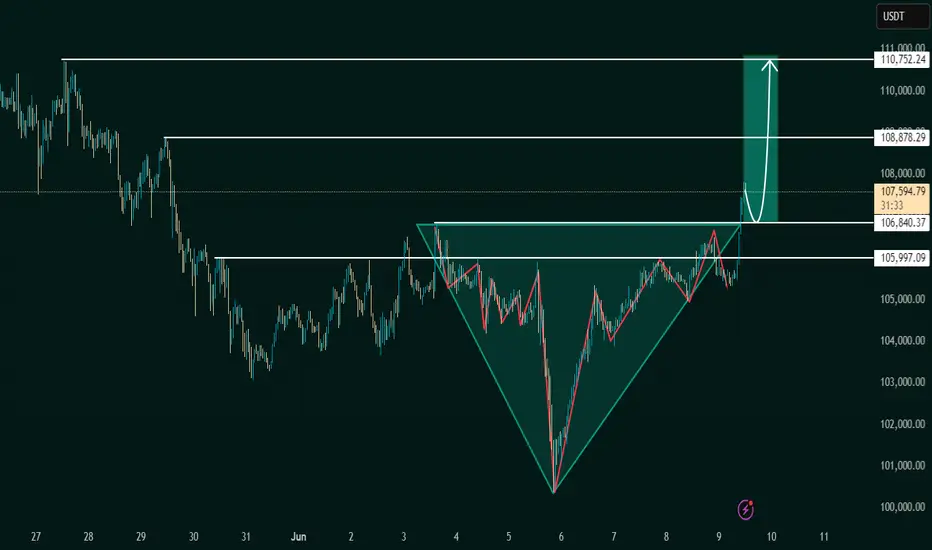
Inverse Head and Shoulders Breakout Signals BullishThe chart under review presents a classic Inverse Head and Shoulders pattern, a reliable and widely recognized bullish reversal formation in technical analysis. This structure typically forms after a downtrend, indicating a potential shift in market sentiment from bearish to bullish.
The pattern is composed of:
Left Shoulder: A modest price decline followed by a temporary upward correction.
Head: A deeper price decline forming the lowest point in the pattern.
Right Shoulder: A higher low that mirrors the left shoulder, followed by another upward movement.
The neckline, which acts as a critical resistance level, is clearly illustrated at approximately 106,840.37 USDT. A confirmed breakout above this neckline suggests the completion of the reversal pattern and validates the potential for a sustained bullish movement.
2. Breakout Confirmation
The current price action confirms a successful breakout above the neckline, with the market currently trading around 107,586.58 USDT. This breakout is a key signal for bullish continuation, provided it is supported by increased volume and follow-through price action.
From a technical standpoint, the breakout is reinforced by:
A clean violation of neckline resistance
Price consolidation near breakout zone before a strong upward thrust
Higher lows preceding the breakout, indicative of growing buying pressure
This confluence of technical signals strengthens the case for an upward price trajectory in the near term.
3. Projected Price Targets
Upon confirmation of the Inverse Head and Shoulders breakout, target levels can be derived using the measured move technique. This involves projecting the vertical distance from the head to the neckline upward from the breakout point.
Target 1 (Initial Resistance):
108,878.29 USDT – This level represents a potential short-term resistance where price may consolidate or retrace slightly before continuing.
Target 2 (Measured Move Completion):
110,752.24 USDT – This is the ultimate price target derived from the height of the head-to-neckline structure. Reaching this level would represent the full realization of the reversal pattern.
4. Key Support and Risk Levels
Risk management is a critical component of any trading strategy. The following support levels should be closely monitored:
106,840.37 USDT (Neckline Support):
Former resistance turned support. Holding above this level post-breakout is essential for sustaining bullish momentum.
105,997.09 USDT:
Acts as a secondary support level and potential stop-loss region for conservative traders.
If price fails to hold above the neckline and falls back below these levels, the breakout could be classified as a false breakout, warranting caution.
5. Strategic Implications for Traders
This setup provides a favorable risk-to-reward ratio for long entries, particularly for traders seeking to capitalize on momentum-based patterns. An optimal trading approach could involve:
Entry: Near the neckline breakout or on a minor retest of 106,840.37 USDT
Stop-Loss: Below 105,997.09 USDT or under the right shoulder to account for volatility
Take-Profit Zones: Partial profits near 108,878.29 USDT, with final target at 110,752.24 USDT
6. Final Remarks
This chart illustrates a textbook example of a bullish reversal pattern in play. While the technical outlook is favorable, traders should remain cautious of potential invalidation scenarios, especially in highly volatile or news-driven markets. Confirmation through volume analysis and supportive macro/fundamental conditions can further enhance confidence in the bullish thesis.
Overall, the current setup indicates a well-structured opportunity for upward price movement, with a clearly defined entry, risk, and reward framework.
Let me know if you'd like this tailored for a trading journal, client report, or automated strategy setup
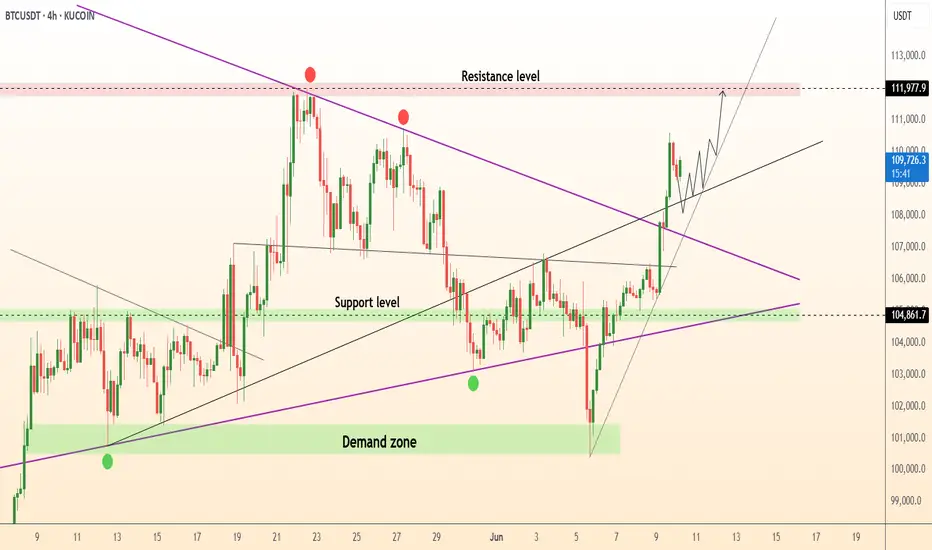
DeGRAM | BTCUSD fixed above the downtrend line📊 Technical Analysis
● Bulls pierced the descending purple trend-line and closed two candles above the 106 k pivot, confirming a pennant breakout and resetting higher-lows along the black mid-channel.
● Re-test of 104.8 k demand (green band) held as support; the new up-sloping flag projects to the 111.8 k-112 k red supply at the channel roof, with dynamic backup now rising to 103.8 k.
💡 Fundamental Analysis
● U.S. CPI whispers point to a softer June headline while spot-ETF cohort added another 3 200 BTC in two sessions and exchange reserves keep declining, underscoring supply squeeze amid easing rate fears.
✨ Summary
Long 104.8-106 k; sustained trade >107 k targets 111.8 k → 115 k. Bull thesis void on a 4 h close below 99 k.
-------------------
Share your opinion in the comments and support the idea with a like. Thanks for your support!
BTC to new ATH - 115K? When? OWing to the MP and TPO's
The current market profile indicates that Bitcoin has recently experienced a sharp move up, forming a double distribution structure with value areas clearly separated. Price attempted to hold above the upper distribution’s value area high but failed and is now back inside the lower distribution, suggesting rejection at higher prices. This opens up a potential short opportunity if price retests the 109650 to 110000 zone and shows weakness, with a possible target near 107300 to 107000 where the previous low-volume node and value area low are located. On the other hand, the area around 106600 to 106800 has acted as a strong support zone during the earlier rally. If the price moves down and shows signs of absorption or support near this zone, it may offer a favorable long opportunity back toward 108300 to 108500, where the previous value area high lies. The market is currently in a responsive phase, and directional bias should depend on how price reacts around these key zones.
What i see is what i learned, and i do expect a straight fall down but cant forget the small OB which can pull things up! Sideways momentum to NEW ATH

Lingrid | BTCUSDT support Bounce After Flag Pattern BreakoutBINANCE:BTCUSDT recently rebounded from the intersection of the upward channel and horizontal support near 103,705 after a false breakdown from the flag pattern. The price is now challenging the downward trendline from above, hinting at a potential breakout. A sustained move above this zone may open the path toward the 108,800 resistance.
📈 Key Levels
Buy zone: 103,500–104,000
Buy trigger: breakout and close above 105,600
Target: 108,800
Sell trigger: close below 103,000
💡 Risks
Rejection from the downward trendline could revive bearish pressure
Sideways consolidation under resistance weakens momentum
A break below the channel base may invalidate the bullish setup
Traders, if you liked this idea or if you have your own opinion about it, write in the comments. I will be glad 👩💻

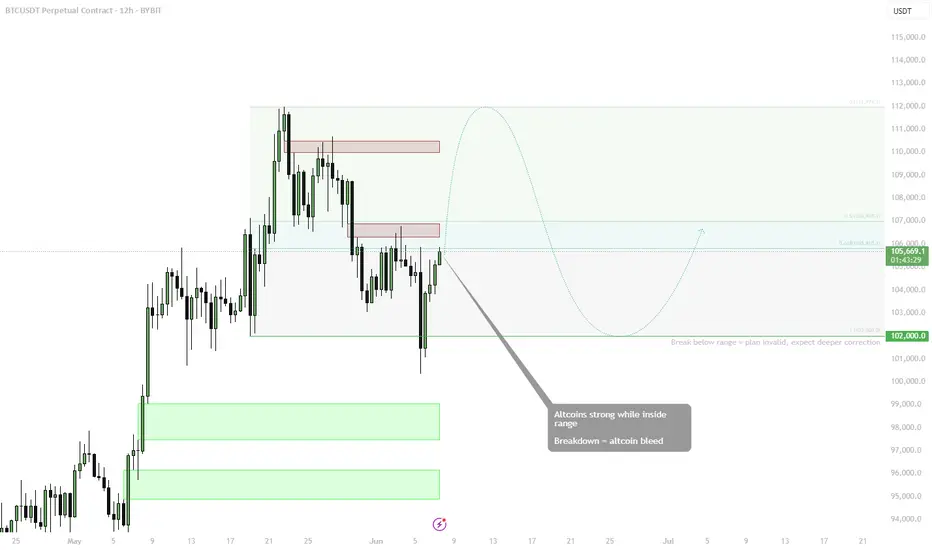
BTC — Altcoin Sentiment Hinges on BTC Holding BINANCE:BTCUSDT is consolidating within a well-defined range between ~$102K and ~$112K, with a bounce off the lower boundary now challenging midrange resistance. As long as BTC trades within the range, altcoins are expected to remain strong.
🟩 Midrange: $106K
• 0.618 fib and prior supply zone
• Key inflection for either a move higher or return to range low
🔻 Range Low Support: $102K
• Break below this = plan invalid
• Expect deeper BTC correction and altcoin bleed in that scenario
📈 Bias:
• Altcoins strong = only valid if BTC holds this structure
• Rotations likely while BTC moves sideways or grinds higher
• Upside target (range high): ~$111.9K
📌 BTC stability = altcoin opportunity. Breakdown from range? Get defensive fast.
BTC - setupWe’re currently trading near the all-time high.
If we get rejected from this region, I’ll look to scale up my position in the trend reversal zone between $103,700 and $105,500.
A breakout in the near future (June) is highly likely.
I’m positioned accordingly
LFG 🚀
BTC SHORTI hope it plays as we predict, Market sentiments are really volatile we might get squeezed.
The trade setup is on the chart..
DYOR
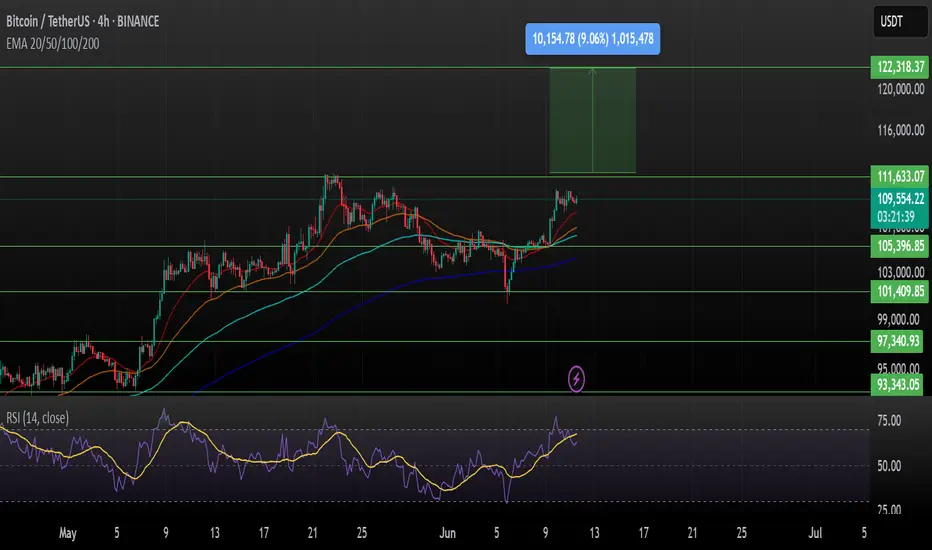
BTCUSDT – Bullish Continuation Setup (4H Chart)Bitcoin shows a strong bullish structure on the 4H timeframe after breaking and holding above key EMAs (20/50/100/200). Price is consolidating just above the breakout zone, suggesting potential continuation.
Support Levels:
$105,396
$101,409
$97,340
$93,343
Resistance Levels:
Immediate: $111,633
Major Target: $122,318 (+9.06% potential upside)
Indicators:
RSI: Holding at ~63.7, still below overbought — suggests room for momentum.
EMA Confluence: All major EMAs are aligned below price, acting as dynamic support.
If BTC holds above $109K, a move toward $122K looks likely. A clean breakout above $111.6K could ignite the next leg up.
Bullish bias intact
Target: $122,318
Risk Management: Watch for invalidation if price breaks below $105K.
This is not financial advice, please do your research before investing, as we are not responsible for any of your losses or profits.
Please like, share, and comment on this idea if you liked it.
#BTCUSDT #Bitcoin #Crypto #TradingView