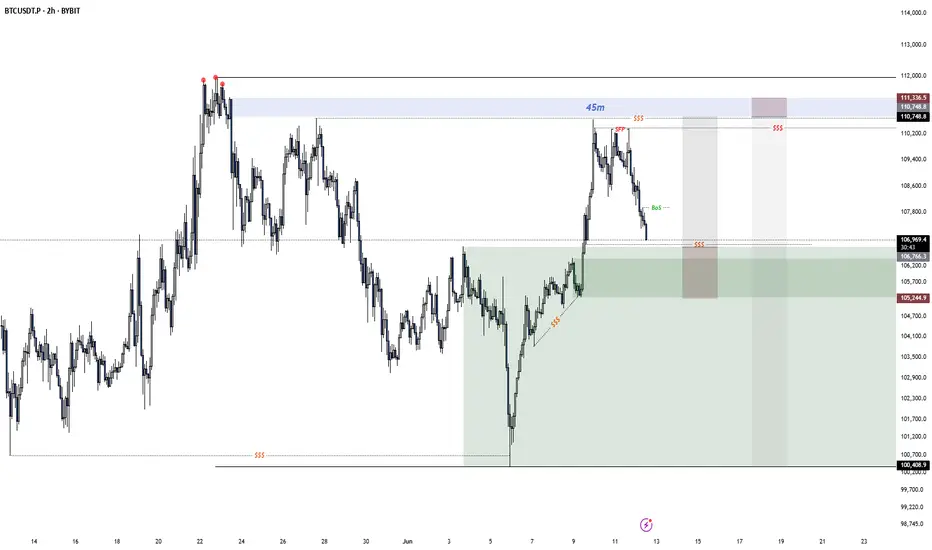
BTCUSDT: PYH Manipulation & Critical Target AheadWe're facing a potential manipulation at the Previous Yearly High (PYH) level. This is a trap for the unwary.
Here's the critical insight: Bitcoin's price is rising, but CDV (Cumulative Delta Volume) is falling. My volume footprint shows no serious buyers, despite the current price push. This means the underlying strength isn't real.
Your action plan is simple: if the volume footprint turns negative, our target is a precise $100,385.
I only focus on assets with sudden volume increases. Watch the CDV and PYH level closely. Most traders miss these details, but this is where you make the most informed decisions.
Act now: Keep your eyes locked on Bitcoin. Missing this insight could cost you dearly.
BTCUSDT.3S trade ideas

BTC 12.06.25After BTC avoided the last supply there is on the chart since monday, i would expect a reaction as soon it comes in there. There is also a big area of range demand below where i am looking for a bullish reaction. My main focus is at the range high since i still have this HTF distribution scenario in mind and we are right in the first deviation of it.
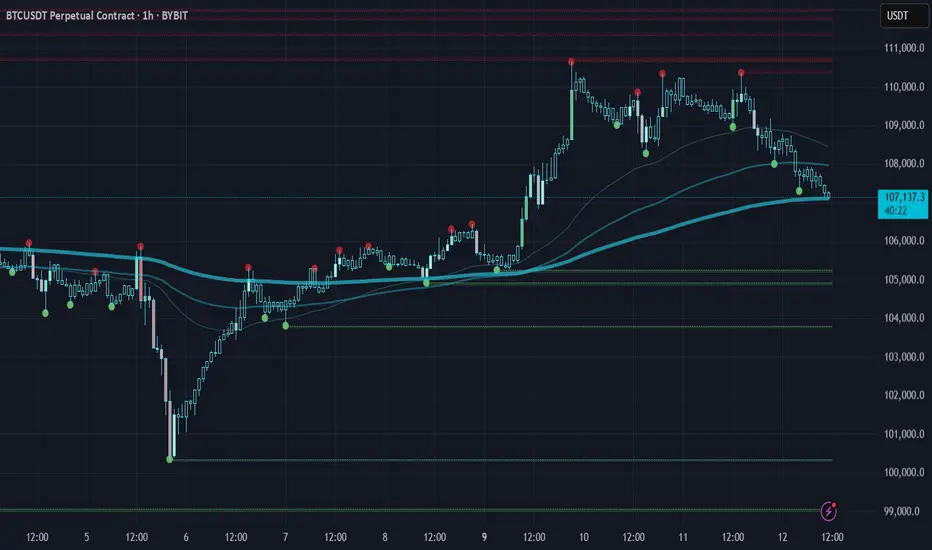
Bitcoin H1 BreakdownPrice swept 110K with weak volume → no follow-through → sharp rejection.
Now testing 200 EMA near 107K.
Lose it → 105.2K / 103.7K next.
Hold it → bounce to 110.6K likely.
Classic liquidity trap + momentum unwind.
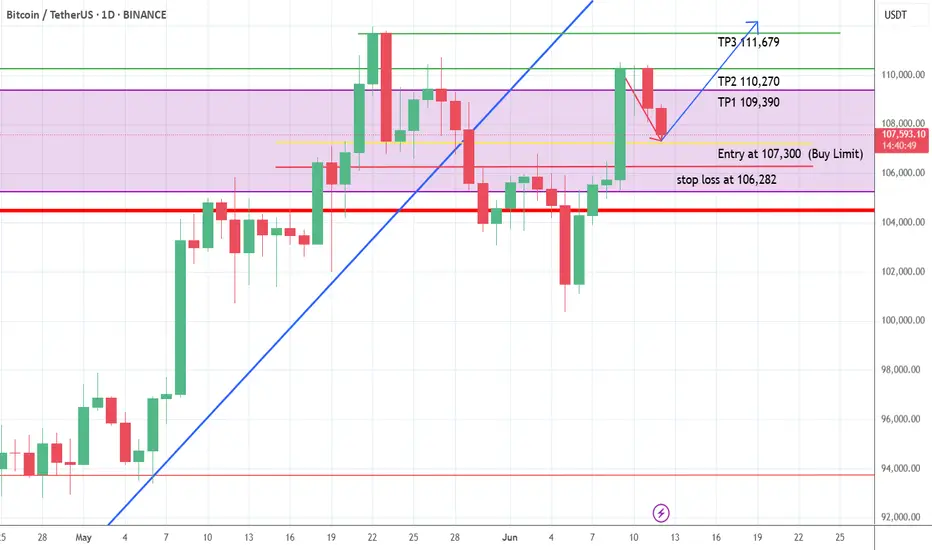
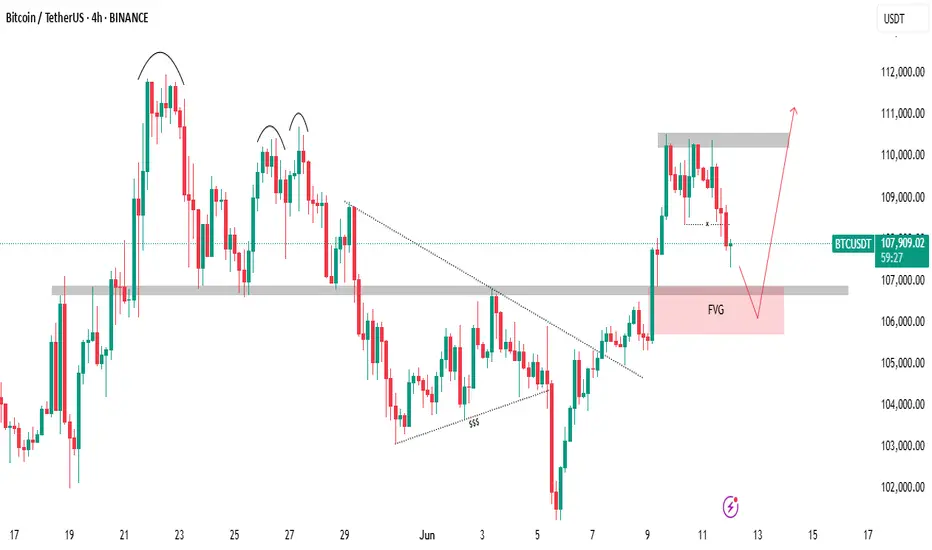
4H Timeframe BTCUSDT Bullish Rally Setup (Buy Limit Order)This analysis provides a deeper breakdown of the previous setup, now viewed on the 4-hour timeframe. It offers a closer look at price action using 4-hour candlesticks to refine entry points and confirm the buy limit strategy for the upcoming bullish rally.

The Next BTCUSDT Bullish Rally Setup (Buy Limit Order)BTCUSDT has been in a long-term bullish trend and continues to maintain its upward momentum. Currently, the price is undergoing a minor pullback as it retests a key resistance level. Once it reaches the previous minor support zone, I expect the bullish trend to resume.
To take advantage of the next bullish move early, consider placing a buy limit order at that earlier minor support level. For proper risk management, set a stop loss slightly below the support area.
Everything is clearly illustrated on the chart provided.
BTC USDT LONG TRADE SETUPBTC/USDT is currently holding at a strong support zone, with a high probability of an upward price move. Also 100 EMA is acting as support.

Last week Bitcoin created massive liquidity at a key resistance!🚨 Bitcoin Update – A Bullish Storm Is Brewing? 💥
Last week, Bitcoin created massive liquidity at a key resistance zone, and guess what? That liquidity is still untouched. The market hasn’t fully tapped into it yet — and that’s a big deal.
Recently, BTC smashed through resistance and even left behind a Bullish Fair Value Gap (FVG), signaling strength. But hold on—after this breakout, the market is showing signs of a minor pullback, likely to retest its marked IRL (Important Reaction Level).
📉 It’s cooling off temporarily... but don’t blink. This zone could act as a springboard for the next big leg up.
💡 Here’s the kicker: there’s still a ton of liquidity waiting above. If the market wants it—and it usually does—there’s a high probability (80%+) of another bullish push.
👀 Watch this area closely. It’s a make-or-break zone.
📊 Do Your Own Research (DYOR) – this is not financial advice, just a friendly nudge from the charts.
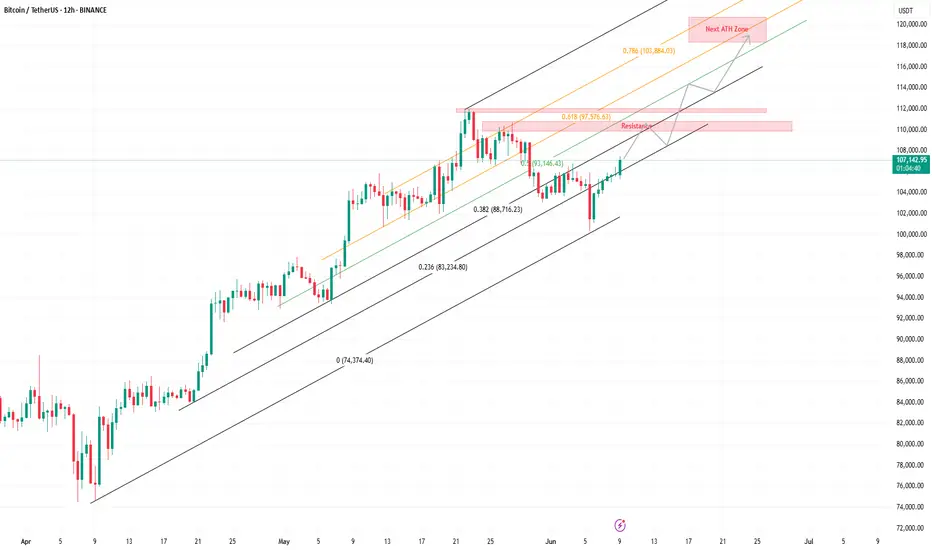
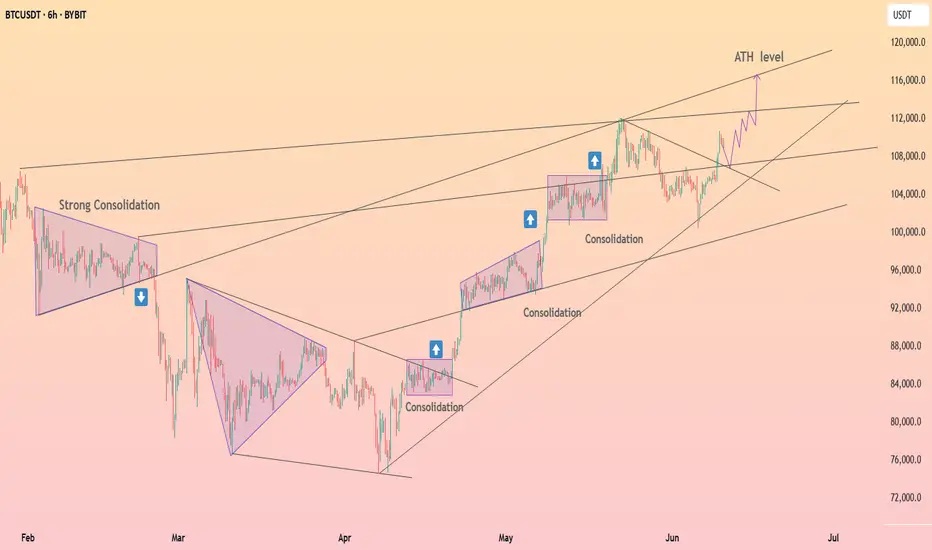
BTC could form a new ATH between 118K-120KBTC will be resisted between 110 K- 111 K, but will continue to rally to form a new ATH between 118 K- 120 K.
There could be another possibility that BTC will sharply move to the 0.618-0.786 Fib channel, and then continue within that channel to make a new ATH.
Let's see.
Is the #BTC rally over?📊 Is the #BTC rally over?
🧠From a structural perspective, we have reached the ideal target zone of the double top bearish structure, so a strong rebound is very reasonable. The realization of the ideal target zone means that the previous decline has ended. We need to change our thinking and stop being too bearish. Stay cautious!
➡️At the same time, the goals of the long structure we built in the support area have also been fully achieved, and this period of rise has reached the lower edge of the extended wedge + the downward trend line + the blue resistance area very quickly, so there is a possibility of a pullback, so don’t chase the rise here. If you want to participate in long transactions, we should pay attention to the opportunities after the pullback.
Let’s see👀
🤜If you like my analysis, please like💖 and share💬
BITGET:BTCUSDT.P

a scalp long opportunitya scalp long opportunity- btc forming a downle bottom a small scalp opptunity to 109500 and if possible 110000. lets see
Market Overview
WHAT HAPPENED?
Last week, after fluctuating in a sideways range, bitcoin began to decline. Only $300 wasn’t enough to reach the level of $100,000 — there was a strong absorption of market sales, and a rebound occurred.
WHAT WILL HAPPEN: OR NOT?
We tested the $104,500–$105,800 zone (accumulated volumes). There is no abnormal activity or strong sales within it, which increases the likelihood of continued upward movement to the next sell zone. After that, the current volumes may go long, forming a new support zone in the range of $105,800–$104,500.
This week, we can consider a long retest of the support of $104,500–$105,800 with confirmation of the buyers' reaction. However, low volumes in the upward wave keep the risk of a sharp resumption of sales. In this case, the key entry level will shift to the psychological mark of $ 100,000.
Supply Zone:
$107,000–$109,800 (accumulated volumes)
Demand Zones:
$101,600–$100,000 (previous push-volume zone + current buyer defense)
$98,000–$97,200 (local support)
$93,000 level
$91,500–$90,000 (strong buy-side imbalance)
IMPORTANT DATES
Macroeconomic developments this week:
• Wednesday, June 11, 12:30 (UTC) — publication of the basic US consumer price index for May, as well as in comparison with May 2024;
• Thursday, June 12, 06:00 (UTC) — UK GDP for April is published;
• Thursday, June 12, 12:30 (UTC) — publication of the number of initial applications for unemployment benefits and the US producer price index for May;
• Friday, June 13, 06:00 (UTC) — German consumer price index for May is published.
*This post is not a financial recommendation. Make decisions based on your own experience.
#analytics

GME COLLAPSE - NET SELLOFF - MARKET ANALYSISGameStop (GME) is dropping in after-hours trading following its $1.3 billion convertible senior notes offering, which investors see as potential dilution. Similarly, Cloudflare (NET) is also falling due to concerns over its $1.75 billion convertible debt offering, which could impact shareholder value.
On the flip side, Oracle (ORCL) surged after reporting strong Q4 earnings, with cloud infrastructure revenue expected to grow over 70% in fiscal 2026. This could provide a tailwind for the broader cloud sector.
The market’s pullback today was much needed, with many stocks retesting key breakout zones

Bitcoin at the Crossroads: Will BTC Breakout or Retest SupportBitcoin (BTC) – Testing Resistance, Ready for Reversal or Breakout
Technical Outlook — June 11, 2025
Current Market Condition:
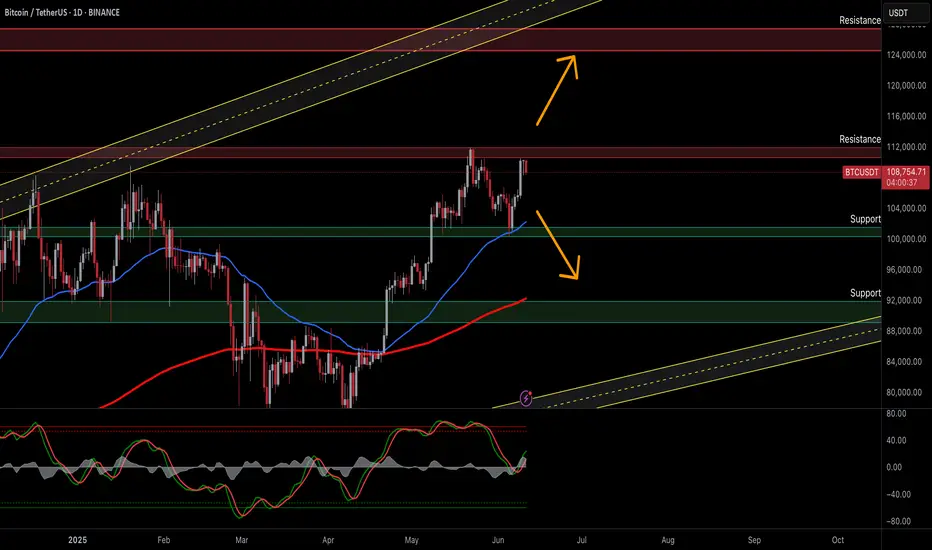
Bitcoin (BTC/USDT) is currently trading around $108,644 following a modest decline of -1.48% on the daily chart. After a bullish recovery from the $92,000–$96,000 zone, BTC has approached a strong resistance band near $112,000. The current structure suggests the market is in a critical phase — either poised to break higher or risk a deeper retracement toward key demand levels.
Key Technical Highlights:
Price is trading above the 50 EMA (blue) and the 200 MA (red), suggesting a bullish short- to medium-term bias.
The $112,000 zone is acting as a strong resistance, where BTC has previously faced rejections.
The ascending yellow parallel channel outlines the broader uptrend structure — BTC remains well within bounds, showing potential for continuation.
The Stochastic Oscillator is climbing, indicating building bullish momentum but nearing overbought territory, which could trigger short-term pullbacks.
Immediate supports are found near $104,000 and $96,000. A failure to hold above $104,000 could trigger downside pressure.
Trade Plan:
✅ 1. Bullish Breakout (Long) – Most Probable Scenario
Trigger: Daily close above $112,000 with strong volume and momentum
Target: $122,000 - $125,000
Stop Loss: Below $109,000
⚠️ 2. Bearish Rejection (Short) – Possible Scenario
Trigger: Bearish reversal candle at $112,000 or daily close below $106,000
Target: $102,000, then $92,000
Stop Loss: Above $111,000
📉 3. Dip Buy Setup – Last Scenario
Trigger: Price retests and holds $96,000 or $92,000 with a bullish reversal signal (e.g., pin bar, hammer)
Target: Immediate resistance at $104,000, then $112,000
Stop Loss: Below $91,000
Risk Management:
Always apply proper risk management, including clear stop-loss placement and responsible position sizing. Bitcoin can react aggressively to macroeconomic events and regulatory news — monitor sentiment closely when near major technical levels.
📢 If you found this analysis valuable, kindly consider boosting and following for more updates.
⚠️ Disclaimer: This content is intended for educational purposes only and does not constitute financial advice.
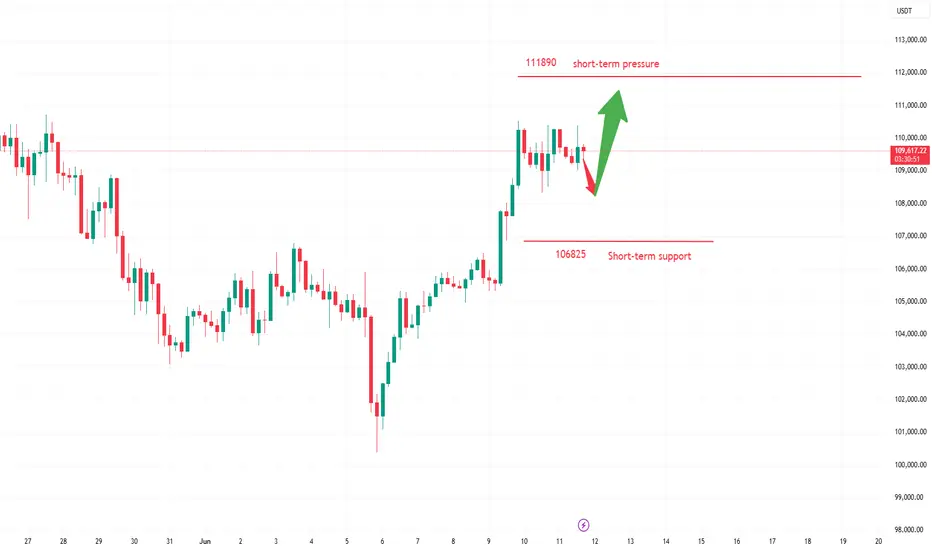
"Accumulation Phase for Breakout"Bitcoin underwent high-level consolidation on June 11, with intraday volatility ranging from $108,800 to $110,200. It failed to effectively break through the previous high of $111,980. The 24-hour global liquidations amounted to $210 million (half of the previous day), with short positions accounting for 62%, indicating that bears still dominate short-term sentiment.
The Sino-US high-level talks in London originally scheduled for June 11 have been postponed to June 15, and the details of tariff reductions remain unclear, leading to a decline in risk asset appetite. The US Dollar Index rebounded by 0.8%, suppressing Bitcoin's breakthrough momentum. Bitcoin is currently in a accumulation phase for breaking through all-time highs, with policy regularization and institutional increasing holdings forming long-term support.
Humans need to breathe, and perfect trading is like breathing—maintaining flexibility without needing to trade every market swing. The secret to profitable trading lies in implementing simple rules: repeating simple tasks consistently and enforcing them strictly over the long term.
Trading Strategy:
buy@108000-108500
TP:110500-111000
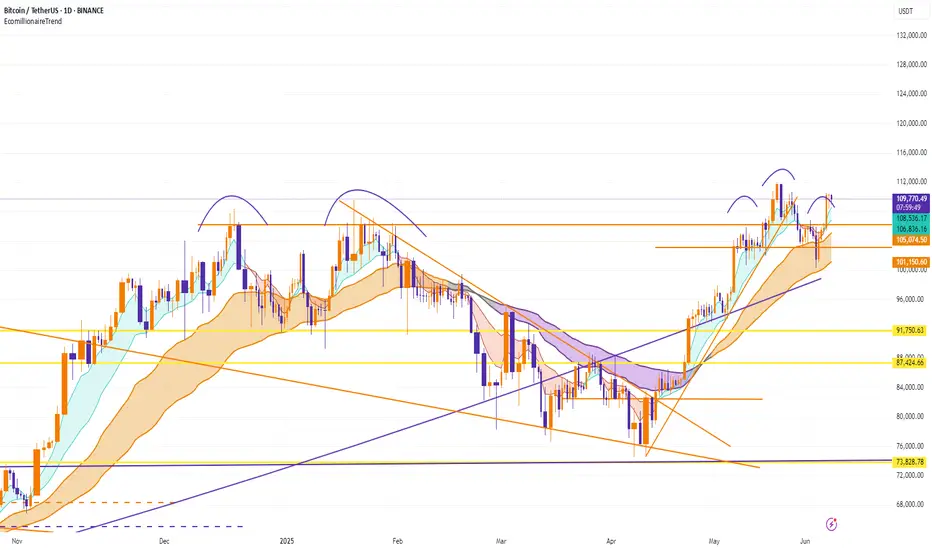
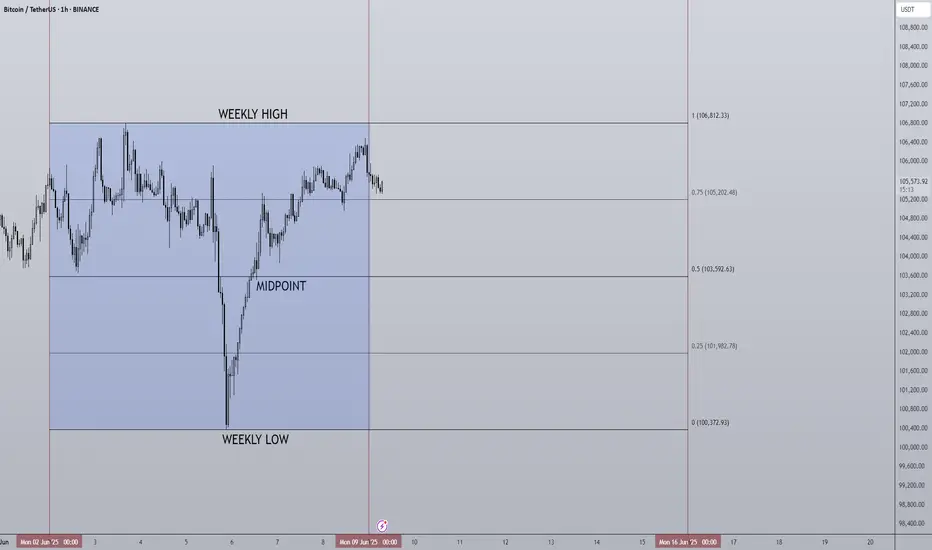
09/06/25 Weekly OutlookLast weeks high: $106,812.33
Last weeks low: $100,372.93
Midpoint: $103,592.63
Billionaire spats and V-shaped recoveries, the beginning of June starts off in an interesting way. As President Trump goes forward with "The big beautiful bill" Elon Musk lets his feelings be known publicly sending shockwaves throughout markets, but what does this mean for Bitcoin?
The bill could add $3-5T in US government spending which is great for risk-on assets as there is more money able to flow into markets. I believe this exact thought process is visible on the chart in the V-shaped recovery we can see on Thursday. A clear sell-off as Elon Musk's anti government spending views clash with the bill, the uncertainty causes a sell the news moment, just as BTC comes into $100,000 the dip is bought up on the realization this means greater inflows are on the way, dips are truly for buying at this stage in the cycle and to me, this proves it.
In a more bearish view of the chart I would say the clear resistance is now weekly high at ~$106,000. Anything above that meets huge selling pressure with price discovery on the other side the market just doesn't seem to have the fuel as of yet to make the next step. However I believe it is just a matter of time and as M2 global money supply grows we get closer and closer to seeing new significant highs.
For this week CPI & PPI take place on Wednesday and Friday respectively. With CPI set to grow from 2.3% to 2.5% according to forecasts it will be interesting to see how markets react, expect short term volatility. Key battlegrounds for me are weekly high and midpoint.
Good luck this week everybody!
BTCUSDT – Strategy and Trend Probabilities for 2025In my opinion, Bitcoin (BTC) has become less interesting — there isn’t much room left for significant movement, and most of the “cream” has already been skimmed off. However, since it's essentially the index of the crypto market, I’m sharing this trading idea for context - to show where we currently are and what scenarios might unfold.
The price is globally moving within an ascending channel.
A secondary triangle pattern is forming.
Within this triangle, we can see the outlines of an inverse head and shoulders pattern - or possibly a cup and handle - both aligning with the channel’s resistance.
Potential scenarios:
a) Price breaks out of the triangle.
b) Price moves toward the triangle’s support, forming another wave inside it.
c) Price moves to retest the main ascending channel’s support.
d) Price fluctuates within the central range of the channel.
There aren't many options, and none of them would break the primary trend. Altcoin movements will largely depend on BTC’s behavior.
Therefore, it’s crucial to build a trading strategy that considers both the likely and less likely (but possible) outcomes.
Looking at the broader picture:
The previous minor altseason (winter 2024) was short and weak, except for a few coins.
There was no real secondary altseason in spring 2025.
Statistically, summer tends to be quiet - due to holidays and so on.
The first two points contradicted the expectations of most traders - so we’ll see how things play out with the third. If there's no altseason in summer either, then logically, winter might turn out to be quite aggressive.

BTCUSDT | Neutral to Bearish Bias | Range Top | (June 8, 2025)BTCUSDT | Neutral to Bearish Bias | Range Top + Money Flow Out | (June 8, 2025)
1️⃣ Insight Summary:
Bitcoin is currently ranging near the top of a multi-day structure, but money flow has been consistently negative on the daily — hinting at hidden weakness. I'm now preparing for a potential move lower despite recent bullish sentiment.
2️⃣ Trade Parameters (Risk Management Focus):
Bias: Neutral to short-term bearish
Key Level to Watch: ~$94,000 (potential support target)
Risk Strategy:
— Reducing altcoin exposure by 50%
— Moving stop losses to entry across open positions
— Hedging if downside momentum increases
(This is not financial advice — just a view on how I’m managing risk.)
3️⃣ Key Notes:
❌ Money Flow Weakness: Daily outflows have been persistent across the entire consolidation — a warning sign even if price holds range highs.
📊 4H Structure: Still within a clean range. Currently at the top, which historically has triggered rejections.
🔥 Exchange Behavior: We're seeing flows back into exchanges, not out — which could suggest increased sell pressure or rotation rather than long-term accumulation.
🧠 Sentiment Caution: While many are still targeting higher levels (like $100K+), this current range and flow data suggests a pause or pullback before continuation — if it happens.
4️⃣ Follow-Up:
Will stay cautious and flexible. If BTC breaks above the range cleanly with strong volume and inflow data flips, I’ll re-evaluate bias. Until then, managing exposure tightly.
Please LIKE 👍, FOLLOW ✅, SHARE 🙌 and COMMENT ✍ if you enjoy this idea! Also share your ideas and charts in the comments section below! This is best way to keep it relevant, support us, keep the content here free and allow the idea to reach as many people as possible.
Disclaimer: This is not financial advice. Always conduct your own research. This content may include enhancements made using AI.

HolderStat┆BTCUSD preparing to test 110kYesterday's rise in CRYPTOCAP:BTC puts the immediate target at testing 110,000 and 112,000 and after that opening a new ATH. Local resistance has been broken.
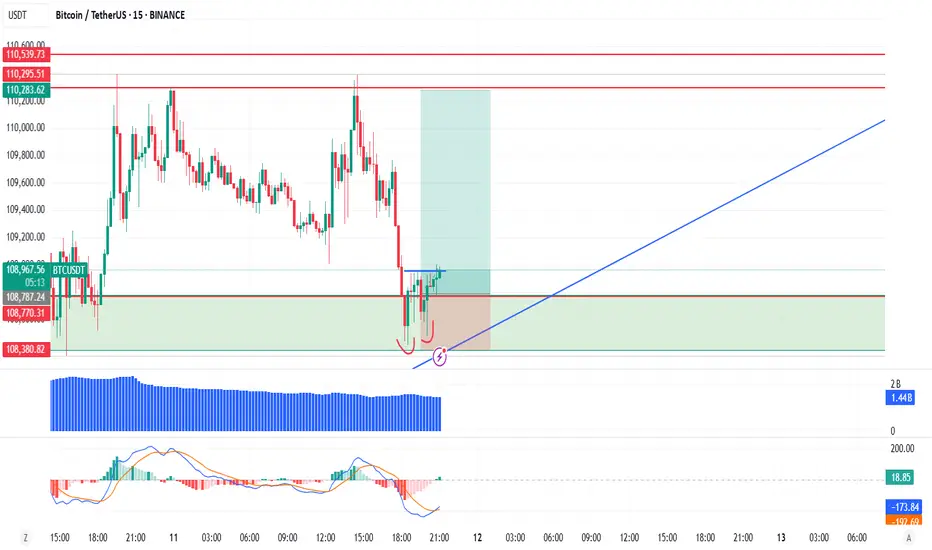
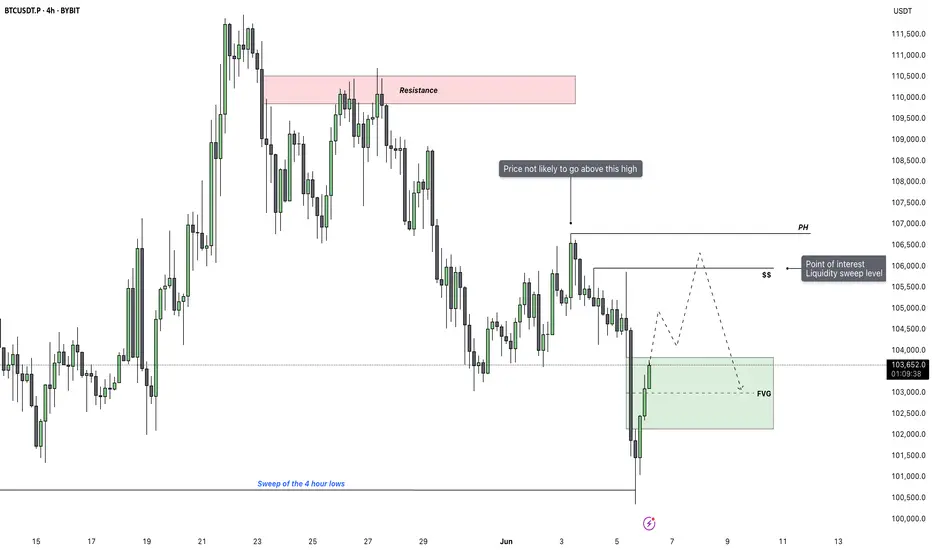
Bitcoin - Reclaim or Reject? Key 4H FVG Levels in FocusAfter an extended move lower, Bitcoin has just swept the major 4H lows and immediately bounced back with strength. This aggressive reaction suggests the sweep was likely a liquidity grab rather than a continuation. Price is now trading back inside a large 4H fair value gap, which could serve as a short-term magnet while market participants reassess direction.
Key Price Reaction and Fair Value Gap Context
The current rebound into the 4H FVG is notable. This zone holds significance because it's the last inefficiency left unfilled before the final leg down. If buyers manage to push through and close above this imbalance, it would indicate a short-term reclaim and open the door to a bullish liquidity sweep higher. The clean highs just above are marked by the $$ label, which align with a key inducement zone and should attract price if bullish momentum sustains.
Upside Scenario – Targeting the Liquidity Sweep
If we do see a clean move and close above the fair value gap, I’ll be looking for price to extend toward the highs just above it. These highs are likely to be the next target for liquidity collection, especially if short-term traders begin chasing strength. However, I’m not expecting price to trade beyond that zone. There’s a protected high resting above, and unless a significant fundamental shift occurs, it’s unlikely we break that structure.
Downside Risk – Failure to Hold Could Lead to 99K
If the market fails to close above the FVG or quickly gets rejected on a wick into it, the bullish scenario becomes invalid. That would confirm the move back up was simply a retracement after the sweep, setting the stage for further downside continuation. In that case, I expect the market to break lower and move toward 99K, which remains my downside target under bearish conditions.
Conclusion
Bitcoin just swept key 4H lows and is now testing a large imbalance. A close above could trigger a run on the $$ liquidity, but I do not expect price to move beyond that due to the presence of protected highs. On the other hand, failure to break and hold above the FVG opens the door for a deeper flush toward 99K.
___________________________________
Thanks for your support!
If you found this idea helpful or learned something new, drop a like 👍 and leave a comment, I’d love to hear your thoughts! 🚀
BTCUSD – Strong Bullish Signals on Daily ChartBTCUSD – Strong Bullish Signals on Daily Chart
Bitcoin is building strong bullish momentum after holding key support near $100,000 and breaking above the critical resistance zone at $105,000–$106,000. This move confirms renewed buying interest and opens the door for further upside.
The daily MACD is on the verge of a bullish crossover, signaling strengthening upward momentum.
The RSI has climbed above 55, moving out of neutral territory and showing buyer dominance.
Price action is approaching the upper boundary of a rising channel, with resistance near $110,000 to watch closely.
Volume has increased on recent up days, supporting the breakout strength.
Key Levels:
Support: $106,000 and $100,000
Resistance: $110,000 and $112,500
A daily close above $107,500 with volume confirmation would solidify the bullish case and could target a move toward $112,500.
What to expect after breaking $112,500:
Breaking and holding above $112,500 would open the path toward the next major resistance near $118,000–$120,000.
This breakout could trigger a strong rally fueled by momentum traders and institutional buying.
Watch for increased volatility as Bitcoin approaches all-time highs, with potential pullbacks serving as entry opportunities.
Sustained volume above breakout levels will be critical to confirm strength beyond $112,500.
If Bitcoin fails to hold above $112,500, it may retest support near $106,000–$108,000 for consolidation.
Short-term outlook: Expect consolidation between $106,000 and $110,000 before the next leg higher. Keep an eye on volume and momentum indicators for confirmation.

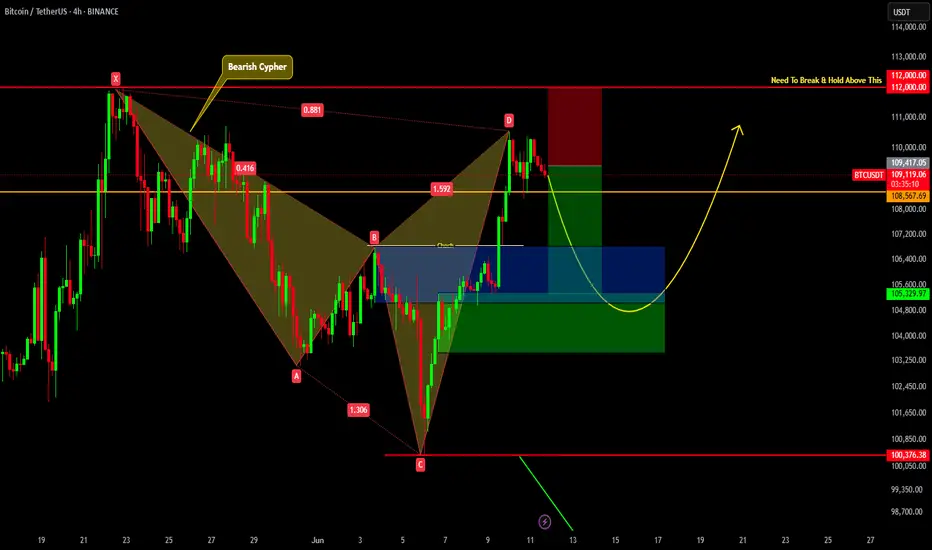
BITCOIN SHORT TERM UPDATE!!! Recently we have seen a great price move from 100K to 110K. We got clear Change Of Character , which indicates a sign of strength. Also we got bearish cypher harmonic pattern formed. So now we can expect a slight pullback up to 106-103k region from there we may see price reversing. But price should hold 100.3K region to remain bullish in short term.
Just Need to take normal correctionBitcoin double top formation is going to mini rug again in altcoin, 106k is pretty enougt
