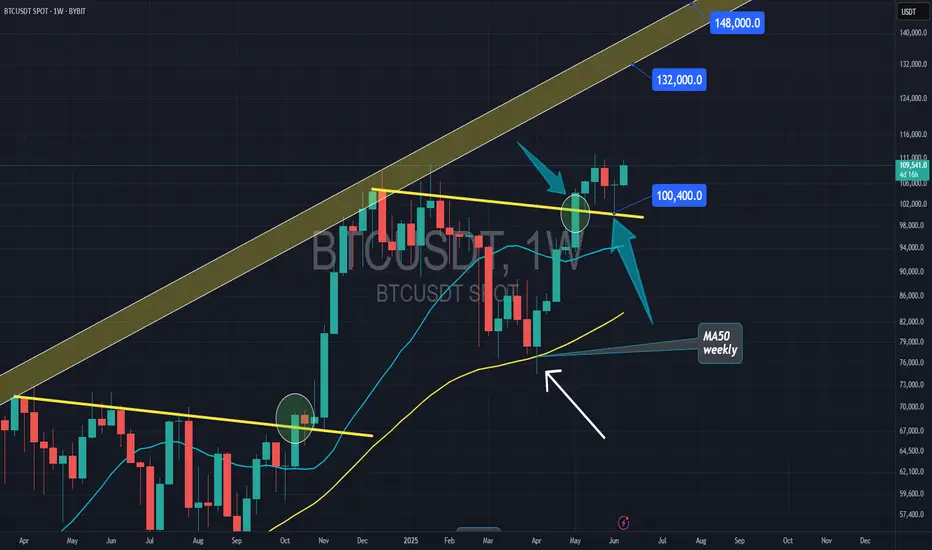
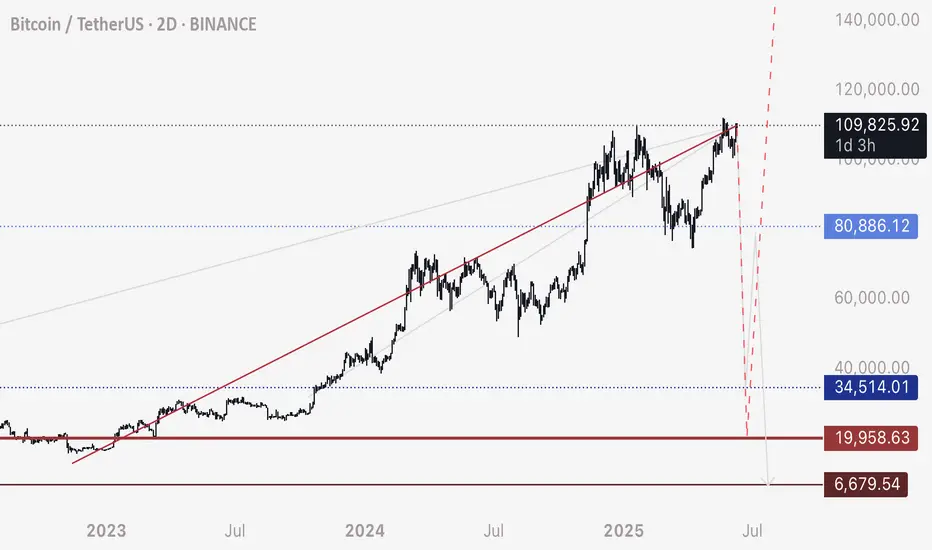
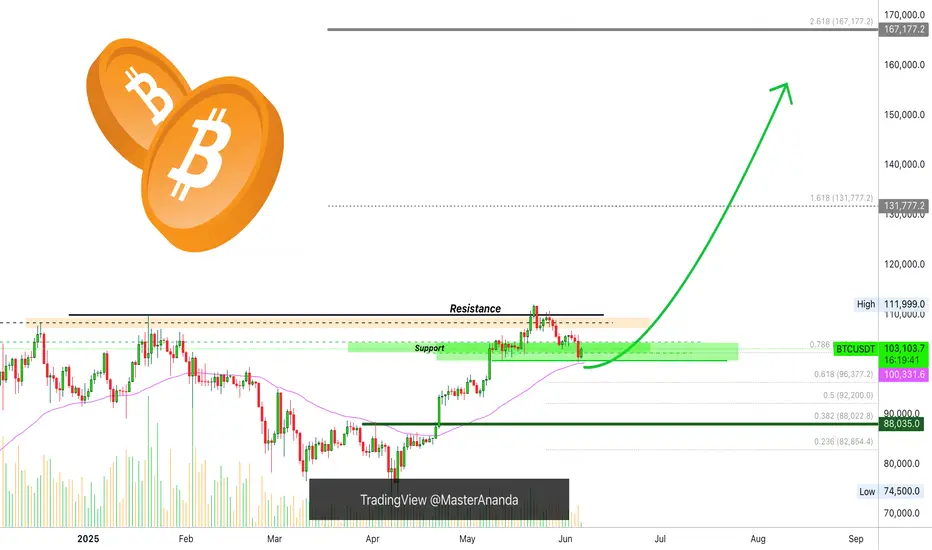
Bitcoin to $130,000Bitcoin broke out of the important yellow trendline and back tested that ( @$100k ) now its rising again. the main target now is $130,000 trendline
BTCUSDT.3S trade ideas
#BTC/USDT#BTC
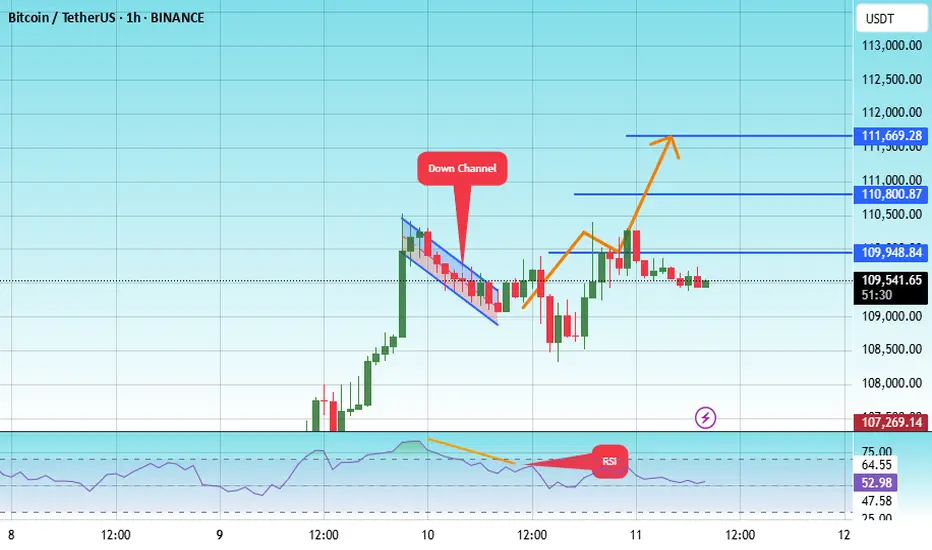
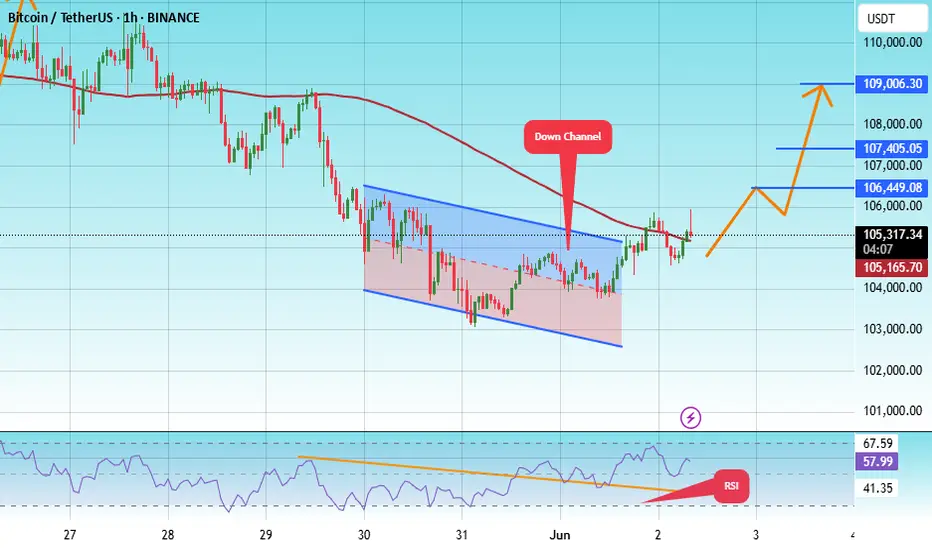
The price is moving within a descending channel on the 1-hour frame, adhering well to it, and is heading for a strong breakout and retest.
We are experiencing a rebound from the lower boundary of the descending channel. This support is at 108883.
We have a downtrend on the RSI indicator that is about to be broken and retested, supporting the upward trend.
We are looking for stability above the 100 Moving Average.
Entry price: 109380
First target: 109948
Second target: 110800
Third target: 111670
$btc/usdt short swing sh set upth:
sh htf liq + htf sh fib (1.136/1.272) + anti cypher harmonic pattern

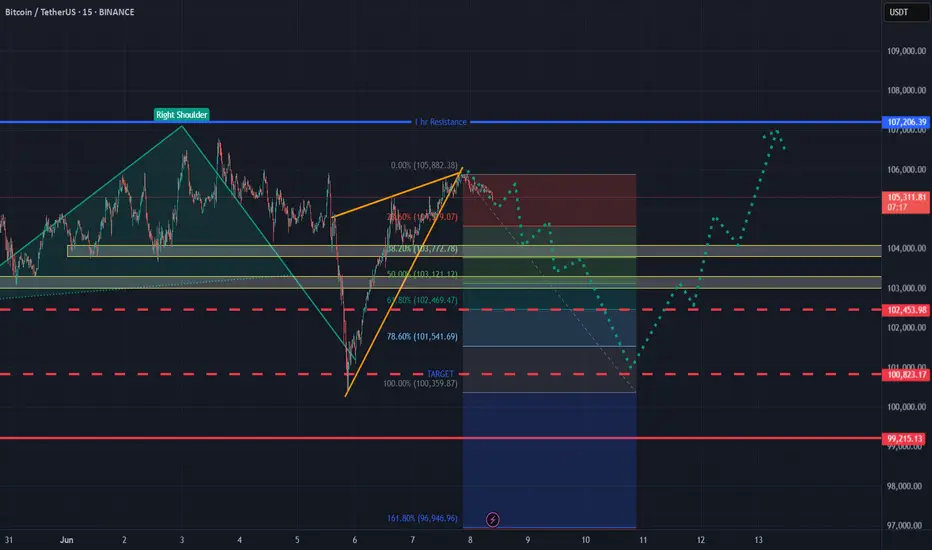
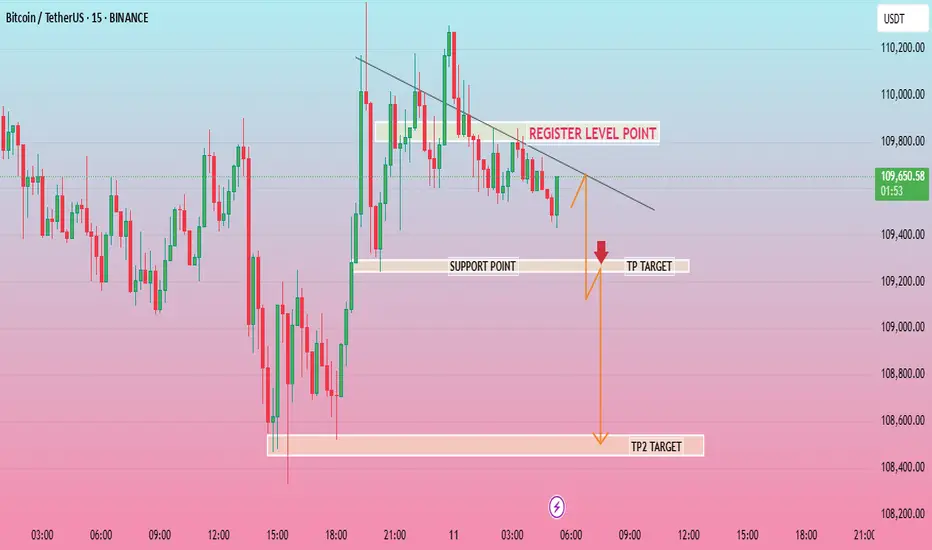
BTCUSD 15MThe chart you've shared is a 15-minute candlestick chart of Bitcoin/USDT (BTC/USDT) on Binance, with a short-term bearish outlook. Here's a breakdown of the analysis shown in the image:
---
🔍 Key Levels Identified:
Register Level Point (Resistance): Around 109,750 USDT
This is where price previously failed to break higher—acting as a local resistance.
Support Point: Around 109,350 USDT
This is the level where price has bounced before, now being tested again.
---
🎯 Trade Setup:
Entry Trigger: The price is approaching the support zone again. A break below the support could confirm the bearish move.
TP Target (Take Profit 1): ~109,250 USDT
A moderate take-profit level just below the support level.
TP2 Target (Take Profit 2): ~108,300 USDT
A deeper target, suggesting a stronger continuation of the downtrend if the support breaks convincingly.
---
🔻 **Bearish Bias Justification
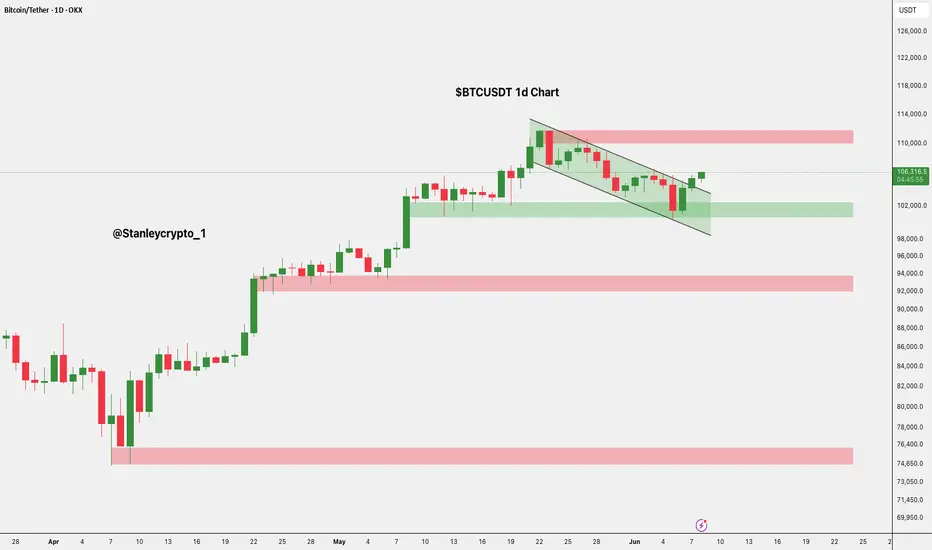
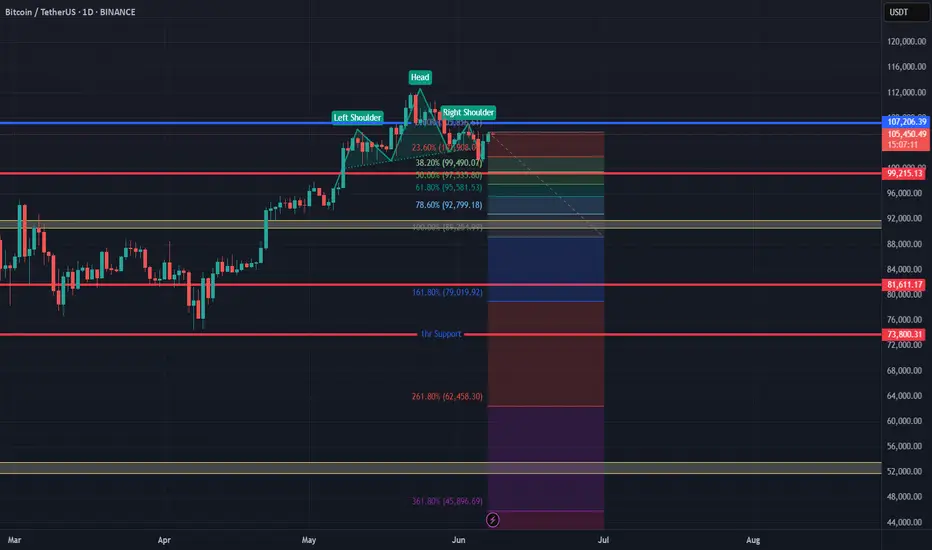
BTC/USDT 1DAY CHART UPDATE !!Bitcoin displays a classic “cup and handle” structure on the daily timeframe – a historically bullish continuation pattern. The price has successfully broken above the neckline (~$107,000), indicating that bullish momentum is underway.
Thanks for your support!
DYOR. NFA

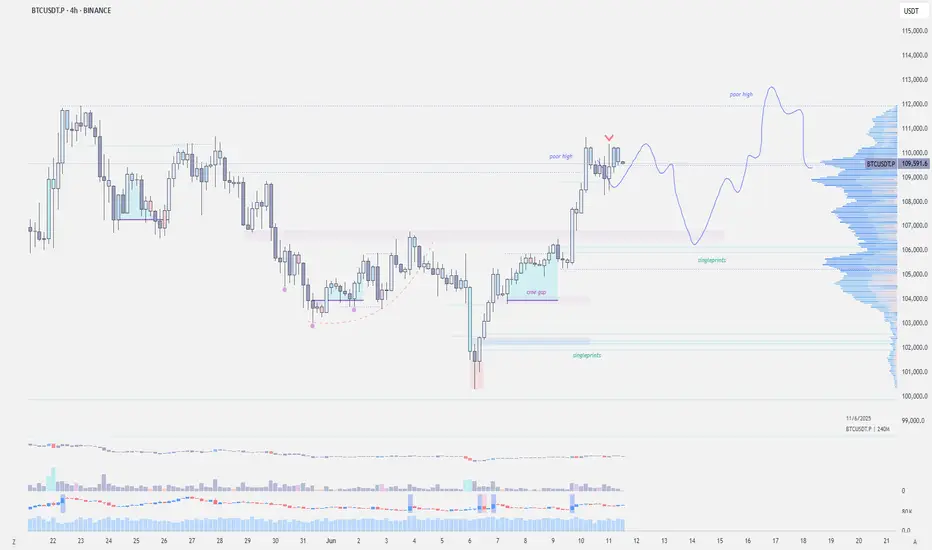
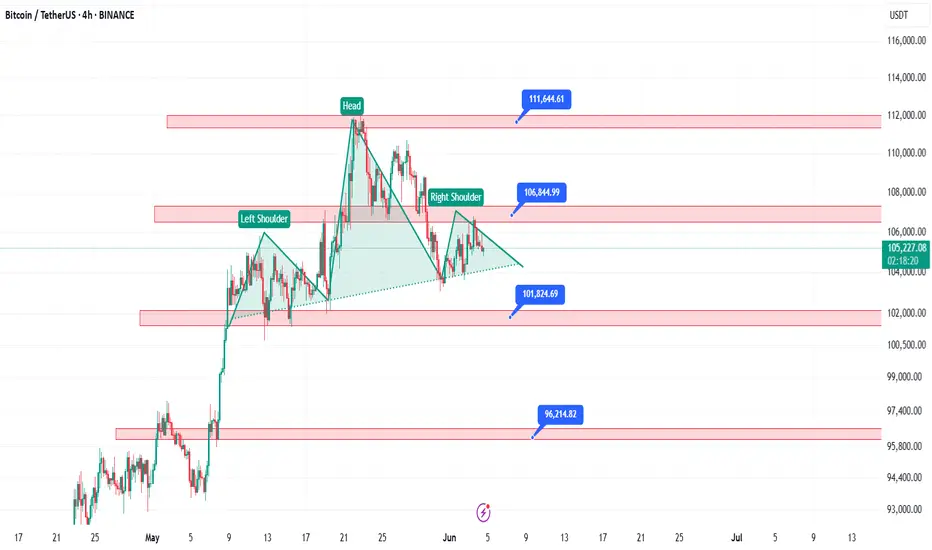
$BTC - Poor HighsBitcoin cleared the previous highs resting at 110k; however, it is still facing resistance at 110.3k.
We need to break above 110k to clear the significant highs at 112k.
Otherwise, I still expect a retest of 106k–107k before any further upward movement.
BTC - Short Play - Market Structure UpdateMarket Structure Update:
As we continue forming the right side of the current market structure, several key levels emerge as critical points of control. It's important to highlight that the current formation is mirroring the left side of the structure, and we are now approaching the midpoint of the cycle.
Based on this mirroring cycle, we anticipate downward movement today and tomorrow as the structure progresses toward completion.
---
🔻 Short Entry Zones
A close or wick below the following levels would confirm potential short entries:
109.6k – Left-side structure wick
109.3k – Structural support
108.2k – Key breakdown level
---
🎯 Short Targets
If confirmed, potential downside targets include:
108.3k
105.3k
104.6k
103.2k
102k
101.4k
100.3k
---
🔺 Important Levels to Monitor (If Uptrend Momentum Builds)
In the event of a bullish breakout, keep an eye on:
110.7k – All-Time High wick, right side of structure
111.9k – Wick just below ATH (May 25th), key structural zone
Stay alert. "As Above, So Below."
— ZemoG Trading Group

BTC - Be mindful of resistance around 109,800 to 110,000Per my second last post about this red trendline - be mindful that there is a resistance located 109,800 to 110,000 zone.
Although Bitcoin can break above, that doesn’t mean the resistance is invalid. Price will weave above and below until it sticks and plays out.
Personally I watch these levels for sudden fast movement and confirmation that it’s holding as resistance.
If you see a fast drop initiate from these levels, be mindful that this could be indicative of intention to hit the lows around 20,000.
For more information see my previous posts.
Happy trading
Bitcoin, Fast & Easy. $100,000 Support Holds +AltcoinsThe main support is not $100,000 but $102,000, so we make this a range. Yesterday, for the first time this range was tested and it holds easily... We are strongly bullish above $102,000 and Bitcoin is already trading above 103K.
This is really good news but we are not fully in the green yet. Bitcoin can continue sideways, consolidation, and only after closing above $106,000 we are looking for higher prices. Once $110,000 gets conquered, we can start talking about new all-time highs and sustained bullish growth. Meanwhile, the altcoins grow.
So we are not there yet but this is the best ever. For Cryptocurrency to thrive we need a strong Bitcoin and Bitcoin right now is very strong. Are you trading any altcoin? If you are, feel free to accumulate, load-up, buy and hold.
As for Bitcoin, here is a very easy trading approach:
While above $100,000, ALL-IN bullish confirmed.
If it goes below $100,000, stay out and wait to see what the market does. As soon as there is a support level created, we go LONG. If it goes below $100,000 just to recover the next day, we are again ALL-IN as soon as Bitcoin starts trading above 100K.
This process can be repeated many times but once Bitcoin takes off, buying below $110,000 is a major win because soon Bitcoin will be trading above $150,000. We have targets around $180,000 and even beyond $200,000 is possible this same year. Never forget the bigger picture.
The bigger picture is bullish for Bitcoin and the altcoins, the short-term can create confusion because the chart, market conditions, can change within hours.
But there can be a drop, a retrace or a market flush, but knowing that Bitcoin will be trading above $150,000 soon turns such an event into a non-event, it makes it into a simple hold.
The action on the side of the altcoins confirms that Bitcoin will continue to grow. Short, mid and long-term.
There is no retrace, there is no correction, only a small consolidation phase in anticipation of the next bullish wave. You already know this. If you didn't, now you know.
In 2025, Bitcoin will continue to grow. Just as it grew in 2023 and 2024.
We are entering bull market season. Bullish momentum will only start to gain force.
Namaste.
The bulls' strong momentum drives a new all-time high.hour gain stands at 4%, and the weekly increase expands to 6.7%. The total market capitalization has rebounded above $2.5 trillion. Three major positive factors have resonated: the expectation of (eased) Sino-US trade tensions, the SEC's policy shift to support on-chain innovation, and the continuous inflow of institutional capital (notably, Ethereum ETFs have seen 15 consecutive days of net inflows).
For the next 24 hours, the focus will be on the breakthrough of the all-time high at $111,980. The first resistance level is $112,500 (a dense short liquidation zone).
Humans need to breathe, and perfect trading is like breathing—maintaining flexibility without needing to trade every market swing. The secret to profitable trading lies in implementing simple rules: repeating simple tasks consistently and enforcing them strictly over the long term.
Trading Strategy:
buy@107000-107500
TP:109000-1095000
Hanzo / BTC 15 Min ( Accurate Tactical Bearish Breakout )🔥 BTC – 15 Min Scalping Analysis
⚡️ Objective: Precision Breakout Execution
Time Frame: 15-Minute Warfare
Entry Mode: Only after verified breakout — no emotion, no gamble.
👌Bearish Break : 109000
Price must break liquidity with high volume to confirm the move.
☄️ Hanzo Protocol: Dual-Direction Entry Intel
➕ Zone Activated: Strategic liquidity layer detected — mapped through refined supply/demand mechanics. Volatility now rising. This isn’t noise — this is bait for the untrained. We're not them.
🩸 Momentum Signature Detected:
Displacement candle confirms directional intent — AI pattern scan active.
— If upward: Bullish momentum burst.
— If downward: Aggressive bearish rejection.
🦸♂️ Tactical Note:
The kill shot only comes after the trap is exposed and volume betrays their position.
Today's Bitcoin Signal: Time to be braveHello friends🙌
Given the good price movement from support and buyers entering, now we can enter the position with capital and risk management and move with it to the specified targets.
🔥Join us for more signals🔥
*Trade safely with us*

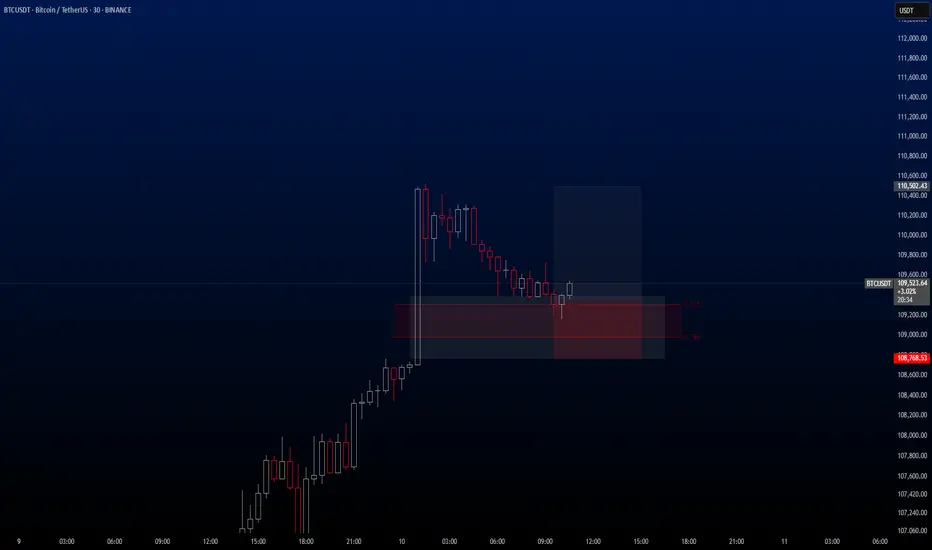
BTCUSDT Hello traders. I’ve spotted an ideal entry opportunity on the BTCUSDT pair. I’ve taken the trade and wanted to share it with you as well.
🔍 Trade Details
✔️ Timeframe: 15-Minute
✔️ Risk-to-Reward Ratio: 1:2
✔️ Trade Direction: Buy
✔️ Entry Price: 109,357.89
✔️ Take Profit: 110,502.43
✔️ Stop Loss: 108,768.53
🔔 Disclaimer: This is not financial advice. I’m simply sharing a trade I’ve taken based on my personal trading system, strictly for educational and illustrative purposes.
📌 Interested in a systematic, data-driven trading approach?
💡 Follow the page and turn on notifications to stay updated on future trade setups and advanced market insights.
Volatility period has begun.
Hello, traders.
Please "Follow" to get the latest information quickly.
Have a nice day today.
-------------------------------------
We need to see if the price can hold above OBV Low.
We need to see if the price can hold above OBV High or HA-High.
It is showing a downward trend while failing to rise above OBV Low.
If this continues to decline further, we should check if the HA-Low indicator is newly created.
This volatility period is expected to start around June 6 (June 5-7) and continue until around June 13 (June 12-14).
If the auxiliary indicator OBV falls below the Low Line, there is a possibility of another large decline.
At this time, the key is whether it can receive support and rise near 99705.62.
If not, it is expected to select the trend again when it meets the M-Signal indicator on the 1W chart.
The basic trading strategy is to buy at the HA-Low indicator and sell at the HA-High indicator.
If you apply this basic principle, you buy when it rises above 102049.52 and shows support, and sell near 104938.72.
For this basic principle to be applied normally, OBV is rising and the StochRSI indicator is rising.
However, it is better if the StochRSI indicator has not entered the overbought zone if possible.
However, if it is resisted and falls at the HA-Low indicator, it is likely to show a stepwise downtrend, and if it is supported and rises at the HA-High indicator, it is likely to show a stepwise uptrend.
Therefore, when testing support near the HA-Low indicator, if the OBV shows a downward trend and the StochRSI indicator shows a downward trend (if possible, a downward trend in the overbought area), the possibility of a stepwise downtrend increases.
The end of the stepwise uptrend that occurs after meeting the HA-Low or HA-High indicator is a downtrend, and the end of the stepwise downtrend is an uptrend.
Therefore, the trading method should be a fractional trading method.
I think the important thing in spot trading is how much you increase the number of coins (tokens).
Of course, depending on the situation, it may be better to make cash profits.
Since the coin market allows trading in decimal units, it is a useful investment market for increasing the number of coins (tokens).
Therefore, we can increase the number of coins (tokens) corresponding to profits while conducting trading according to the basic trading strategy.
That is, when the price rises by the purchase amount for each purchase price, sell it and leave the number of coins (tokens) corresponding to the profit.
At this time, you should be careful to include the transaction fee in the purchase amount and sell it.
The coins that are good for increasing the number of coins (tokens) corresponding to the profit rather than cash profit are BTC or ETH.
Additionally, BNB is also possible.
I think it is better to obtain cash profit if possible for the rest of the altcoins.
However, if there is a coin (token) that you think you want to increase in the medium to long term, you can increase the number of coins (tokens) corresponding to the profit by increasing the number of coins (tokens).
-
Thank you for reading to the end.
I hope you have a successful transaction.
--------------------------------------------------
- This is an explanation of the big picture.
(3-year bull market, 1-year bear market pattern)
I will explain more details when the bear market starts.
------------------------------------------------------

BTCUSDT UPDATEBitcoin's likely move scares me. Let's be careful. Bitcoin dominance could also move with this decline.
#BTC/USDT#BTC
The price is moving within a descending channel on the 1-hour frame, adhering well to it, and is heading for a strong breakout and retest.
We are experiencing a rebound from the lower boundary of the descending channel, which is support at 103141.
We are experiencing a downtrend on the RSI indicator, which is about to break and retest, supporting the upward trend.
We are looking for stability above the 100 moving average.
Entry price: 105268
First target: 106500
Second target: 107405
Third target: 109006
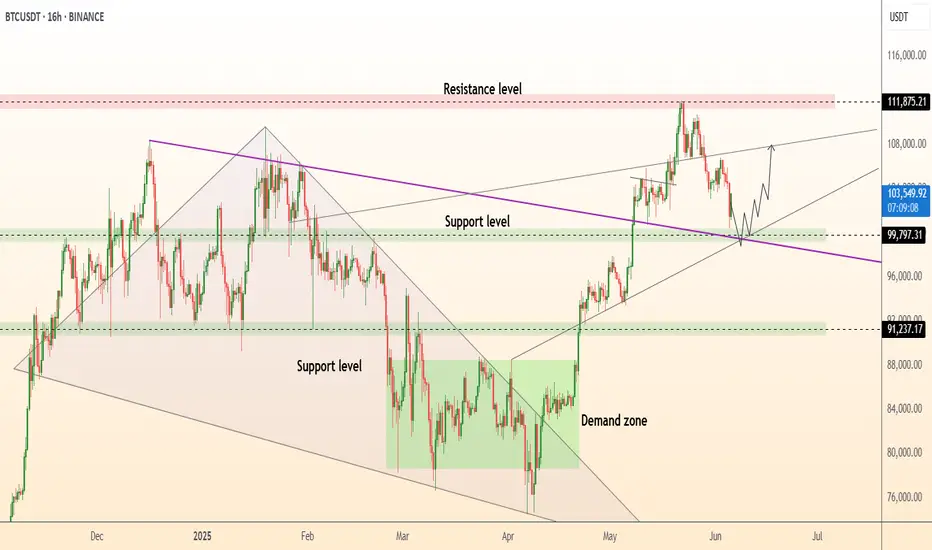
DeGRAM | BTCUSD held the $100k level📊 Technical Analysis
● Bounce from 99.8-100 k confluence (violet trend-line + former wedge top + horizontal demand) confirms the zone as fresh support.
● Price coils in a tight pennant under 106 k; 1.618 target of the pattern meets the rising-channel roof and red supply at 111-112 k, while RSI prints higher lows, flagging hidden bullish momentum.
💡 Fundamental Analysis
● CME futures basis widened above 10 % annualised as softer US claims cooled dollar bids, boosting carry appetite; meanwhile, on-chain reserves keep shrinking, hinting at supply squeeze.
✨ Summary
Buy 100-103 k; pennant break >106 k aims 111 k → 115 k. Bull view void on an H16 close below 99 k.
-------------------
Share your opinion in the comments and support the idea with a like. Thanks for your support!
Bitcoin Approaches Resistance as Momentum Cools: What’s Next?Bitcoin has been on a strong upward trend 🚀, but recent moves show signs of exhaustion as it approaches major resistance zones 🛑. The appearance of a three-drive pattern on the 4-hour chart, suggests the market could be due for a healthy correction 🔄. While the broader trend remains bullish, I'm watching for a potential pullback and then looking for renewed strength (bullish BoS) before considering new long positions. Patience and confirmation are key in these conditions! 👀✨

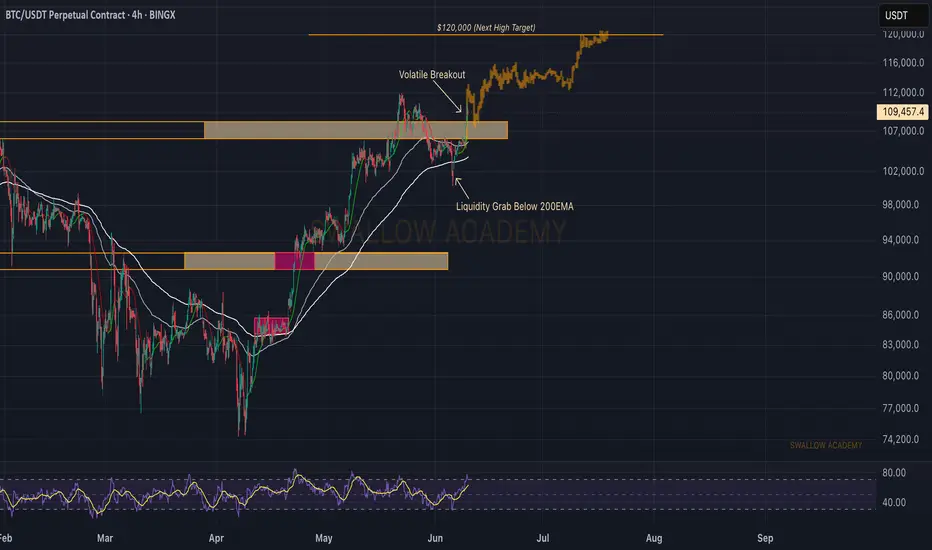
Bitcoin (BTC): Heading Towards The All Time Hight Bitcoin is still pushing into the second day of the week, where the price is heading towards the ATH area for a retest and potential breakout (which we have been looking for). Now if we keep that same momentum, we are guaranteed to retest the ATH area, where high volatility can be expected!
Swallow Academy
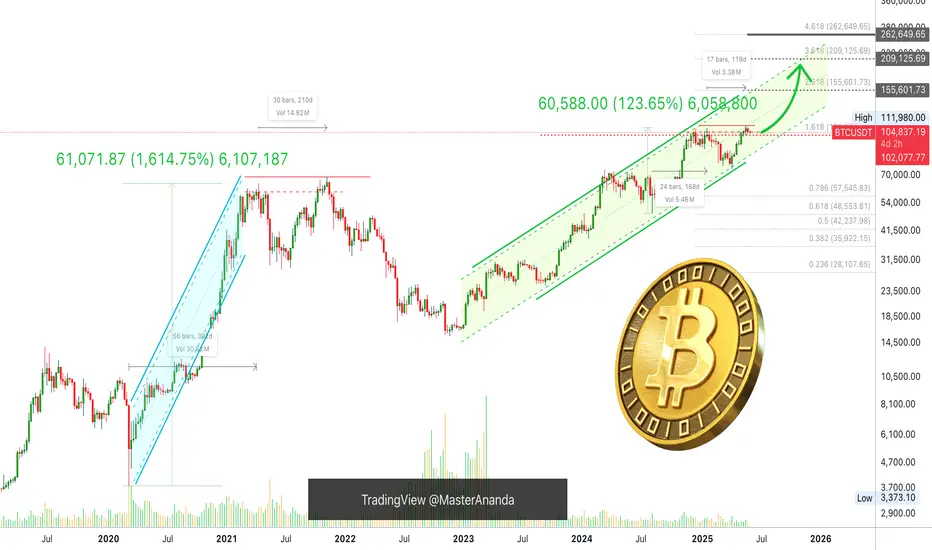
Correction? Show Me the Correction —Bitcoin Is Going Up!There is no correction and this "double-top" is nothing similar to 2021.
First, the wave that led to the April 2021 ath was a major hyper bullish wave starting March 2020. A total of 392 days of bullish action non-stop with 1,615% total growth. From a low of $3,782 to a high of $64,854, Boom!
The wave that led to the January 2025 all-time high was not a mega hyper, hyper-bullish bullish wave, instead it came after a long period of consolidation and a flash crash, which means the establishment of a long-term support. It started August 2024 and lasted 168 days total growth 124%. Completely different, so don't tell me that market conditions are the same because they aren't, we are not stupid, actually, we are very smart, right my friends? Long-term followers, readers and supporters!
The first high in 2021 happened in April the second in November, 210 days apart.
In 2025, we have a top in January and another one in May, 119 days. Very, very different.
In 2021 the altcoins rallied, everything rallied and everything was trading at new all-time highs before the bear market.
In 2025, nothing has rallied and most of the market was trading at the bottom. So we had an early peak in 2021, we get a late peak in 2025.
Since we had a long-term double top in 2021, we get a blow-off top in 2025, late 2025. Do you understand?
I am the Master of the charts!
Bitcoin is not done; it isn't over. We have an entire bullish wave before the bull market is over. This bullish wave is the fifth wave which is the speculative wave, in this wave anything goes. The market will go crazy. There will be euphoria, passion, craziness, money, growth!
The altcoins will be hitting new all-time highs and everybody will go crazy. NFTs, DeFi, DePin, RWA, Memes, POW, Gaming, AI, new, big, small and old, all welcomed, everything will grow. When the pixelated rocks start selling for millions of dollars, that's when the bull market ends.
When people start saying "Bitcoin will go to $1,000,000 in this cycle." That's when the top is in.
When Bitcoin starts trading at $219,999 and starts to slow down and Ark Invest comes up and says, "Bitcoin is going to $5,000,000 next"; when Michael Saylor starts saying, "I will be buying the top forever..." Get ready because that's the end. It isn't happening, now people are still talking about corrections and doubt, that's not the end of a bull market, that's the transition period between an advance a correction and the next leg up.
Just wait and watch. Just watch my friend... Just watch!
I assure you, Bitcoin is going up!
Namaste.
$BTC Bulls BackCRYPTOCAP:BTC is breaking out of a descending channel after a healthy pullback from the $ 112,000–$ 114,000 resistance zone.
Strong demand at $ 102,000–$ 104,000 supported the bounce, with buyers now pushing prices higher.
A clean breakout above $106K could open the path to retest $112K+.
The $102K–$104K zone remains key support as long as BTC holds above it, the short-term bias stays bullish.
DYRO, NFA