BTCUSDT.3S trade ideas
Bitcoin scalp long back to $106450Might wick backdown for entry
Just opened a bitcoin scalp long.
Targeting $106450 back to the recent highs. I anticipate the market will try to break it again then fail and correct deeper
Time sensitive.

BTC/USDT Technical Analysis, 2025-06-03 22:30 UTC✅ Bullish Reversal Confirmed
Breakout from a descending wedge with a strong volume surge (3x avg)
EMA(20) crossover above EMA(50) – early uptrend signal
RSI(14) at 58.7 – shows healthy bullish momentum
MACD turning positive with a fresh signal line crossover
OBV rising in line with price – confirms genuine accumulation
🔍 Smart Money Activity
Whale bid zone spotted between $105,500–$105,600 (visible in DOM)
Breakout aligns with London session high, adding sessional strength
🧠 Technical Confluence
This move combines structure, momentum, and volume — classic signs of a trend reversal and early entry opportunity. Chart markups include the wedge breakout zone, whale bids, EMA cross, and Fibonacci levels for context.
📈 Watching for potential continuation if current momentum sustains. Clean setup backed by technicals and smart money presence.

BTC - setupWe’re currently sitting in a bearish trend reversal zone,
so a pullback is absolutely possible —
and honestly, if you’re heavily long, it wouldn’t be the worst idea to look for some short hedges here.
However, we also have clear signals that are pushing us toward a breakout:
1️⃣ The heatmap shows a massive stack of shorts right above us
2️⃣ The ongoing U.S.–China meeting in London where tariffs are being discussed
➡️ One positive headline could ignite the next rally.
I'm bullish and positioned accordingly.
If anyone has questions, drop them below — I read everything 👇
LFG! 🚀

BTCUSDT: Your Next Move? The Blue Box OpportunityAlright, focusing on BTCUSDT. This blue box is a critical buying zone.
The market's recent moves demand clarity. You need to know where genuine opportunity lies, avoiding the traps that catch most traders.
I've identified this blue box as a prime area where demand could ignite. But don't just jump in. Here's the plan:
Watch the Volume Footprint: Is there real accumulation, or just noise?
Spot CDV Divergences: Hidden strength often appears here, even if price looks weak.
Confirm on LTF: A clear breakout above minor resistance, followed by a retest as support, is your green light.
Be vigilant for liquidity hunts – those quick dips that shake out weak hands before a real move. If this blue box holds, and we get these confirmations, my bias is firmly upwards.
I only focus on assets with sudden, significant volume increases. BTCUSDT's current setup, combined with this potential volume, makes it a high-interest play.
Keep a very close eye on this blue box. Understanding these subtle signals means you can navigate these intricate dynamics, securing your position for potential gains. Miss this, and you might regret it.
📌I keep my charts clean and simple because I believe clarity leads to better decisions.
📌My approach is built on years of experience and a solid track record. I don’t claim to know it all but I’m confident in my ability to spot high-probability setups.
📌If you would like to learn how to use the heatmap, cumulative volume delta and volume footprint techniques that I use to determine very accurate demand regions, you can send me a private message. I help anyone who wants it completely free of charge.
🔑 On my profile, you can find an extensive track record spanning hundreds of analyses and many examples of my strategies in action. To keep things concise here, I'm sharing just a few of my most recent successful calls as a small snapshot of my ongoing work:
📊 FLOKIUSDT - +%100 From Blue Box!
📊 TRXUSDT - I Do My Thing Again
📊 OGNUSDT | One of Today’s Highest Volume Gainers – +32.44%
📊 TIAUSDT | Still No Buyers—Maintaining a Bearish Outlook
📊 Simple Red Box, Extraordinary Results
Feel free to check out my TradingView profile for all of them; listing everything here would genuinely take too long! 😉

BTC/USDT Technical Analysis BTC/USDT Technical Analysis | Approaching a Key Confluence Zone
As shown on the chart, Bitcoin has successfully reached our previous bullish targets. The price is now testing a critical resistance zone that could determine the next major move.
🟢 Bullish Scenario: Breakout Toward Key Levels
If BTC breaks above the current resistance, the next targets to watch are:
$106,596 – first resistance
$107,058 – major horizontal resistance
Descending trendline – dynamic resistance that has held strong in recent weeks
A clean breakout above the trendline may lead to further upside toward:
$107,902 and $108,008
These zones have historically acted as strong barriers, so price reaction here will be crucial.
🔻 Bearish Scenario: Rejection and Pullback
If BTC gets rejected at the current resistance, look for support at:
$104,740 – first area for a bounce
$104,146 – key support zone to hold for bulls
Failure to hold these levels could trigger further downside pressure.
📌 Summary
Bitcoin is at a critical intersection of horizontal and trendline resistance. A breakout could ignite a strong bullish move, while a rejection might bring another leg down.
📉 Wait for confirmation candles before entering.
🚀 If you find this helpful, smash that follow for more high-probability setups, clean charts, and daily updates. Let’s trade smart, not blind. 📈

btcusd for short *The content on this analysis is subject to change at any time without notice, and is provided for the sole purpose of assisting traders to make independent investment decisions.
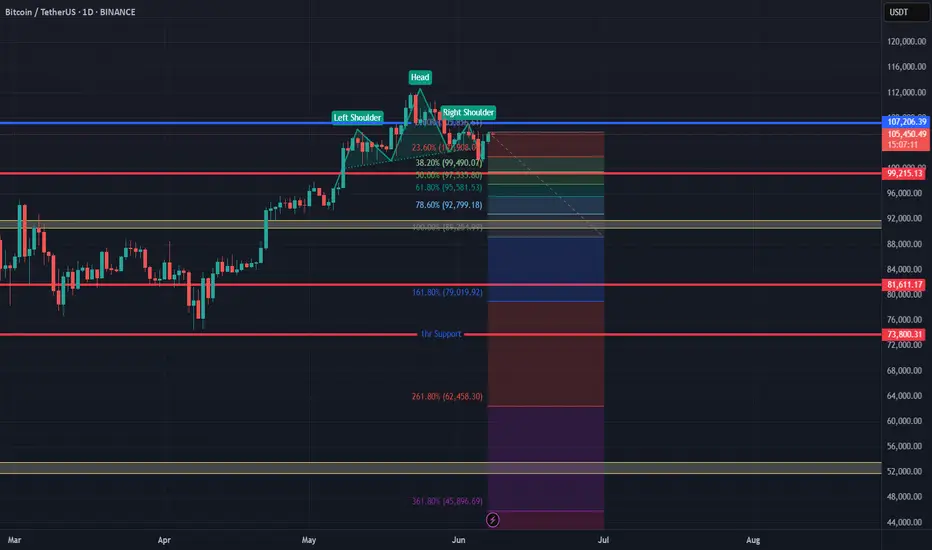
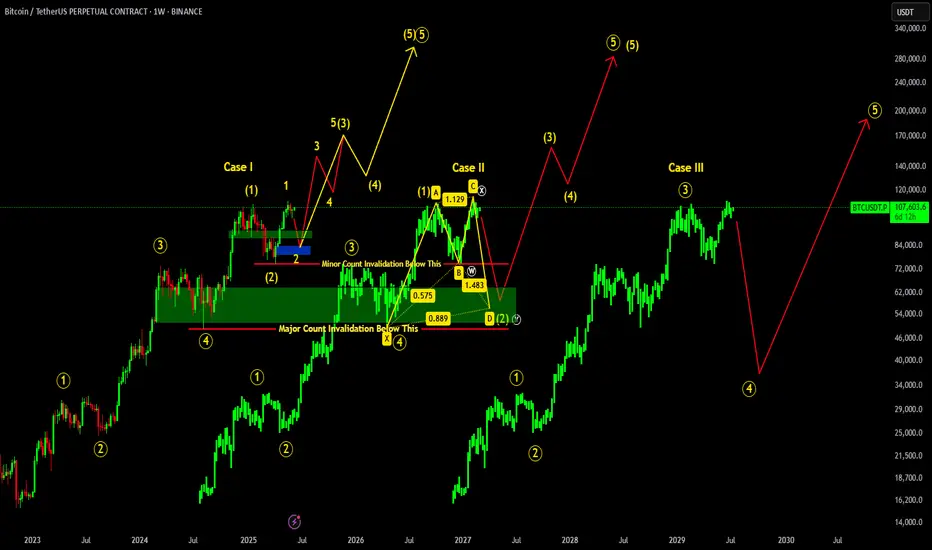
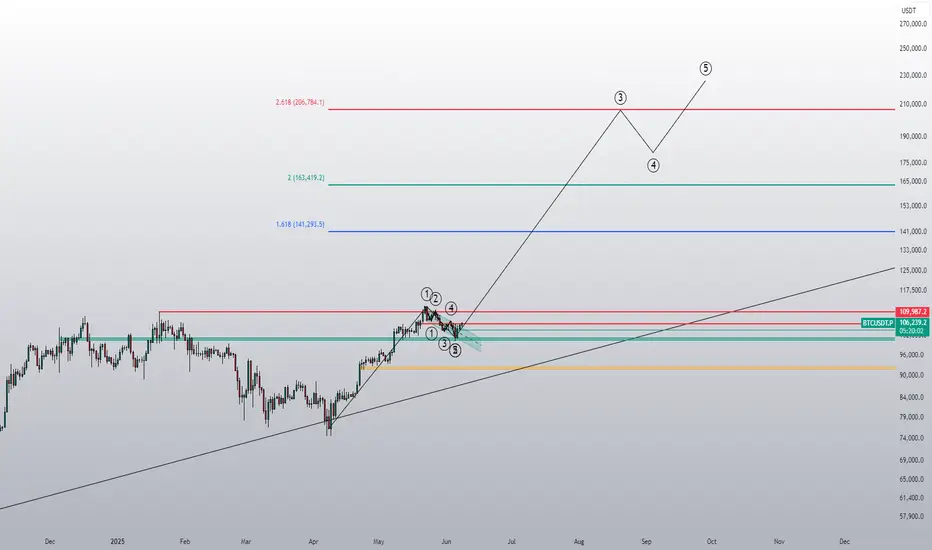
BITCOIN ROAD TO 300K !!! ELLIOTT WAVE CASE STUDYThere are three possible cases for Bitcoin which we can now consider according to Elliot wave count on big picture:
Case I: According to this count if we hold above 74.5k , recent low, we may see major shift in BTC. Retracement Up to 92-79k is good which will form inverse head & shoulders, potentially breaking ATH up to 170K, if things goes well & 74.5K region remains on hold.
Case II: If in case 74.5K region breaks, then it will invalidate minor count causing BTC to retrace more up to 64-52K major reversal zone region. If such thing happens, bullish shark pattern will be formed causing major reversal from that region BUT 49K region should remained hold!!!
Case III: Worst case scenario if 49K region breaks, then it will cause major count invalidation dropping BTC further up to 45-33K region.
HolderStat┆BTCUSD springs from 100k railAfter a week-long pullback, CRYPTOCAP:BTC ricochets off 100 k support, keeping the rising-channel narrative alive. Bitcoin price now squeezes beneath a descending trendline; a daily close over 109 k could unleash a breakout toward the 112-114 k resistance shelf.
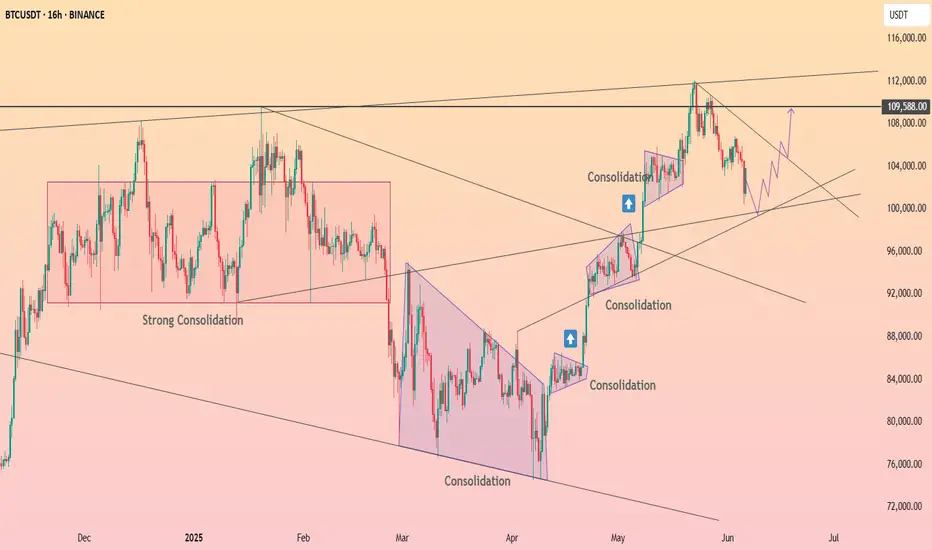
BTC on the riseThere is no correction at this point; BTC wants to go higher. The next resistance lies around 109k.

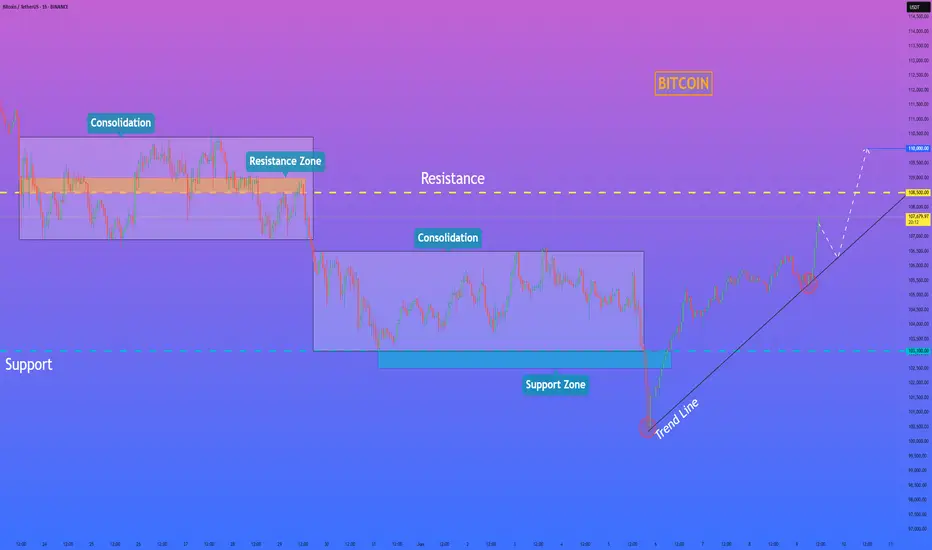
HelenP. I Bitcoin can break resistance level and continue growHi folks today I'm prepared for you Bitcoin analytics. After looking at this chart, we can see how the price traded inside a consolidation, where it reached a resistance level, which coincided with a resistance zone. Then it some time traded between the 108500 level and then dropped to the support level, thereby exiting from consolidation and breaking the 108500 level one more time. After this, BTC started to trade inside another consolidation, where it rebounded from the support level and rose to the top part of this range. Then it some time traded near this area and then dropped to the trend line, breaking the support level and exiting from the consolidation. But then BTC started to grow and rose to the 103100 level, broke it, and continued to grow. A not long time ago, it made a correction to the trend line and then bounced and continued to move up. So, I expect that BTCUSDDT will correct to the trend line and then rise to the resistance level and break it. Then, I thought that Bitcoin might continue to move up next; therefore, I set my goal at 110000 points. If you like my analytics you may support me with your like/comment ❤️
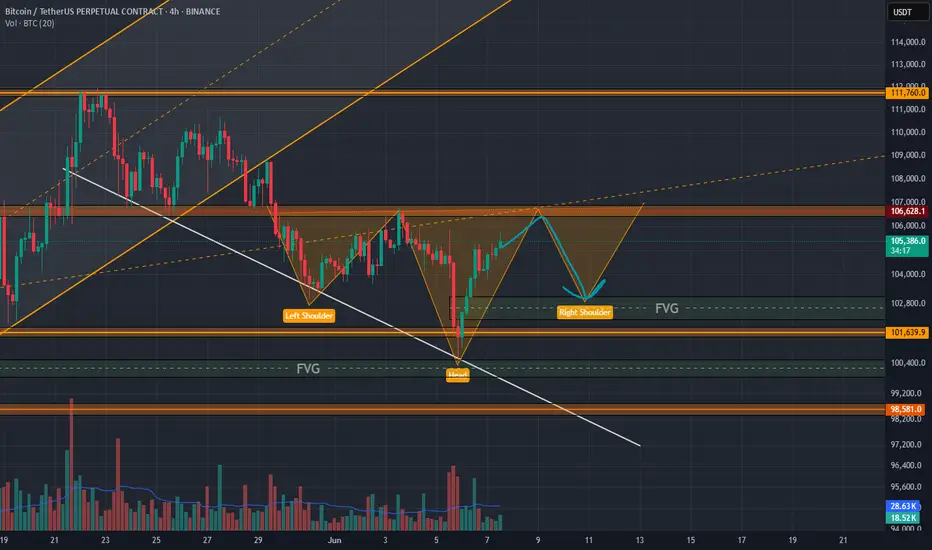
BTC can make an reverse head and shouldersBINANCE:BTCUSDT.P
İf btc take a reversal from 106.500 area, we can see a head and shoulders pattern. And if the pattern completed, we can see a new Ath in btc.
Bitcoin at the $107K Line – Is It Going Up or What?Bitcoin at the $100K Line – Is It Going Up or What?
Bitcoin is in a pretty critical spot right now. It’s been holding strong around the $100K zone, but it’s not clear if it’s gonna keep going up or start pulling back. We broke it all down in the video.

BTC: Decision Time Ahead! A Quick Update!!Hey Traders!
If you’re finding value in this analysis, smash that 👍 and hit Follow for high-accuracy trade setups that actually deliver!
Bitcoin is once again testing the descending trendline resistance on the 4H chart.
We're currently at a make-or-break level:
A clear breakout above the trendline could trigger a bullish move toward $110K+
A rejection here might push BTC back to the $100K–$98K support zone
📍The green zone remains key — last time, it held as strong support.
But without a breakout above $106.5K, bulls are on the defensive.
Watch price action closely here — the next big move could start from this very point.
What’s your take? Bullish breakout or another dump loading?

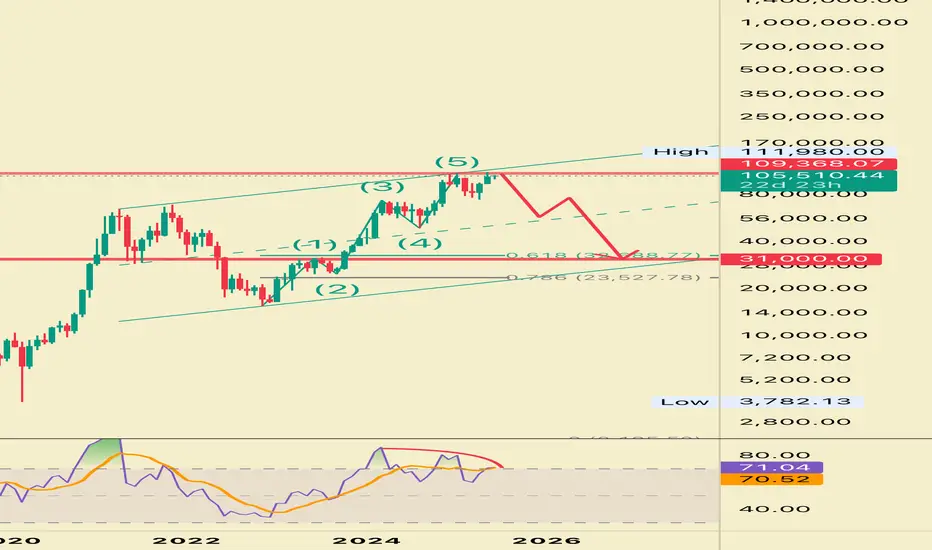
“Bitcoin Elliott Wave Breakdown – Watch This Before You Trade!”🔹 “This is Bitcoin on the 1-Month chart. What we see here is a completed 5-wave impulse according to Elliott Wave Theory.”
🔹 “Wave (1) through (5) is now complete, and the price has hit the upper boundary of a long-term ascending channel.”
🔹 “Notice this red zone? This is a strong resistance area between $76K and $111K. We might be forming a potential double top pattern here.”
🔹 “Divergence is likely forming in wave 5 — a classic sign of weakening momentum.”
🔹 “If we break below $66K and then $53K, expect a drop all the way to the $31K zone.”
🔹 “This level aligns with the bottom of the channel and possibly the 0.618 Fibonacci retracement.”
🔹 “Final target? $31,000 – a key zone for accumulation before the next major cycle.”
2025/06/09 BTCUSDT Raising wedge patternChart is running in rising wedge pattern.
I expect it is break and retest 100K in this week.
Entry at 105k and SL at 107k
TP at 100.x K
Bitcoin's Next 20% Move? My Plan Unveiled Bitcoin (BTC) - Navigating Key Levels & Potential Paths
Technical Outlook — 8 June, 2025
1. Current Market Context:
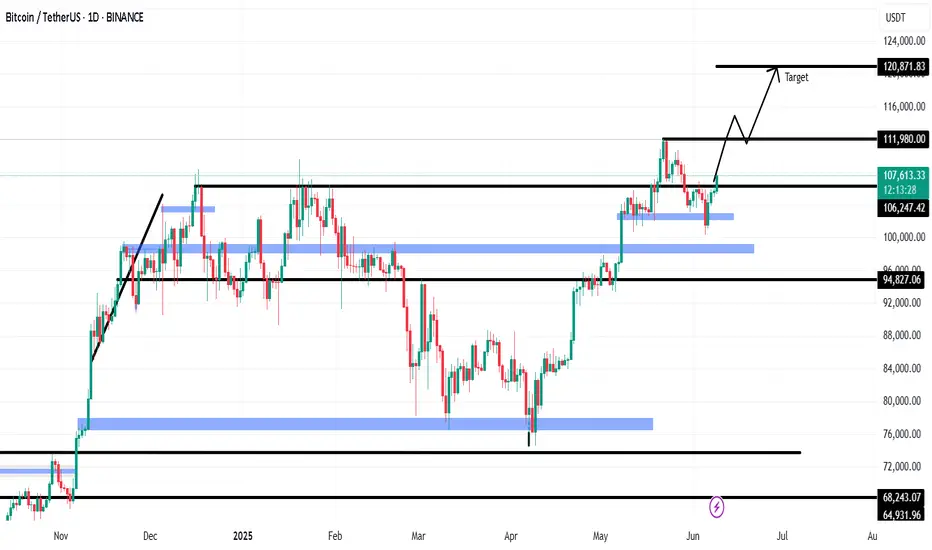
Price Action: Bitcoin is currently trading around the $106,000 mark after a recent retracement from higher levels. We've seen a significant rally from the April lows, and the market is now consolidating.
Key Levels: The chart highlights several important resistance and support zones that will likely dictate future price movements.
2. Key Observations & Potential Scenarios:
Resistance Levels:
Immediate Resistance: ~$108,000 - $112,000. This zone has acted as resistance previously and is currently being tested.
Next Major Resistance: ~$124,000 - $128,000. This is a crucial zone from previous highs and a potential target if the current resistance is overcome.
Support Levels:
Immediate Support: ~$96,000 - $100,000. This zone aligns with previous price consolidation and is the first line of defense if the price drops.
Strong Support: ~$92,000 - $88,000. This area previously acted as significant support and could be a strong bounce zone.
Lower Support/Trendline: ~$76,000 - $80,000. This aligns with the lower boundary of the broader ascending channel/trendline.
Highlighted Paths (Orange Arrows): The chart suggests two potential paths:
Scenario A (Bullish Continuation): A break above the $108,000-$112,000 resistance, leading to a push towards $124,000-$128,000. This would likely follow a slight dip or consolidation before the breakout.
Scenario B (Retracement & Bounce): A deeper retracement towards the $96,000-$100,000 or even $92,000-$88,000 support zones, followed by a bounce and subsequent rally towards the higher resistance levels. This scenario aligns with the idea of a healthy correction before further upward movement.
3. Trading Plan:
A. Bullish Entry (Aggressive / Confirmation Trade):
Trigger: Clear daily candle close above the $112,000 resistance level with strong volume.
Entry: Upon confirmation of the breakout.
Target 1: $124,000
Target 2: $128,000
Stop Loss: Below the newly formed support level (e.g., $105,000 - $107,000, depending on the breakout structure).
B. Long Entry (Dip Buy / Value Trade):
Trigger: Price retests and holds either the $96,000 - $100,000 support zone or the $92,000 - $88,000 support zone. Look for bullish reversal candlesticks (e.g., hammer, bullish engulfing) on the daily timeframe.
Entry: Upon confirmation of support holding and a bullish reversal signal.
Target 1: $108,000
Target 2: $112,000
Target 3: $124,000 - $128,000 (if momentum continues).
Stop Loss: Just below the tested support zone (e.g., $95,000 for the first support, or $87,000 for the second support).
C. Bearish Outlook (Short-Term / Risk Management):
Trigger: A clear daily candle close below the $88,000 support level, invalidating the current bullish structure.
Action: Consider exiting long positions or being prepared for further downside towards the $76,000 - $80,000 level. This would suggest a breakdown of the overall uptrend.
4. Risk Management:
Position Sizing: Only risk a small percentage of your trading capital on any single trade (e.g., 1-2%).
Stop Loss: Always use a stop loss to limit potential losses.
Profit Taking: Consider taking partial profits at target levels to secure gains.
Market Volatility: Bitcoin is highly volatile. Be prepared for rapid price movements.
5. Additional Considerations:
Volume: Always pay attention to trading volume. Strong volume on breakouts confirms the move, while weak volume may suggest a false breakout.
If you found this analysis valuable, kindly consider boosting and following for more updates.
Disclaimer: This content is intended for educational purposes only and does not constitute financial advice.

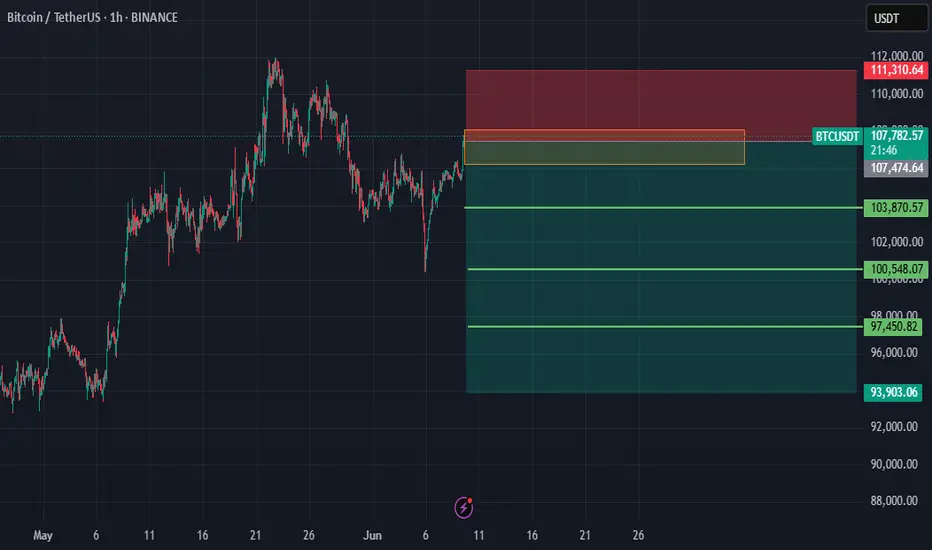
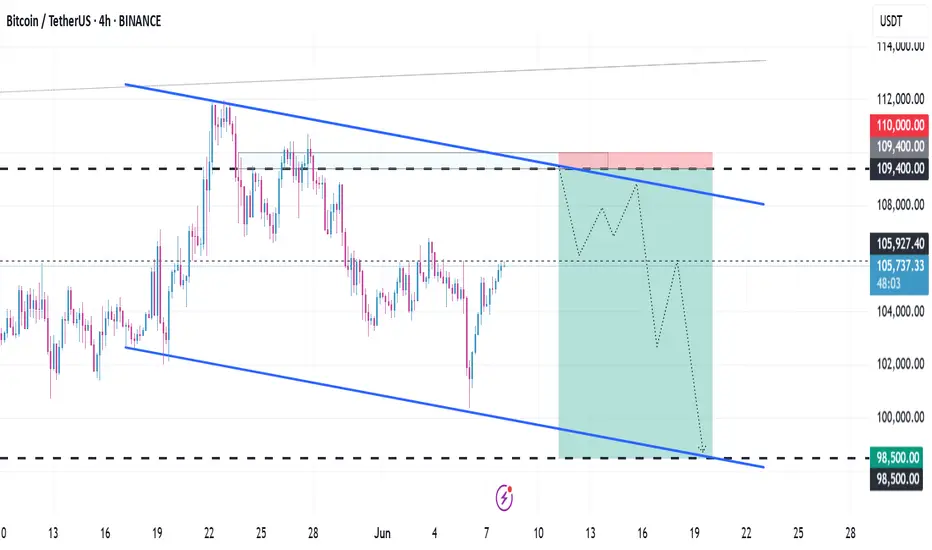
Plan BTCWith this idea combined with ichimoku, I found a confluence entry point with a short stop loss, the target is 98500, then I will consider gradually accumulating goods there.
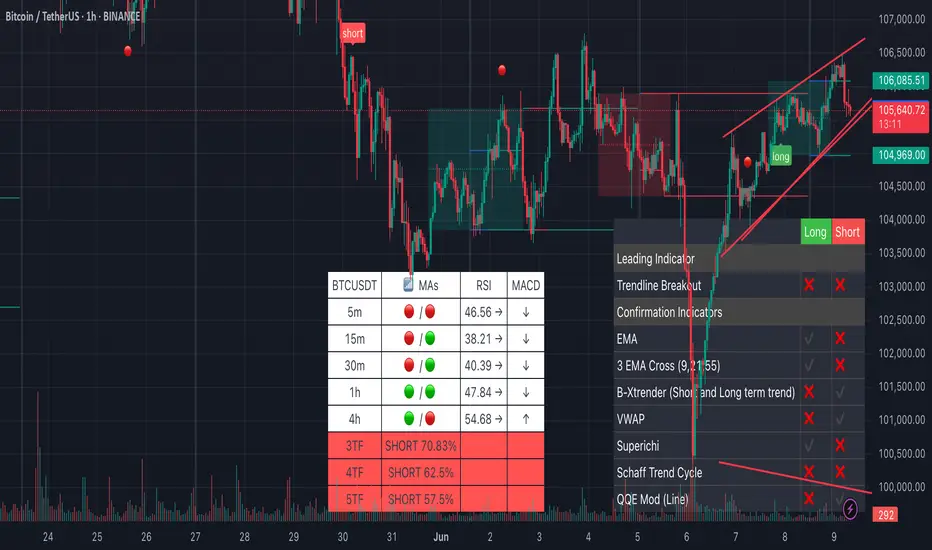
Bitcoin Short Position Update – June 7, 2025We are the SeoVereign Trading Team.
With sharp insight and precise analysis, we regularly share trading ideas on Bitcoin and other major assets—always guided by structure, sentiment, and momentum.
🔔 Follow us to never miss a market update.
--------------------------------------------------------------------------------------------------------
Bitcoin Analysis
After a prolonged downtrend, Bitcoin is attempting a temporary rebound in the form of a dead cat bounce. This current upward move appears to be more of a technical rebound within the broader downtrend rather than a strong trend reversal.
From an Elliott Wave structure perspective, the current rebound is being captured as an impulsive wave, which suggests it could either be the final leg of a 5-wave move or the movement just before a corrective phase begins. Based on this view, I am considering entering a short position by targeting the point at which the upward momentum starts to exhaust.
Wave Ratio:
The length of the current 5th wave is approaching 1.618 times the length of the 1st wave, a ratio often observed in overextended wave patterns.
Target Price:
The initial target is set at 104,500, which coincides with the retracement zone of the previous decline and the prior support level.
The current area is considered favorable for a short entry in terms of risk-reward ratio. However, it is crucial to confirm whether the upward wave has truly concluded.
With overbought signals from oscillators and the appearance of a trend-reversal candlestick pattern, a short entry can be considered upon confirmation.

This could go very high!This looks incredibly like a full-send setup, which could blast Bitcoin up to 200k in a wave 3 of an Elliot wave pattern.
BTCUSDT: Sharing of the Latest Trading StrategyAll the trading signals today have resulted in profits!!! Check it!!!👉👉👉
Fundamental Analysis:
The U.S. Senate’s procedural vote on the GENIUS Stablecoin Act could inject significant 合规 capital into the crypto market if passed. Regulatory sentiment has improved following the Trump administration’s push to include Bitcoin in strategic reserves. Concurrently, Bitcoin ETFs recorded over $40B in inflows during May, while Coinbase’s inclusion in the S&P 500 has solidified crypto’s mainstream investment credentials.
Technical Analysis:
Bitcoin is consolidating above $100k, with MACD showing diminished but dominant bullish momentum. RSI at ~55 indicates balanced market forces. On-chain metrics reveal historically low distribution pressure from long-term holders and accelerating retail participation, forming a supportive backdrop for price appreciation.
Trading Recommendation:
Seek long entries on pullbacks. Light positions may be initiated between $103k-$104k.
Trading Strategy:
buy@ 103000–104000
TP:106000-108000
Share accurate trading signals daily—transform your life starting now!
👇 👇 👇 Obtain signals👉👉👉

