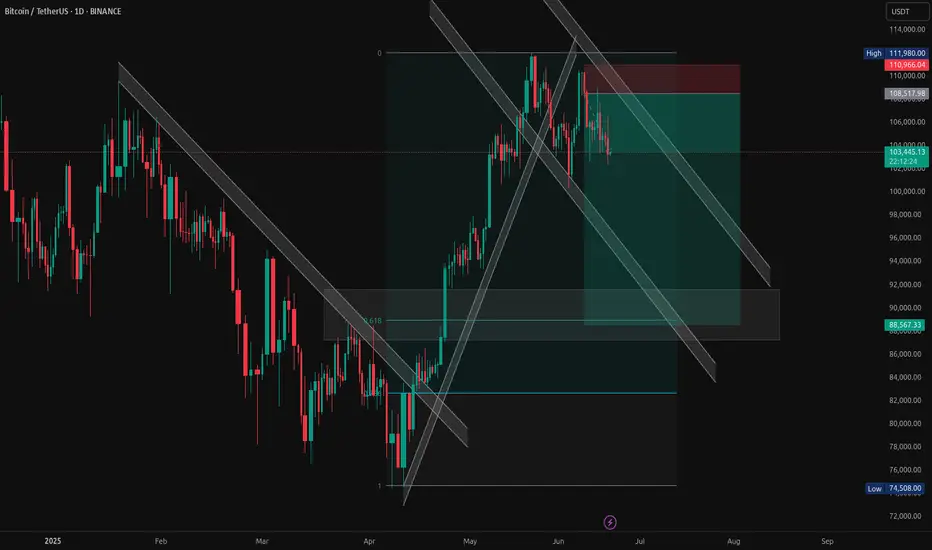
BTC/USDT – Bearish Channel Rejection with Confluence ZonesBitcoin is showing signs of weakness after rejecting the top of the descending parallel channel. This trade idea is based on multiple confluences:
Bearish rejection at key resistance near $110,000–$112,000
Price respecting the descending trendline
0.618 Fibonacci retracement zone acting as potential demand
Risk-reward structure targeting deeper support near $88,500
Previous bullish channel broken – now acting as resistance
📌 Entry near: ~$108517
🎯 Target: ~$88500
🛑 Stop Loss: ~$111980
Looking for further downside continuation if this structure holds. Watch how price reacts at mid-channel and the demand box.
BTCUSDT.3S trade ideas
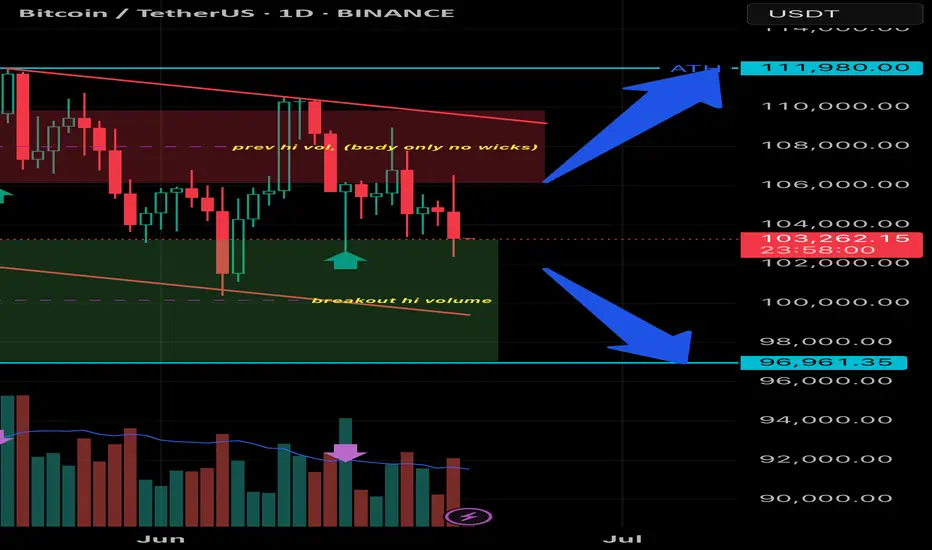
BTCUSD 1D | big consolidation
🧠 1. Pattern and Market Structure Identification
✅ Trend and Pattern: Bullish Flag
• Structure: Price forms a descending consolidation pattern (descending channel) after a sharp upward impulse — this is a classic characteristic of a bullish flag.
• Breakout volume occurred from the consolidation zone near the green support area → an early signal that bulls are active.
• However, the price is currently retesting the breakout area and is testing the demand zone again.
📊 2. Volume Analysis
• Volume spikes (purple arrows) occurred at several key points:
• Initial breakout
• Support retest
• High volume during the breakout = valid breakout confirmation.
• Currently, volume is slightly declining = a signal of consolidation and possible accumulation.
📉 3. Support & Resistance Levels
• Strong Support: 96,961 USDT (marked by the blue line and breakout volume).
• Major Resistance: 111,980 USDT (all-time high and projected target from the flag breakout).
• Current Price: 103,272 USDT → sitting between these two key levels.
🎯 4. Potential Price Direction
Bullish Scenario:
• If the 96,961 USDT support holds, price could continue upward → the bullish flag target = projected height of the flagpole.
• Conservative Target: 111,980 USDT (ATH)
• Aggressive Target (if ATH breakout occurs): 115,000+ USDT
Bearish Scenario:
• If price breaks below 96,961 USDT with strong volume, it could invalidate the bullish pattern and drop further to the 92,000 – 90,000 USDT range.
bitcoin bullish and bearish BINANCE:BTCUSDT.P
bullish
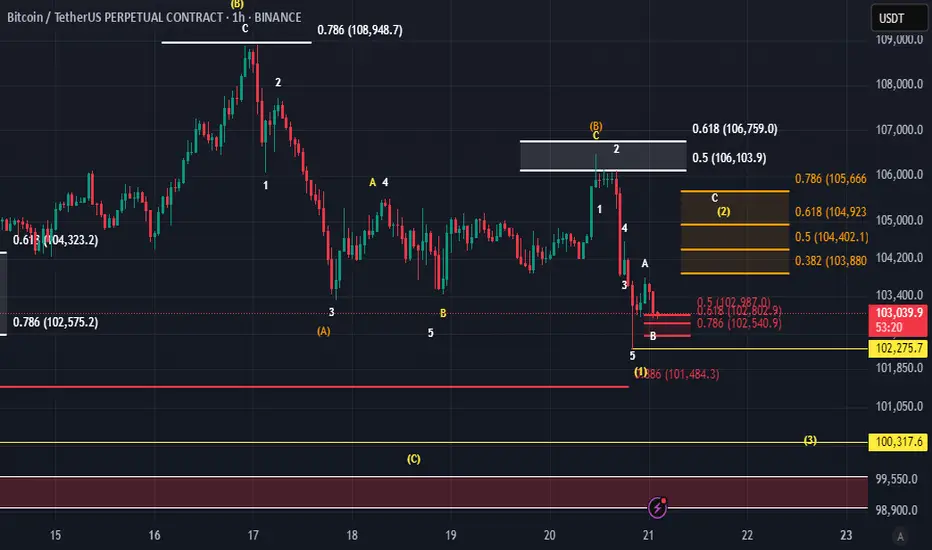
🔹 Technical analysis according to Elliott waves (time: 1 hour)
📌 The pattern shown on the chart shows a complex structure that includes a complex correction within the larger wave (B), and the following is clear:
🔸 Main waves:
Wave (1) up from the bottom has been confirmed.
It was followed by a corrective wave (2) that ended near the 0.786 Fibonacci level = 102,575.
Then the upward wave (3) started, and it seems that it has been completed or is about to be completed.
🔸 Current status:
The price is currently moving within a small corrective wave, likely wave (4).
Current major support is located at: 🔸 102,275.7 (very important level) 🔸 100,317.6 (in case the correction extends)
🔸 Critical resistance areas:
For the bullish scenario to be valid, the resistance must be broken:
106,759 (0.618 Fibonacci ratio)
108,948 (0.786 – peak of wave C)
---
🔹 Important technical points:
🔸 The last correction (A)-(B)-(C) shows a clear triple structure, indicating that wave (2) has been completed.
🔸 The price is currently bouncing off the 0.5 - 0.618 Fibonacci levels (104,402 - 104,923), which reinforces the possibility that wave (2) has actually ended, and that we are currently starting an upward wave (3).
---
✅ Conclusion:
✅ As long as the price is above 102,275, the upward scenario through wave (3) remains valid.
⚠️ Breaking 100,317 indicates the failure of the bullish scenario and a structural shift in the waves.
🔻 Alternative (Bearish) Scenario – Short-Term:
If the price fails to maintain the current support at 102,275, we may not be in wave (4) but rather at the beginning of a new downward wave within a broader corrective scenario, as follows:
---
🔸 Wave Interpretation:
🔹 Wave (B), which completed at the peak near 108,948, likely marked the end of an upward correction.
🔹 The current downward wave from that peak could be:
Either wave 1 of C within a larger correction,
or the beginning of wave (C) within a bearish (A)-(B)-(C) pattern.
---
🔻 Potential Downside Targets in This Scenario:
1. Breaking 102,275 = Confirmation of the beginning of a new downward wave.
2. First Target:
🔸 101,484 (1.618 Fibonacci Extension – Wave 1 Expected)
3. Second and Stronger Target:
🔸 100,317 = Previous Major Support, Representing an Important Structural Test Area.
4. Third and Most Extreme Target in This Scenario:
🔸 98,800 – 99,260 = Possible Wave C Extension (Corresponds to a Larger Downside Scenario).
---
⚠️ Failure Signal:
Remaining below 105,926 (Previous Sub-Wave Resistance) maintains selling pressure.
Any weak bounce and lack of a clear wave 5 upwards = an additional sign of bearish dominance.
---
🔻 Conclusion:
✳️ The bearish scenario assumes that the peak at 108,948 was the end of corrective wave (B), and that we are now in a downward wave C targeting areas between 101,400 and 99,200, and possibly lower.
✳️ A break of 102,275 would be key to activating this scenario.
$BTC Probable scenarios.I think the chart speaks for itself. Technical targets for both RSI and Price Actions are noted in the chart.

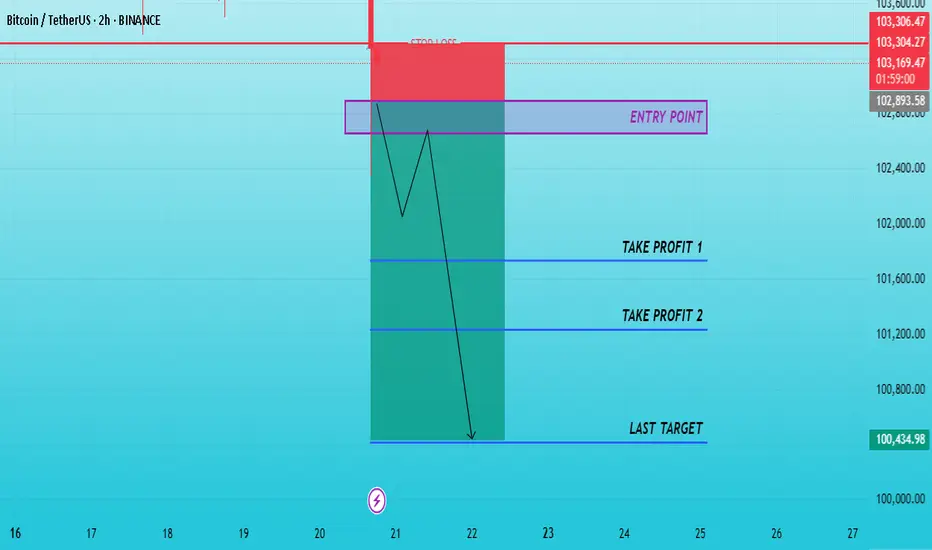
CHECKL BTCUSDT SIGNAL READ CAPTAINEntry: around(102893.55)102653.66 ✅
Take Profit 101732.58✅
Take Profit 2: 101231.00✅
Last Target:100412.00 ✅
Stop Loss: 103304.27❌
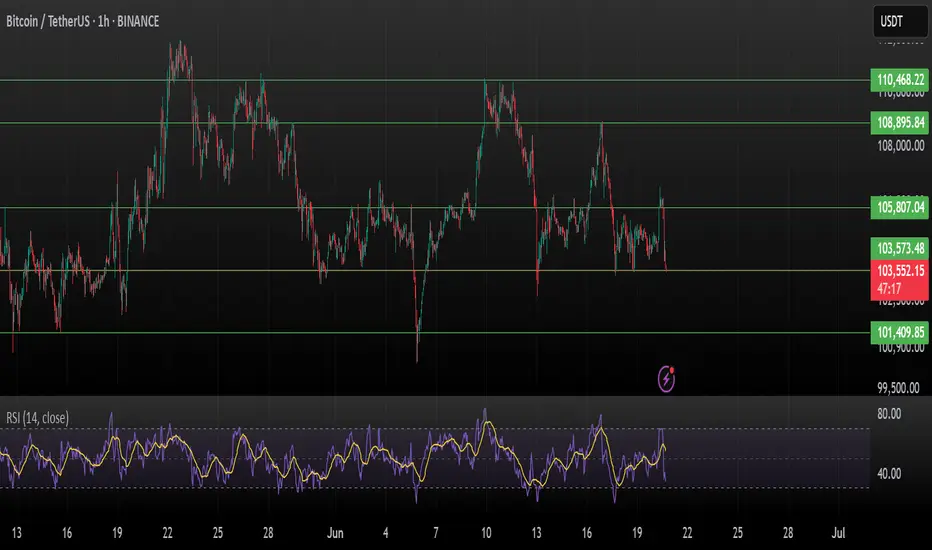
BTC Testing Crucial Support – Breakdown or Bounce ?Bitcoin is currently testing a critical support zone around $103,573 – a break below could trigger a sharper move toward $101,400.
Price rejected from ~$105.8K
Support holding... for now
RSI dropping fast – now near 34 (1H TF)
Weakening momentum visible
This level is the last line of defense for bulls. If it cracks, expect volatility.
Watch closely. Break = panic or buying opportunity?
DYOR. Not Financial Advice.
BTC- Bounce here or 93K incomingWhatever WTI does.. will determine what the Stock Market does.... which will determine what BTC does.. which will determine what all of Crypto does..
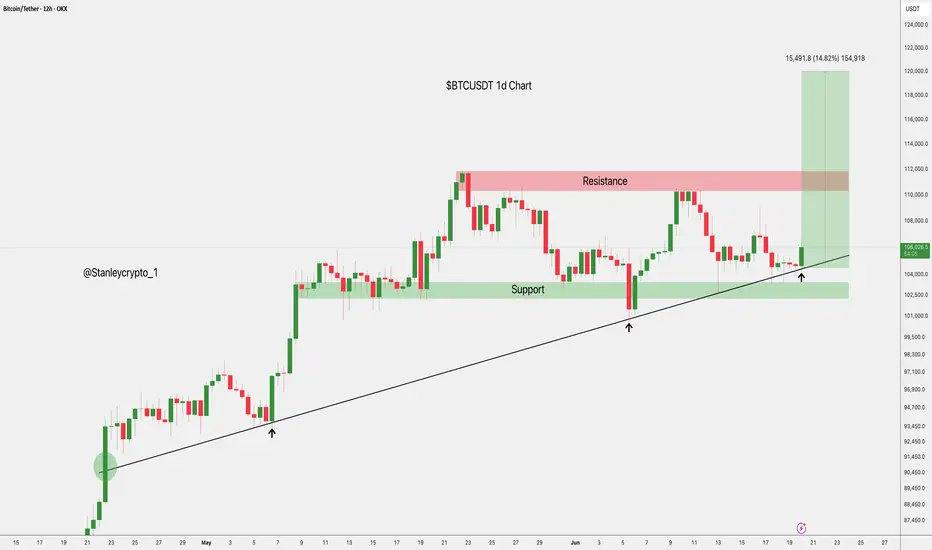
$BTCUSDT Eyes $120K After Key Support BounceBTCUSDT is holding strong above the ascending trendline and key support near $104K.
A fresh bounce suggests bullish momentum, with potential to break the $110K resistance.
If that happens, the next target could be around $120K. Trend remains bullish above support.
DYRO, NFA
HolderStat┆BTCUSD ready for the next leg upBINANCE:BTCUSDT on the 3h chart is showing a textbook sequence of consolidation phases, each acting as a launchpad for further gains. The price action is respecting both the ascending and horizontal support lines, with each dip being bought up quickly. The current consolidation is forming a tight triangle, indicating that volatility is about to return. The structure favors a bullish breakout, with the next resistance levels at 107,000 and 110,000. As long as BTC holds above the 104,000 support, the uptrend remains strong and the probability of a new rally is high.

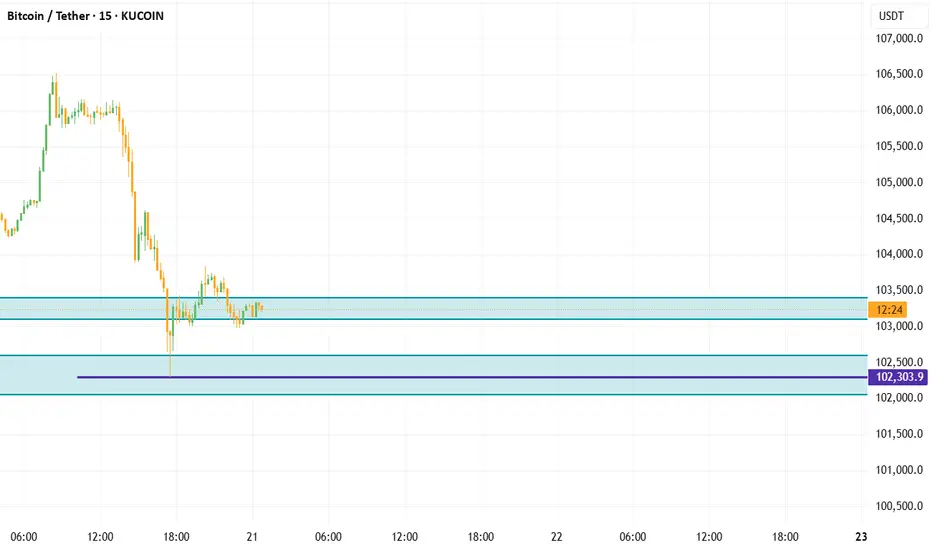
BTC/USDT Technical Analysis, 2025-06-18 09:45 UTC📘 BTC/USDT Scalping Setup – Whale-Assisted Dip Buy
This strategy is designed for high-precision, short-term long trades on BTC/USDT using the 15-minute chart. It targets oversold conditions with signs of reversal, confirmed by whale activity, volume spikes, and key support levels.
The edge comes from combining retail technicals (RSI, Stoch, MACD, candlestick patterns) with institutional confirmation (order flow, OBV, and large bids from whales).
✅ Key Strategy Components:
Oversold Technicals: RSI and Stochastic suggest price exhaustion.
Support Zone Alignment: Price is dipping near major support (pivot S1 or local low).
Reversal Candlestick: Clean bullish signals like Hammer or Engulfing show shift in sentiment.
Smart Money Confirmation:
Whale buyers (>5 BTC bids)
Bid dominance (>3%)
OBV rising = silent accumulation
Timing is Critical: Trades are only taken in the first 2 minutes of the 5-min candle with a volume burst.
🎯 Trade Management
Entry: On close of confirming candle (when all criteria align)
Take Profit: +1.2% (or ~1200 pts)
Stop Loss: -0.6% (or ~600 pts)
Risk/Reward: 1:2
📈 Why This Works
This is not just a basic RSI/Stochastic play — it’s a multi-confirmation strategy tuned for whale detection, volume acceleration, and institutional footprints. It’s ideal for high-volatility sessions and works best in range or retracement phases of a broader uptrend.
⚠️ Pro Tips
Avoid entries during extreme news volatility
Be disciplined – all filters must align (this is a precision setup)

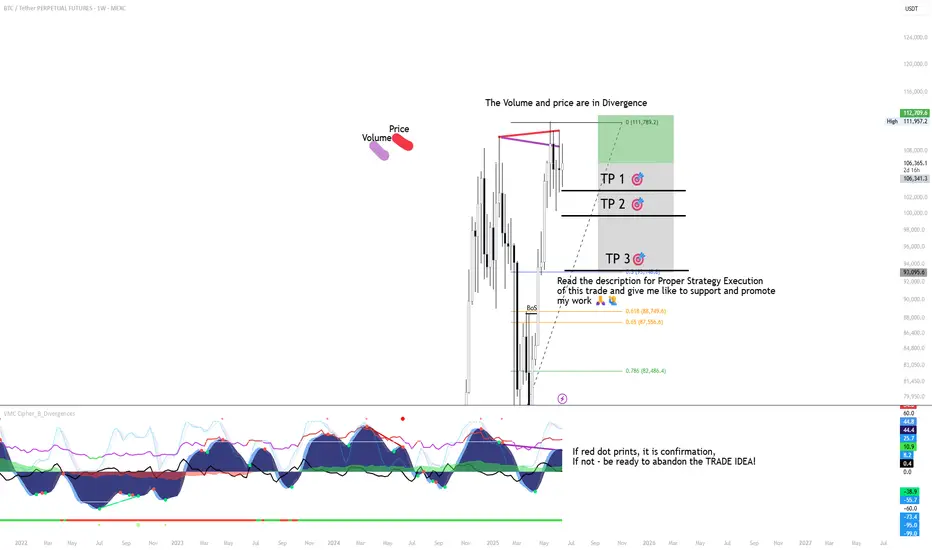
BTC MACRO PLAY - SHORT TRADE SETUP📉 BTC/USDT SHORT TRADE SETUP – WEEKLY TIMEFRAME
🔍 Trade Idea Overview:
We are seeing a bearish divergence between price and volume on the weekly chart — while price makes higher highs, volume is decreasing, signaling a potential reversal or weakening trend.
Further confluence is seen with the VMC Cipher indicator. If a red dot prints, it will confirm the short entry. If not, the trade idea should be abandoned.
📊 Trade Plan:
Entry Zone: Around $106,300–$107,000 (wait for confirmation)
TP 1 🎯: $102,000
TP 2 🎯: $97,500
TP 3 🎯: $93,000
🛑 Risk Management:
Stop-Loss: Above recent highs at $111,800 (or adjusted based on your entry)
⚠️ Disclaimer:
Once TP 1 is reached, move stop-loss to breakeven to protect capital and eliminate risk.
TP 3 may never be reached, but it remains part of the plan to capture extended downside if momentum continues.
If no red dot prints, there is no confirmation — be ready to abandon the trade.
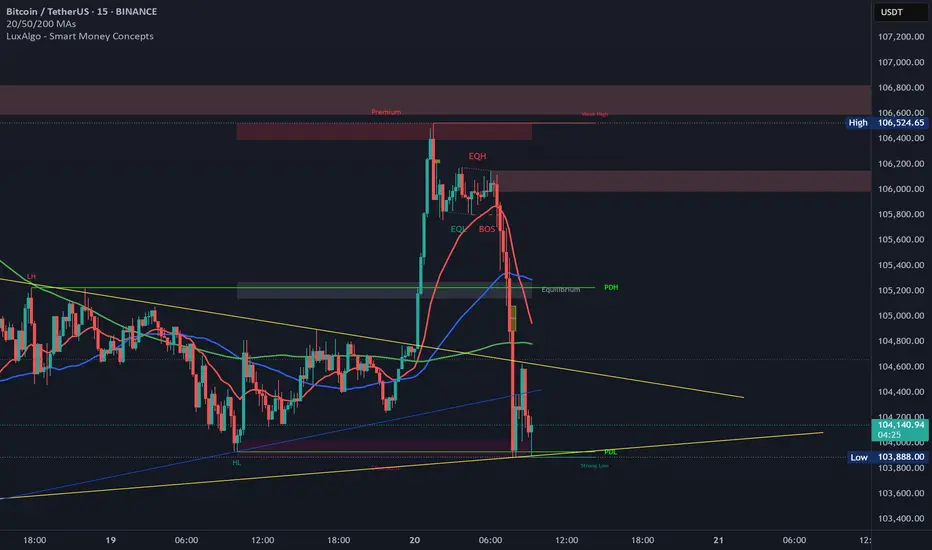
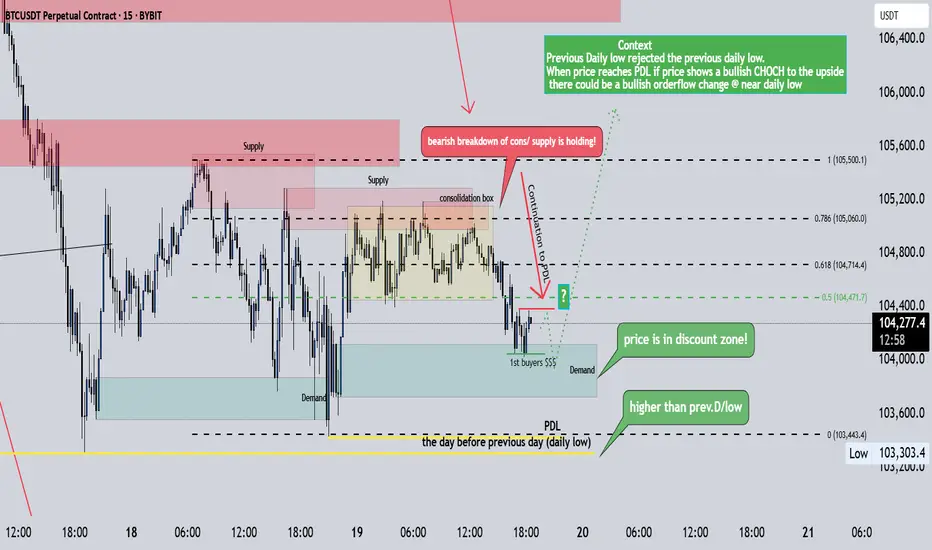
Upon reaching PDL price
Previous Day rejected the previous day's low.
When price reaches PDL if price shows a bullish CHOCH to the upside
there could be a bullish orderflow change @ near previous day low's
Could be a good long entry towards previous day high

The Nature of Zones — Reversals, Continuations, and the FlowWe’ve all heard trading terms like Major Trend and Major Counter-Trend levels. These are zones where price either breaks through and continues (Trend Levels) or sharply reverses (Counter-Trend Levels). In the crypto world, these levels are often separated by enormous gaps, due to the nature of the space — as I’ve mentioned in a previous idea: Crypto Charts Whisper—Are You Listening?
Let’s get one thing clear from the start. These levels are not just thin lines that traders casually draw across a chart. They are zones. So, as a skilled trader, anytime someone mentions support or resistance, keep in mind: interact with these as zones, not levels.
Why? The answer lies in the nature of the candlestick itself. Most support and resistance areas — 99% of the time — are defined by candlesticks such as inverted hammers, shooting stars, etc. For instance, in an uptrend near its peak, you’ll often spot an inverted hammer with a rejection wick that’s at least 25–50% of the candle’s body. The longer the wick, the stronger the rejection. In that sense, the high and the close of that candle form the zone. And what better tool to use for this than the rectangle?
Now, to slowly return to our main point — many of you might’ve noticed that zones often change their nature, especially resistance zones. If you’re experienced, you already know: price tends to go higher by nature. So when a counter-trend zone gets broken and price pushes above it, it shifts — it becomes a trend zone. Later, if price retests it from above, it often turns into support, and with another reversal, it can shift again — becoming a counter-trend zone once more.
But my point goes deeper than what you’ll hear in lessons or YouTube videos. Like I said in another post — A Follow-up to “Adjustments for Better Readings & VSA vs BTC” — if it’s already out there, it’s probably old news.
A skilled trader keeps an open mind — merging everything into one system. And it's part of this oneness mindset that elite traders follow, which I want to share now.
So I ask you:
What if the idea of trend and counter-trend zones didn’t just apply to major levels?
What if this concept applied everywhere on the chart?
For me, this isn’t just a question anymore — it’s a fact. A fact that made me a better trader. I won’t lie — before I got good at this, I failed over and over. But I never quit. That’s not the point though. The point is to expand your vision and train yourself to react just like the elite do.
Take double or triple tops/bottoms — standard or rounded. These formations also act exactly like trend and counter-trend zones. And they stay relevant well into the future. Every level is tested at least twice, from both directions. Maybe not immediately, but eventually — across multiple time frames.
And just like that, a level becomes a major zone for future use — especially if you trade across multiple time frames. So be careful: if you’re only looking at the 1-hour chart, you might miss something important that’s playing out on the 3-minute. And that can trigger psychological discomfort... leading to FOMO — and all the mistakes that come with it.
Also remember — double and triple tops/bottoms are zones, not exact lines. Many traders lose trades by a single tick, just because they forget that rule.
Let’s go a bit deeper now.
Think about all the small highs and lows that appear between those tops and bottoms on a 3-minute chart.
How can they help you trade better? The answer goes back to my previous idea: Location, Location, Location — Consistency and Alignment.
I get it — staying observant 24/7 is hard. That’s why institutions and big players work in teams, in shifts. They’re never alone. You shouldn’t be either.
There’s a lot more that could be said about these levels and zones — how they reveal future trend behavior, a flow! even without indicators or VSA. It has to do with how specific highs and lows behave at certain points in time... but let’s leave that for now.
For the outro, remember this:
The real edge isn’t in indicators.
It’s in your ability to catch the flow of price,
And to read strength or weakness through the simple structures within the zones Big Players create — whether visible or hidden.
A chart isn’t a single truth.
It’s a battlefield of conflicting zones and mixed signals.
If this mindset resonates with you and you want to go deeper — whether it’s building confidence or spotting hidden signals early — I work with a small circle of traders, sharing TA privately every day. Feel free to reach out.
Until next time, be well and trade wisely.

ABC or 12345Just a little deeper to finish the wave count and we're all set. If it stays an ABC, it could mean an expanded flat correction, which wouldn't be good since it would mean we'd go deeper later.

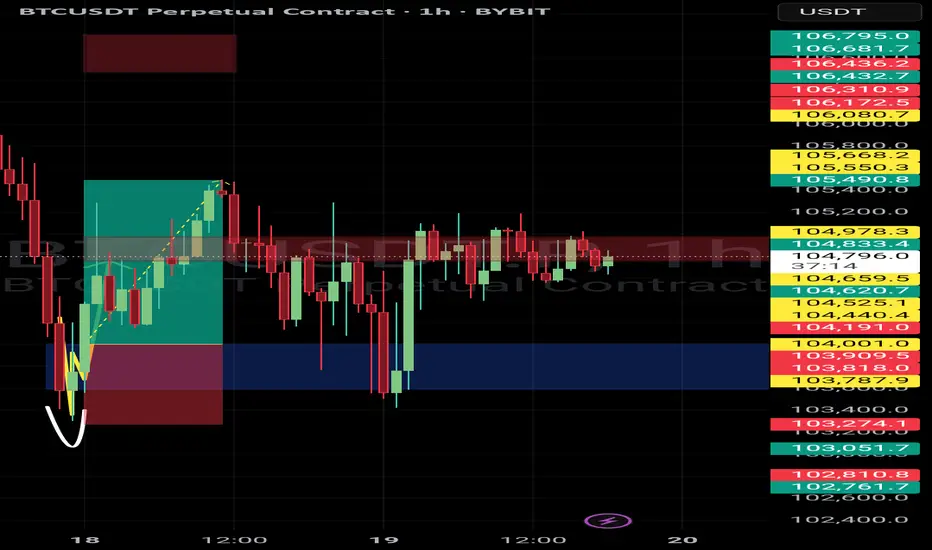
BTC RESPECTING THIS BOXESLast time we had great btc trade
This time play this boxes with good risk management
Possible outcome for $BTCBitcoin Price Analysis: Signs Pointing to a Potential Downtrend
The chart above illustrates a detailed analysis of BTCUSDT (Bitcoin paired with USDT) using Elliott Wave theory and key support/resistance levels. After what appears to be a completed 5-wave bullish cycle, the technical outlook suggests that Bitcoin may be poised for a significant downside correction.
Completion of the Elliott Wave Structure
The chart marks the completion of five distinct waves:
Wave (1) initiated the bullish trend.
Wave (2) represented the first significant pullback.
Wave (3) delivered a strong upward surge, surpassing previous highs.
Wave (4) brought another retracement, finding support near a previous resistance zone.
Wave (5) capped off the structure, reaching above the $100,000 mark before exhibiting signs of exhaustion.
According to Elliott Wave theory, a 5-wave impulse is typically followed by a corrective ABC pattern. The chart suggests that this correction is now underway.
But I think it is trying to create a double top pattern.
Key Levels to Watch
Highlighted on the chart are several crucial horizontal zones:
Near-term resistance: Around $109,600 – $112,000. Bitcoin struggled to maintain momentum above this area and has since started declining.
First major support zone: Around $75,000 – $80,000. This was a former resistance zone during Wave (3) and may now act as support during the early stages of the correction.
Critical support levels: Marked at $54,019, $50,000, and $46,877.5. A break below these levels would indicate a deeper corrective move, potentially aligning with the projected path shown on the chart.
Trendline Break and Bearish Outlook
The yellow upward trendline that supported the entire rally is at risk of being decisively broken. The chart projection shows Bitcoin slicing through this trendline, signaling a shift from a bullish to bearish market structure. If this occurs, it could lead to accelerated selling pressure as confidence in the uptrend erodes.
Projected Price Path
The white arrows in the image depict a scenario where Bitcoin could fall to around $54,000 and possibly as low as the $46,000 region if key supports give way. This represents a significant correction, but one that aligns with historical post-impulse patterns seen in previous Bitcoin cycles.
Conclusion
While Bitcoin has enjoyed an impressive rally culminating above the $100,000 level, technical indicators on this chart point to the increasing likelihood of a sustained downward correction. Traders and investors should monitor the key support levels closely and be prepared for heightened volatility as the market seeks a new equilibrium following this extended bull run.


Bitcoin Ready For Fall Check my levels Hello trader's
Here is the chart level of bitcoin for selling...
So if you want to Know about intrday levels
Comment...

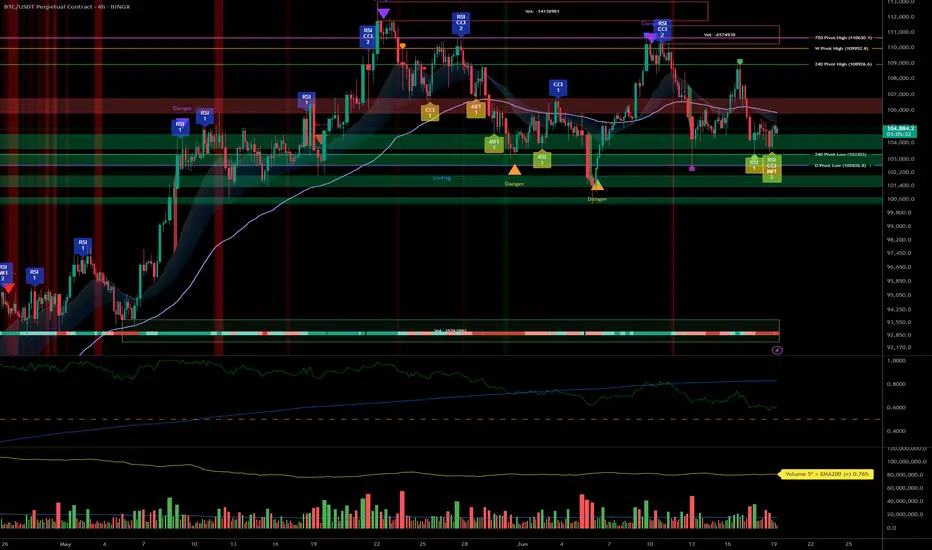
BTC – Bullish bias under review: 102k/103k supports in focus__________________________________________________________________________________
Technical Overview – Summary Points
__________________________________________________________________________________
Momentum : Dominant on all major timeframes (1D, 12H, 6H, 4H). Risk On / Risk Off Indicator signals STRONG BUY except on 15min (neutral).
Support/Resistance : Structurally key pivot zone 102k–106k; major supports 102k/103k. Potential breakout above 106k (swing target 109k).
Volumes : Normal across all timeframes. No excess signals, no accumulation/capitulation peaks.
Multi-TF Behaviors : Horizontal consolidation with bullish dominance. Short-term bearish divergence on 2H–15min, micro-TF in correction only, no panic.
__________________________________________________________________________________
Strategic Summary
__________________________________________________________________________________
Global Bias : Solid bullish structure as long as 102k/103k hold. “Risk On” maintained by sector outperformance.
Opportunities : Entries on pullback/main base 103k–104k; breakouts to watch above 106k.
Risk Zones : Clear invalidation <102k, potential rapid flush to 97k–88k; keep strict stop-loss below 102.5k.
Macro Catalysts : FOMC, Fed projections, Middle East geopolitics keep volatility high, but no shock. Price action leads near-term strategy.
Action Plan : Swing buy on confirmed support, dynamic hedge post-news, monitor volumes/closures on key pivots.
__________________________________________________________________________________
Multi-Timeframe Analysis
__________________________________________________________________________________
1D : Bullish momentum, major supports intact (102k/105k). Risk On / Risk Off Indicator = STRONG BUY, stable volume, no excess. Healthy structure for long swings.
12H : Positive bias, range 102.6k–106k. Risk On / Risk Off Indicator = STRONG BUY.
6H : Presumed accumulation 103k–106k, momentum still strong. No volume weakness.
4H : Range oscillation, structural support test at 103k. Sector outperformance, neutral volume.
2H : First sign of short-term weakness. Divergent with higher TFs but no panic.
1H : Technical rebound towards 104.8k possible as long as 103k support holds.
30min : Short-term trend remains bearish (trend 30min = down). Correction/purge ongoing.
15min : Neutral momentum, supports being tested. No panic or melt-down observed.
Summary : Strong bullish confluence on higher TFs, temporary divergence on micro-TFs. “Range with bullish bias” scenario as long as 102k/103k holds the structure.
__________________________________________________________________________________
Macro and Fundamental Analysis
__________________________________________________________________________________
FED/FOMC (June 18) : Rates unchanged, “data dependent” guidance. Raised volatility but no risk-off shift.
Market Sentiment : BTC technical structure holds, moderate post-FOMC volatility.
S&P500 : Above all key moving averages. Sector momentum (software, uranium, semis) remains dominant.
Energy Level : Weak oil = little macro pressure against BTC.
Geopolitics : Israel–Iran escalation / US posture reinforced. High FX/oil volatility but BTC resilient (>102k), no panic on record.
Economic Calendar : Closely watching BoE & SNB, but low BTC impact odds.
Implications : Post-news phase = ideal for range trading, no rupture event expected within 48h.
__________________________________________________________________________________
Strategic synthesis & R/R guidance
__________________________________________________________________________________
Long on pullback 103–104k, swing targets 106/109k. Optimal R/R (>2.5) if stop 102.5k (D Pivot Low).
Invalidation area : Clean close <102k or heavy downside volume (capitulation via ISPD/volumes).
Risk Management : Dynamic stops, partial hedge post-FOMC during macro volatility.
Conclusion : Bullish structure preserved. Range trading scenario dominant, no extreme signals or panic. Actions: support watch, technical buy on confirmed pullback.
BTC continues to accumulate above 103,500Plan BTC today: 19 June 2025
Related Information:!!!
Bitcoin (BTC) price edges slightly higher, trading near $104,700 at the time of writing on Thursday, after stabilizing above a key level — the 50-day Exponential Moving Average (EMA) at $103,100. A breach below this level could trigger a sharp fall in BTC. Risk aversion could intensify, as reports indicate that US officials are preparing for a strike on Iran in the coming days. Despite this risk-off sentiment in global markets, institutional demand remains strong, with US spot Bitcoin Exchange Traded Funds (ETFs) seeing positive inflows for eight consecutive days
personal opinion:!!!
btc continues to accumulate above 103,500, the market is no longer sensitive to interest rate information yesterday
Important price zone to consider :!!!
support zone : 103.500 \ 101.000
Sustainable trading to beat the market
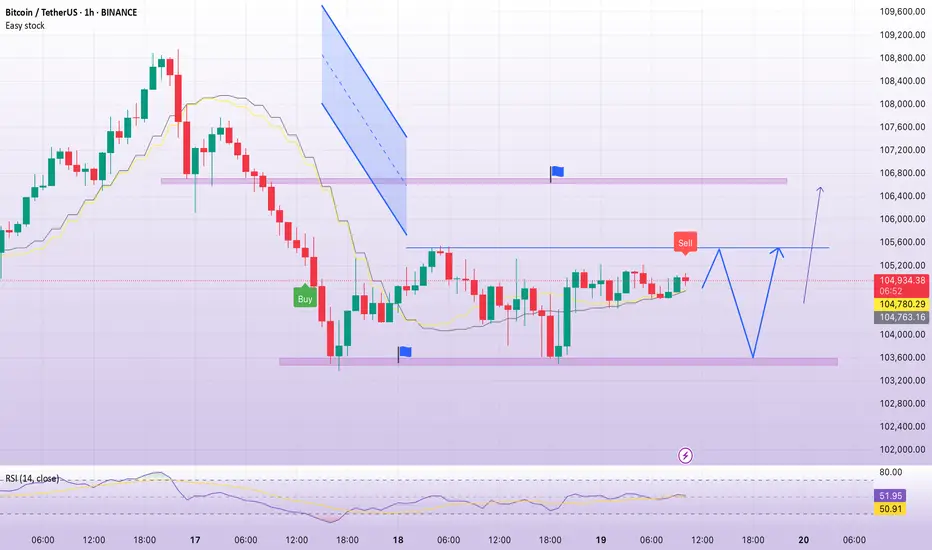
Volume spikes on down moves add to selling pressure.📉 BTCUSDT – 1H Chart Technical Outlook
🔍 Structure Insight:
Bitcoin is currently trading within a descending channel, forming lower highs and lower lows, indicating persistent bearish pressure. Price action appears compressed between key trendlines, hinting at an imminent breakout.
---
🔻 Scenario 1: Bearish Breakdown (Primary Bias)
If BTC fails to hold above the lower boundary of the range, a decisive break below could trigger a sharp move toward the 103,650–103,000 demand zone. The structure supports continuation to the downside if the price rejects resistance again.
🧊 Bearish Confluence:
Price is unable to break above dynamic resistance.
Momentum remains weak near the mid-range.
Volume spikes on down moves add to selling pressure.
---
🔼 Scenario 2: Bullish Breakout (Alternative View)
A breakout above the descending trendline and confirmation candle could flip bias short-term bullish. This would target the 105,400+ region as the next liquidity area.
⚡ Bullish Signs to Watch:
Break and retest above trendline resistance.
Bullish engulfing or breakout candle with volume.
---
🔍 Key Levels to Monitor
Support: 103,650 / 103,000
Resistance: 105,000 / 105,400
Breakout Zones: Watch for clean breaks and retests outside the wedge pattern.
---
📌 Conclusion:
BTC is coiling within a tightening range. The breakout direction will likely dictate the next short-term trend. Maintain flexibility — breakout confirmation is key before positioning.
🚨 Not financial advice — always DYOR before trading!
