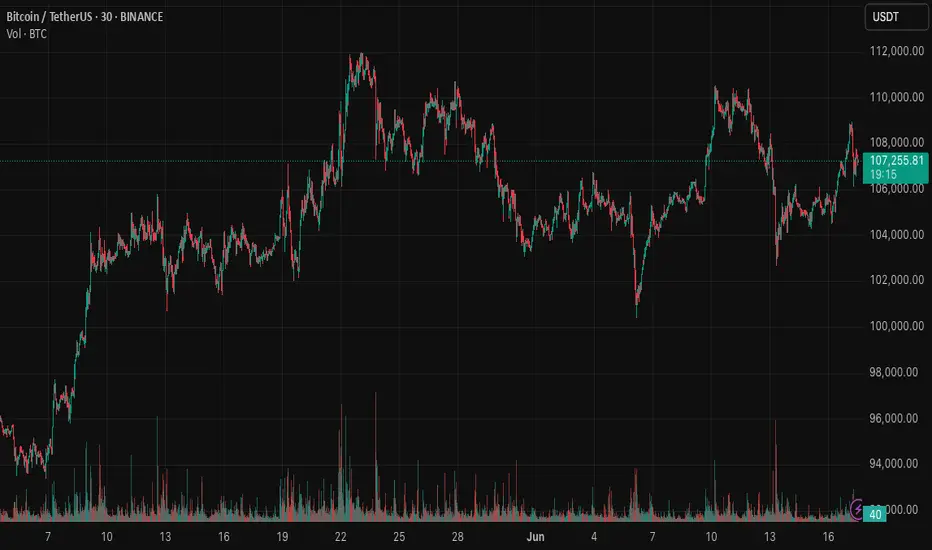
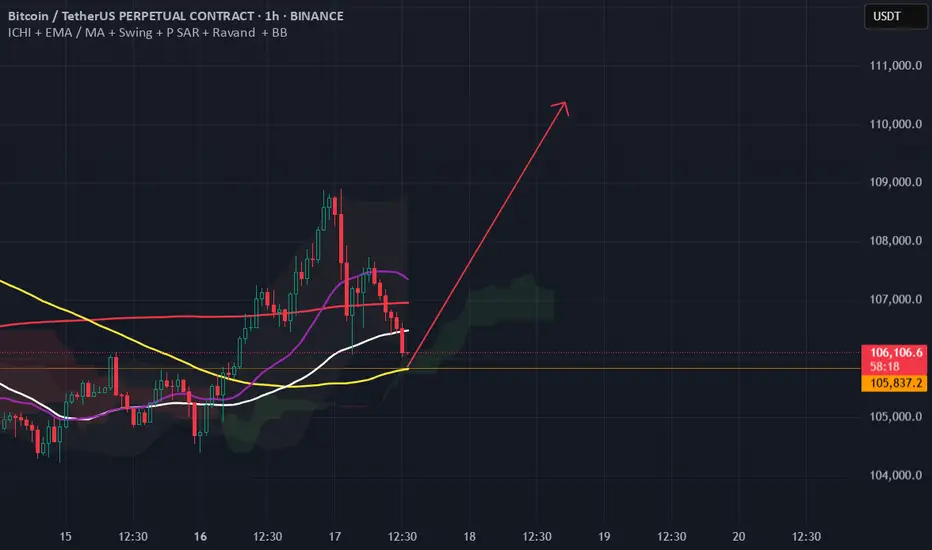
Bitcoin buy ideaBitcoin (BTCUSD) had a challenging week of consolidation, but it remains stable above $100,000 despite losing some weekly gains. On the 4-hour chart, demand is holding above $102,000. With the Fed maintaining interest rates at 4.50%, if Bitcoin consolidates above $102,000-$103,000, we could see short-to-mid-term growth towards $106,000-$110,000.
BTCUSDT.3S trade ideas

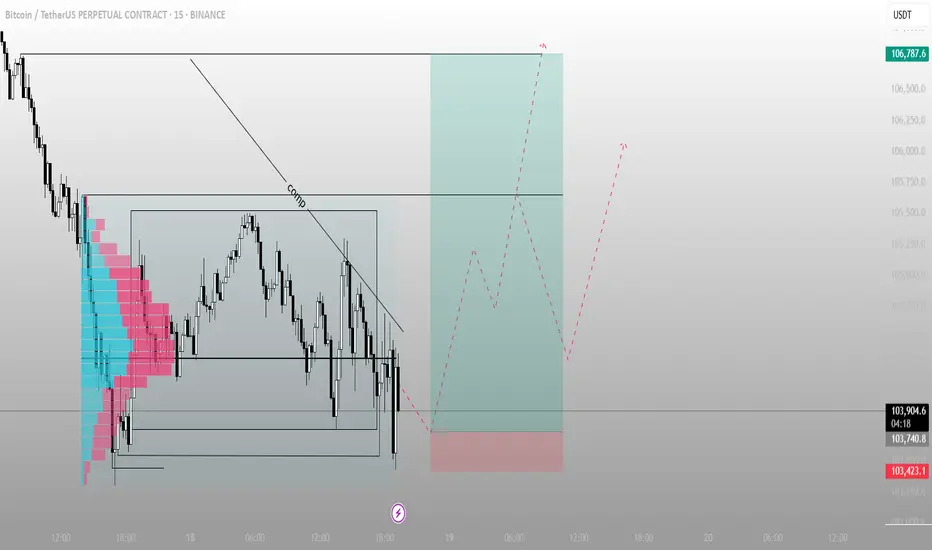
BTC – Stop Hunt at the Edge of ValueThis is what a liquidity raid looks like.
Price just swept the bottom of the range, tapped into the low-volume zone (as seen on the volume profile), and reclaimed — classic sign of a trap sprung.
Key points:
The downtrend line labeled “comp” = compression — bulls forced to capitulate into a thin zone
High probability deviation with stop run and reclaim — this fuels the next move up
The green box shows risk-defined entry off the sweep low
Targeting the prior high: 106,787
Volume imbalance filled = no inefficiency above — price can now move cleanly
Execution mindset:
Trap spring → retrace into structure → expansion
Risk is clear, liquidity is engineered, structure remains
Late shorts just became the fuel.
Watch the reclaim of the box top. If that flips support, we ride momentum.
📈 For more setups like this — including pre-breakout traps — check the description in the profile.
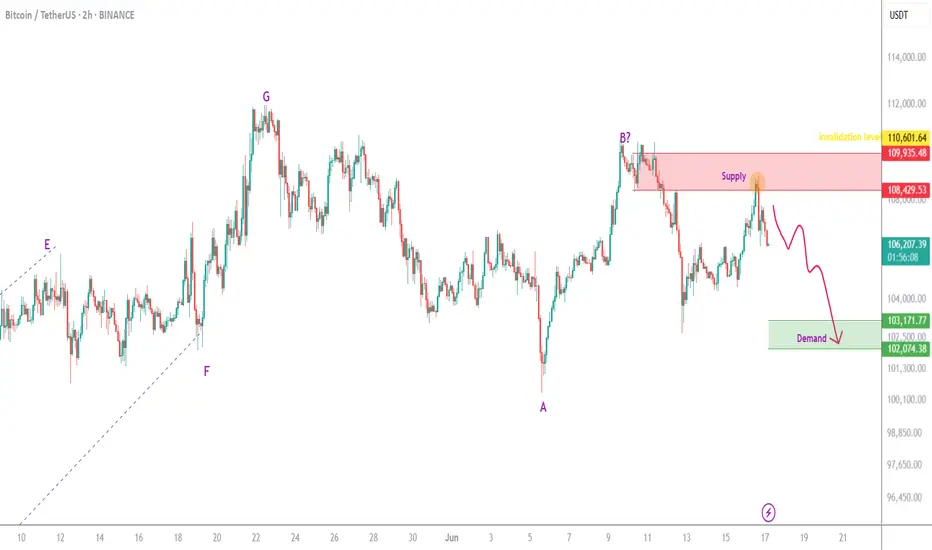
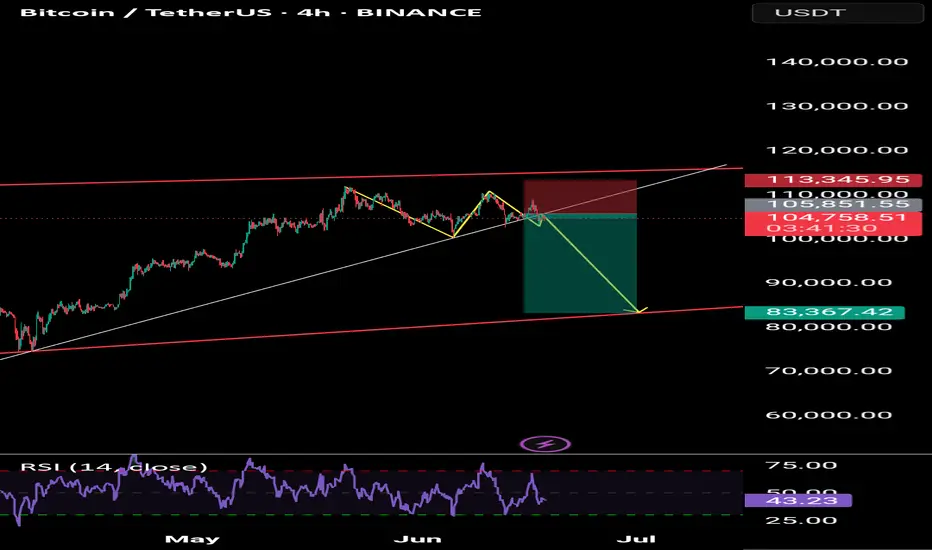
BTC is still bearishThe red zone seems to have had enough orders to reject the price downward. It is expected that the price will drop at least to the green zone below.
There will be some fluctuations along the way.
A daily candle closing above the invalidation level would invalidate this analysis.
BTC: Scalp Long 18/06/25Trade Direction:
Long BTC Scalp BINANCE:BTCUSDT.P
Risk Management:
- Risk 0.1% (very low risk due to market conditions)
- Target approx 0.5% gain
Reason for Entry:
- 0.618 retracement
- Sweep of recent low
- M30 Fair Value Gap tapped (partially mitigated earlier)
- Multi time frame Oversold
- Market structure holding key support level
Additional Notes:
- Confidence level low low likely hood this succeeds but trading my plan
- Very cautious trade in a volatile unpredictable market environment

Everybody is trying to sell due too todays news No one want too risk trading today whiles news are inbound for today

My thoughts on Bitcoin long-term, as well as mid- to short-termLONG-TERM / THE BIG PICTURE:
Regarding the big picture, we couldn’t be more bullish. We’re currently fighting our way through the cycle as usual—despite the fact that this cycle has had way too many chop phases, flushing out far too many participants.
Just a few weeks ago, we got our bullish crossover on the weekly MACD—a signal that has triggered a major BTC rally every single time this cycle.
At no point in this cycle has #BTC been overheated. The blow-off top is still coming.
LOCAL PRICE ACTION:
CRYPTOCAP:BTC remains in this vertical ascending channel and remains macro bullish what imo is another huge re-accumulation range lasting more than 200 days since November, that will lead to an impulsive breakout TO THE UPSIDE in the weeks to come
MACRO LANDSCAPE:
Due the last crash we potentially got an bulllish structure, wich if the price breaks the high at $110.000 is confiraed and can bring us to 120k on #Bitcoin
On the lower TF we currently see an oversold RSI + a bounce from the 0.667 level
RECOMMENDATION:
Watch the high at 110k and the low at 100k, we have to break either one of these 2 levels.
Have an eye on the current conflict with israel & iran and dont forget the FOMC meeting tmwr, where we can expect some important news due the current situation
Either way, I'm long and mid-term bullish despite the current accumulation by long-term holders (which just peaked)...
Always watch the big picture from above - maintain perspective and don't focus too much on smaller timeframes...
But most importantly: Survive.
Thanks for reading, let me know your thoughts about the current market situation & price action👇
Bitcoin sell short go 83kBitcoin is ready for a heavy drop, just sell.
Do not take any buy or sell trades.
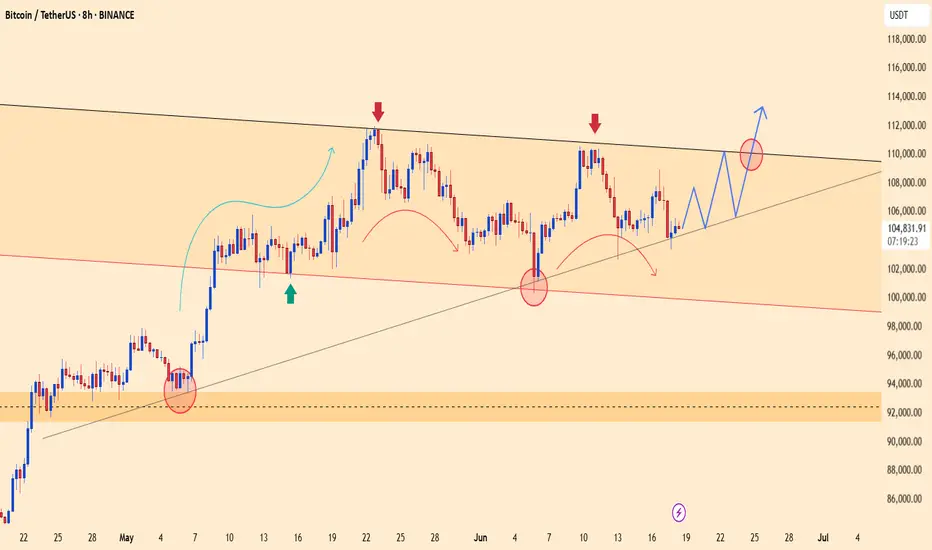
BTCUSDT – Price Poised to Break Descending ChannelBTCUSDT has been maintaining a series of higher lows since early May, consistently rebounding from its dynamic support trendline. Currently, the price is consolidating just below the descending channel resistance around the 108,000 USDT level. A clear double-bottom pattern accompanied by solid recovery momentum suggests a potential breakout from the prolonged correction phase that has persisted throughout June.
If BTC breaks above the descending trendline, the next target could be the major resistance zone near 113,000 USDT.
On the news front, the market is reacting positively to BlackRock’s announcement of expanding investment in crypto ETF products. At the same time, recent soft U.S. inflation data has strengthened expectations that the Fed may halt its tightening cycle. This combination is improving investor sentiment and driving renewed interest in risk assets like Bitcoin.
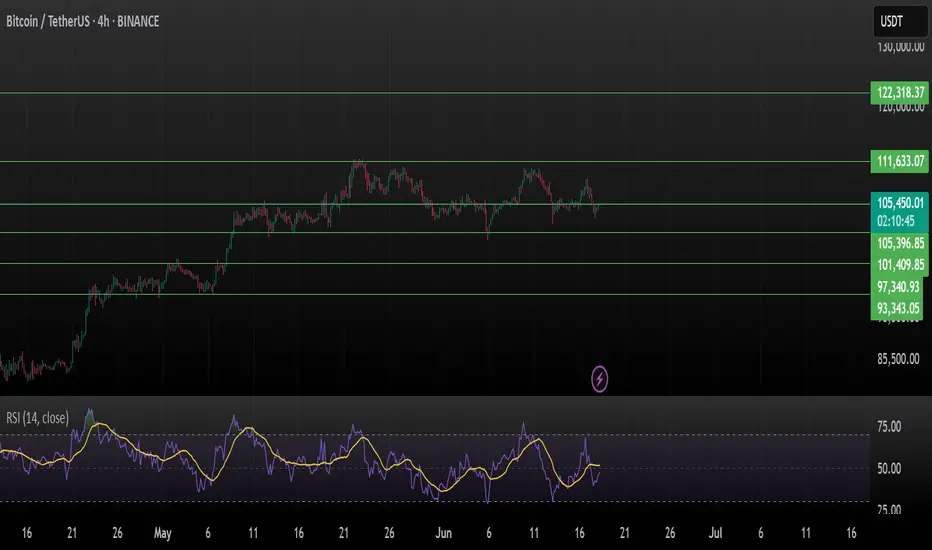
Bitcoin (BTCUSDT) 4H AnalysisBitcoin is currently consolidating around $105,523 after a strong rally and forming a short-term sideways structure. It is still unable to break the immediate resistance of $ 111 K.
Key Technical Observations:
BTC has been ranging between $101,409 and $105,523
RSI at ~51.38 indicates a neutral zone, signaling indecision in momentum
Support holding at $105,396, but price action is flat
Bulls need to reclaim $111,633 to regain momentum
Major Levels to Watch:
Resistance: $111,633 → $122,318
Support: $105,396 → $101,409 → $97,340 → $93,343
A break above $111,633 could trigger bullish continuation, while a fall below $101,409 might open the path to deeper support zones.
Patience is key — wait for breakout confirmation before making moves.
This is not financial advice. Always DYOR and manage risk.
Like, share & comment if you find this analysis helpful!
#Bitcoin #BTC #BTCUSDT
Test the crucial round-number threshold of $100,000.Affected by sudden news factors, the Bitcoin market has seen sharp fluctuations. The price started a significant downward trend from the $108,900 level and has dropped to around $104,000 as of now. This decline has caused Bitcoin to break through multiple key support levels.
On the daily timeframe, the originally important support range of $106,000 - $107,000 was easily breached, with market bearish forces gaining absolute dominance. Bitcoin is facing significant downward risks and is highly likely to continue falling to test the crucial psychological level of $100,000.
you are currently struggling with losses,or are unsure which of the numerous trading strategies to follow,You have the option to join our VIP program. I will assist you and provide you with accurate trading signals, enabling you to navigate the financial markets with greater confidence and potentially achieve optimal trading results.
Trading Strategy:
sell@104000-104500
TP:102000-1025000

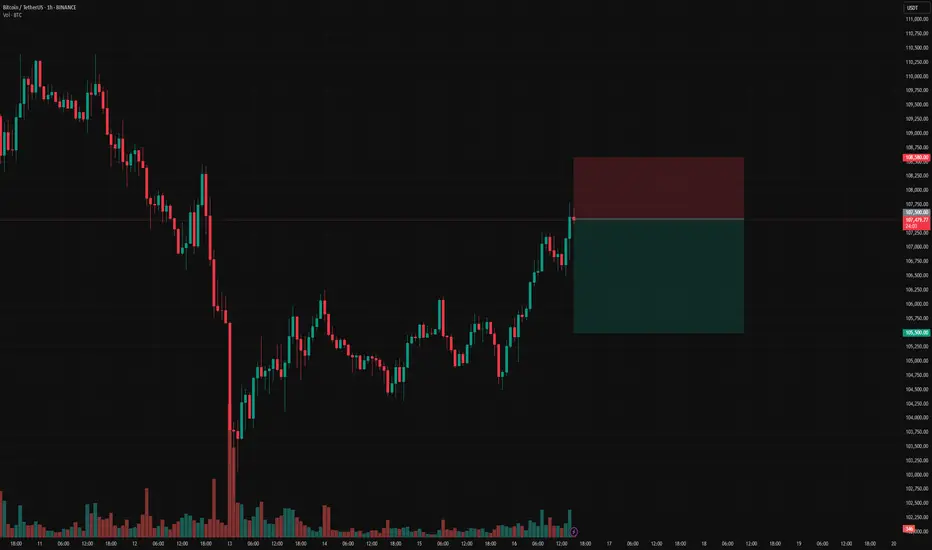
BTCUSDT ShortSet-up: Fade breakouts inside 2‑day 1 % VWAP band
Entry: $107 k‑$107.5 k
Stop: 0.5% -> 108k
Target: Re‑enter VWAP mean $105.5 k
R:R: 3:1
BTC POC, Golden Pocket, S1, FVG confluence @ 105kBTC POC, Golden Pocket, S1, FVG confluence @105k
Nice confluence here for a bounce. I would take profit quickly though with bearish momentum still strong.
BTC - AnalysisWe’re currently back at the short-term trend reversal zone,
which has been reactivated after price moved 3% away from it.
The zone itself spans 1.6%, so a new reaction from this level is likely.
If the bottom at $102,500 holds,
we’ve activated a valid bullish structure that could take us up to the $119,000 target zone —
which also overlaps with a weekly target region.
We’ll see what the next few days bring...
Key events to watch right now:
1️⃣ Israel & Iran – Will the conflict escalate or calm down?
2️⃣ Tomorrow’s FOMC meeting – Will QT be addressed?
Feel free to drop any questions or feedback —
I’ll read and respond to everything.
LFG 🚀

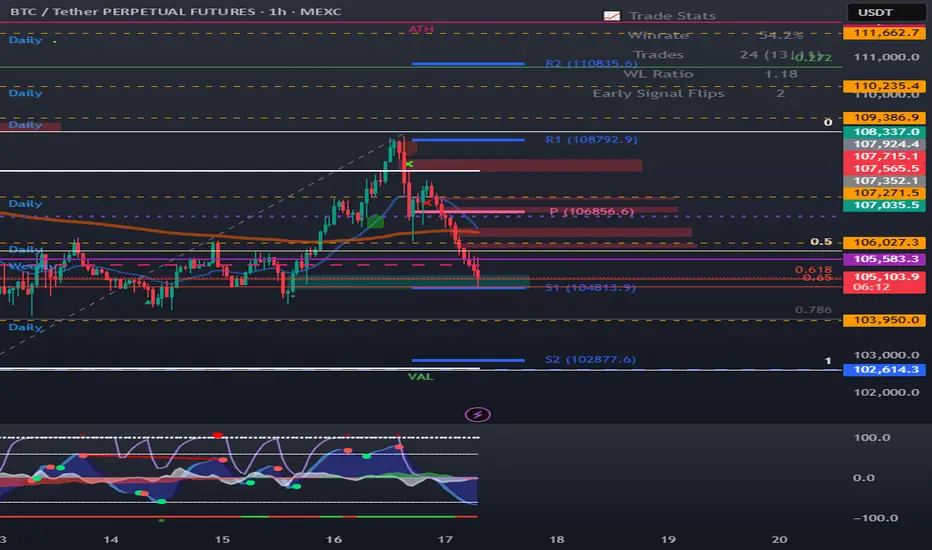
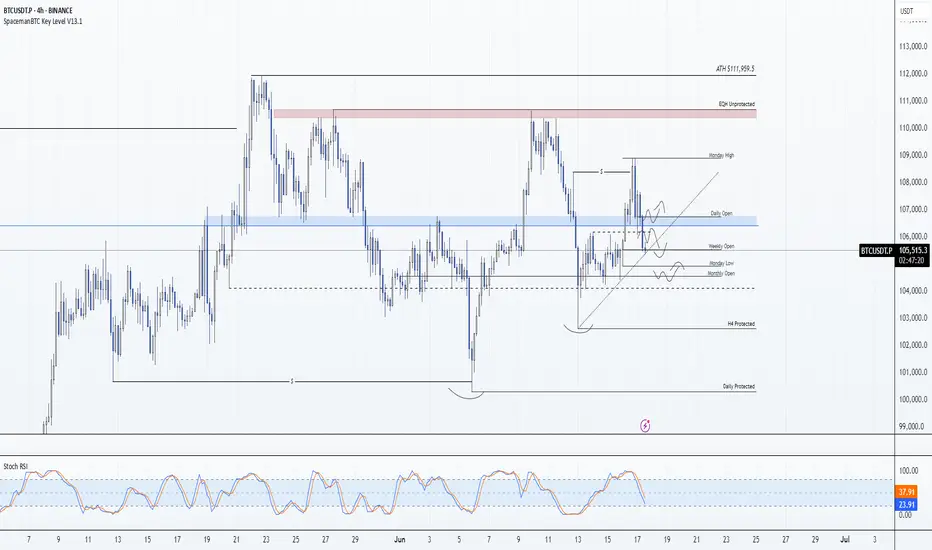
BTC Bias Map: 17/06/25Daily Bias Map:
- Bitcoin lost key support at 106,500
- I am leaning more bearish now that this key support is lost.
- Market is heavily driven by news and uncertainty.
- Key levels like Monday low and monthly low cluster in the same region — likely last bastions of support.
- Expecting a possible larger shakeout toward weak lows nearby, which don’t look appealing for entries.
- Will watch for potential long scalp triggers around monthly open or Monday low but will likely stay side-lined. Unless I see a potential good short setup form.
- With FOMC news tomorrow I’m avoiding heavy involvement the risk is not worth it in this volatile environment.
Discipline means knowing when to step back. In all likelihood I'll let the market develop today unless a extremely clean trade develops.
BTC accumulates above 104,300 zonePlan BTC today: 17 June 2025
Related Information:!!!
Bitcoin (BTC) price falls to around $106,000 at the time of writing on Tuesday following a mild recovery the previous day. The decline comes as investors continue to digest the escalation of the Iran-Israel conflict and after US President Donald Trump highlighted concerns and asked his security advisors to meet in the Situation Room. While institutional interest in Bitcoin remains robust, any further escalation in the Middle East could impact global risk assets.
The US steps in to resolve the Iran-Israel war
Bitcoin price action remained broadly resilient on Monday despite escalating tensions in the Middle East. The four-day-old war between Israel and Iran, which began on Friday, has so far failed to trigger a sharp correction. The largest cryptocurrency by market capitalization held above its key psychological threshold of 100,000 despite the initial shock — a contrast to April last year, when BTC fell more than 8% amid similar Iran-Israel turmoil.
The New York Times reported on Monday that US President Donald Trump has encouraged Vice President JD Vance and his Middle East envoy, Steve Witkoff, to offer to meet with the Iranians this week.
personal opinion:!!!
Gold price continues sideways and accumulates in 2 trend lines, support 104,300
Important price zone to consider :!!!
support zone : 104.300 - 104.100
Sustainable trading to beat the market
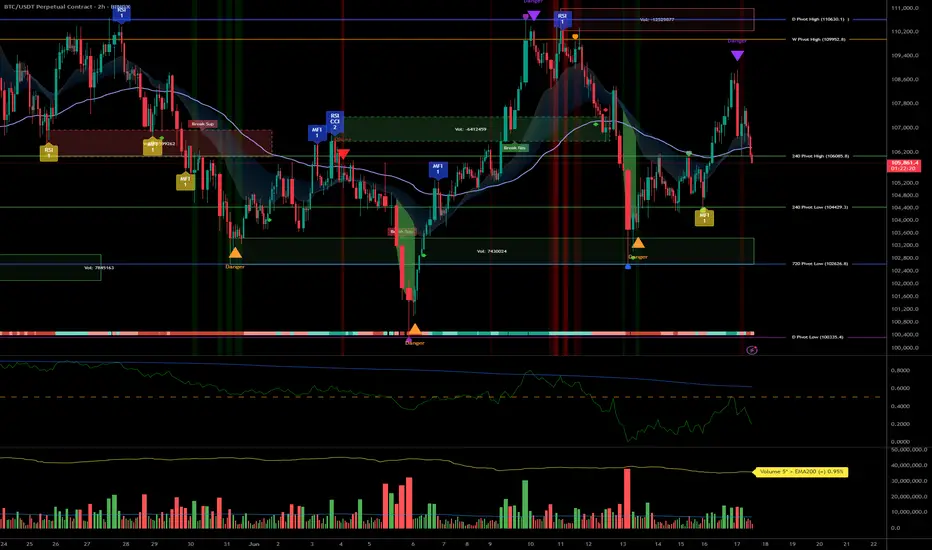
Bitcoin Multiframe: Key clusters to watch before FOMC__________________________________________________________________________________
Technical Overview – Summary Points
__________________________________________________________________________________
Momentum: Dominant bullish structure across all major timeframes (MTFTI = Up).
Supports/Resistances: No HTF pivot engaged; key on-chain support at $97.6k, resistance at $115.4k.
Volume: Central oscillation within range; no major surges observed, consolidation on micro-TF.
Multi-timeframe behaviors: Bullish structure dominates, technical pullback on 4H-1H-15min without major breaks.
__________________________________________________________________________________
Strategic Summary
__________________________________________________________________________________
Overall Bias: Structurally bullish as long as key supports hold (97.6k–104.5k zone).
Opportunities: Buy confirmed dips on on-chain cluster/H4-H2 area, target 110–115k extension post-FOMC positive catalyst.
Risk zones: Extreme volatility expected around FOMC (June 17–18); strict risk management, avoid overexposure.
Macro catalysts: FOMC (rate decision, dot plot), Fed leadership stability, Israel-Iran geopolitical tensions.
Action plan: Patience until FOMC; favor setups on clear price reaction, tight stops below 97.5k (on-chain support).
__________________________________________________________________________________
Multi-Timeframe Analysis
__________________________________________________________________________________
1D: Bullish momentum, price at range center ($106k). Watch for pivot break.
12H: Persistent bullish bias, confluence with 1D.
6H: Expected consolidation, bullish structure.
4H: Technical pullback, bullish structure remains. Key anticipated support 105k–104.5k.
2H: Likely move towards lower range. Up bias confirmed.
1H: Technical correction within overall Up trend.
30min/15min: Seller sequence, trend intact, no major break.
Risk On / Risk Off Indicator remains “Up” across all frames, boosting the positive view despite short-term correction.
Executive summary:
Strong bullish convergence from Daily → 15min timeframes.
Ongoing short-term pullback, no HTF pivot breaks.
Any break below $97.6k would invalidate the swing bullish scenario.
__________________________________________________________________________________
Macro, Economic Calendar, On-chain & Risk Management
__________________________________________________________________________________
Macro:
FOMC imminent (June 17–18): waiting – volatility on rate/dot plot.
Geopolitical risk (Iran-Israel): sustained global risk-off may escalate.
BTC shows strong resilience at 106k.
Economic calendar (key points):
June 17–18: FOMC — maximum impact (stocks, FX, crypto)
June 17: Fed leadership rumors — potential volatility, BTC stable
June 17, 08:30 UTC: USA — retail sales (May/core)
On-chain:
Key support at $97.6k (STH cost basis), resistance at $115.4k.
Long-term holders are distributing, but bullish accumulation pressure intact.
Clustering may amplify short-term directional moves.
Key scenarios:
Bullish: Extension to 110–115k if FOMC positive, stop below 97.6k.
Bearish: Break of 97.6k = risk of drop towards 92.9–95.4k.
Management: Avoid exposure pre-FOMC, active monitoring, strict stops.
Patience & discipline: Only size up with post-FOMC validated reaction or confirmed breakout. On-chain cluster = invalidation radar for bullish bias.
__________________________________________________________________________________
BTCUSDTHi . after a crash market because of war , we can get big gain of this chance , MA 100 in 1h can hold and Reverse move to 110300$ . #BTC LONG Limit buy : 105800$ , Lev : 100x , SL : 105500$ , Target : 110300$
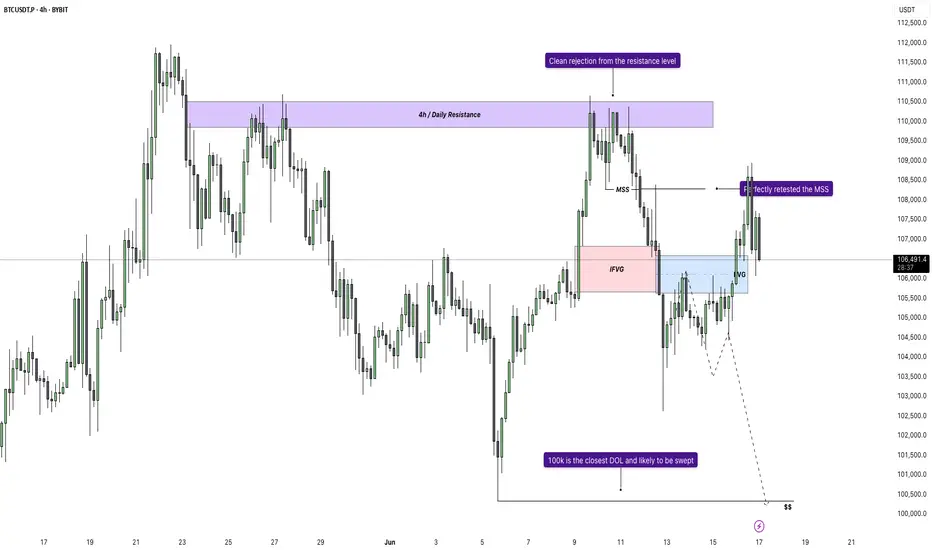
Bitcoin - Bears vs Bulls: $100k next?Price recently tapped into a well-defined 4H and daily resistance zone and was met with an immediate rejection. That rejection wasn’t just a reaction, it led to a confirmed market structure shift as price broke the previous low. This transition from higher highs to a lower low signals the first sign of bearish control, flipping the short-term bias and setting the tone for a move lower.
Retest of MSS and Inversion Fair Value Gap
After the break in structure, price retraced directly into the origin of the move, retesting the same zone where the shift occurred. A previously bullish 4H gap has now flipped into resistance, rejecting price perfectly. This inversion, where a bullish imbalance turns into a bearish reaction zone, confirms the change in direction and strengthens the downside narrative.
New FVG as Entry Opportunity
The latest bearish impulse created a clean new fair value gap just above current price. A retest of this gap would offer a high-probability continuation setup, as it aligns with both recent structure and order flow. This zone becomes the critical level for bears to defend, and unless price reclaims it, the expectation remains for continuation toward lower liquidity.
Liquidity Outlook and Bearish Target
Below current price, a large pool of liquidity is sitting just above a major psychological round number. That level hasn’t been swept yet and is a likely downside magnet. With no meaningful support between the current FVG and that draw on liquidity, price is likely to reach for it next. This fits the typical sequence following a market structure shift: rejection, shift, retest, continuation, and liquidity sweep.
Momentum and Contextual Confluence
Zooming out slightly, the current move fits within broader bearish momentum that has been developing across timeframes. There’s no sign of strong bullish absorption, and each push higher has been met with efficient selling. This isn’t a chaotic breakdown, but a controlled sequence of lower highs and lower lows, supported by clean structural shifts and consistent rejection zones.
Conclusion
The chart tells a clear story. A clean rejection from a key resistance zone led to a confirmed bearish structure shift, followed by a textbook retest and fresh fair value gap. As long as price remains below that gap, the setup favors continuation lower, with the nearest liquidity pool being the most likely draw. This remains a high-probability bearish scenario until proven otherwise by a shift back above invalidation levels.
___________________________________
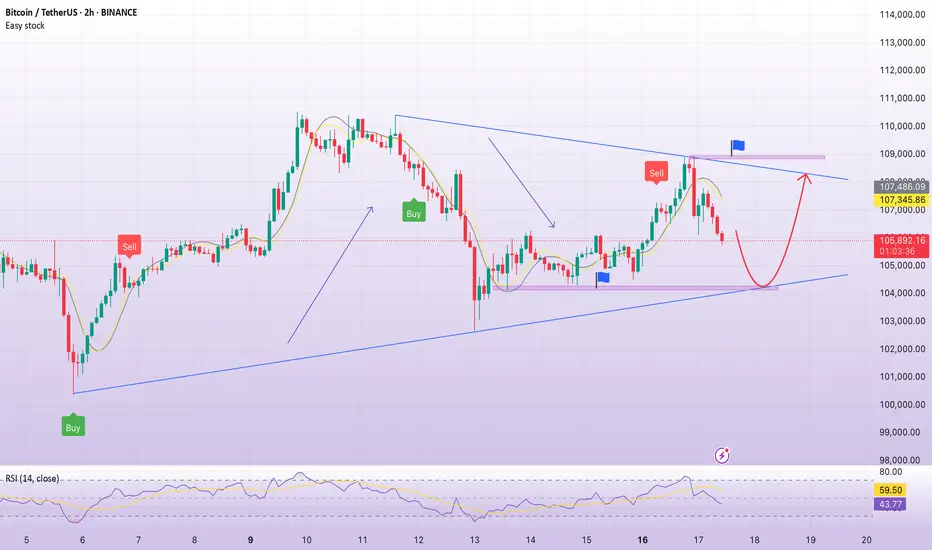
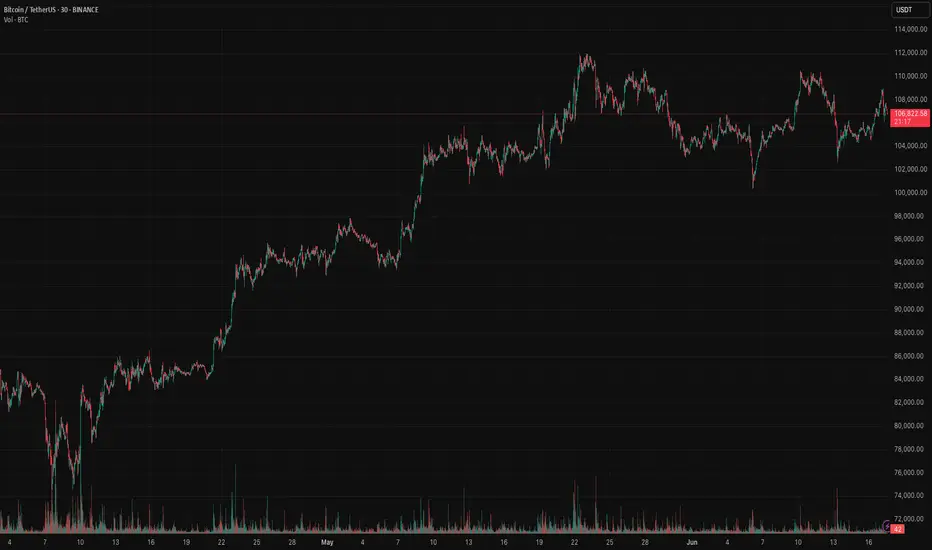
bitcoin oh bitcoinBitcoin has been pumping in the past few days pretty massively. Why? There are 2 main reasons - the first reason is that Bitcoin has finished a major WXY corrective wave, and the second is that Bitcoin swept liquidity below a triangle (see my previous post for details). That was a very good opportunity to buy/long Bitcoin at that specific level I described in the previous analysis. But let's focus on the present and future!
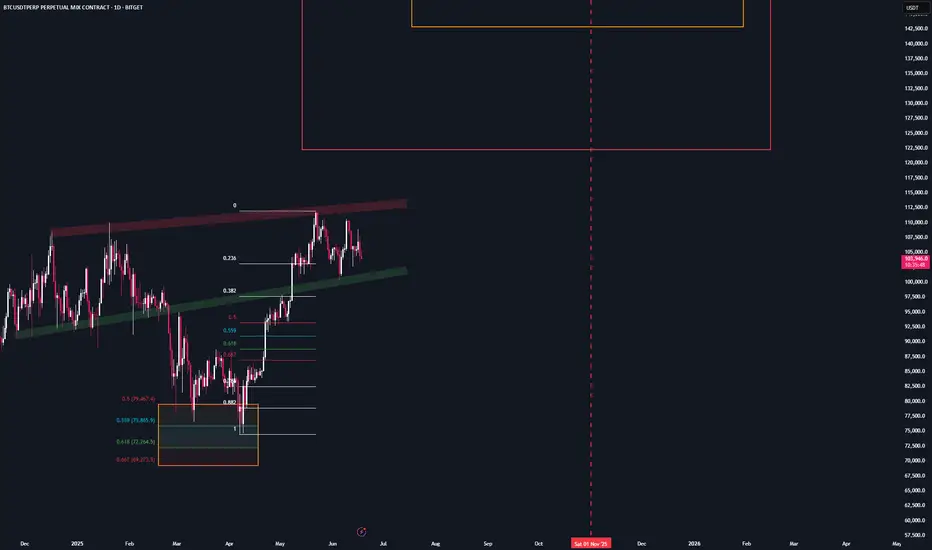
We always want to find strong levels on the charts so we have a great entry point/take profit target. The next strong level is definitely the 0.618 FIB, which Bitcoin can hit in the very short term. Also, below the 0.618 FIB, we have a strong horizontal zone, which can also act as a strong resistance. Bitcoin should definitely go there and retest this zone.
We want to see how Bitcoin is going to react in the zone and FIB, but you can create a new limit order to short Bitcoin there so you don't miss anything. So currently I am temporarily bullish on Bitcoin, and in the next update I will make a big analysis on Bitcoin and a very likely scenario for the next months. What will the price of Bitcoin be in December? Please like/boost my idea right now.
Write a comment with your altcoin + hit the like button, and I will make an analysis for you in response. Trading is not hard if you have a good coach! This is not a trade setup, as there is no stop-loss or profit target. I share my trades pri
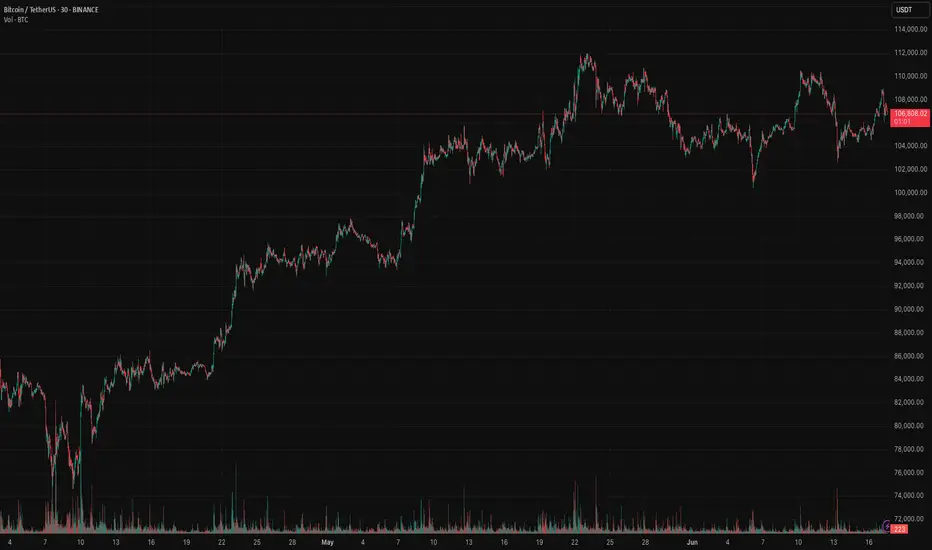
bitcoin is hotBitcoin has been pumping in the past few days pretty massively. Why? There are 2 main reasons - the first reason is that Bitcoin has finished a major WXY corrective wave, and the second is that Bitcoin swept liquidity below a triangle (see my previous post for details). That was a very good opportunity to buy/long Bitcoin at that specific level I described in the previous analysis. But let's focus on the present and future!
We always want to find strong levels on the charts so we have a great entry point/take profit target. The next strong level is definitely the 0.618 FIB, which Bitcoin can hit in the very short term. Also, below the 0.618 FIB, we have a strong horizontal zone, which can also act as a strong resistance. Bitcoin should definitely go there and retest this zone.
We want to see how Bitcoin is going to react in the zone and FIB, but you can create a new limit order to short Bitcoin there so you don't miss anything. So currently I am temporarily bullish on Bitcoin, and in the next update I will make a big analysis on Bitcoin and a very likely scenario for the next months. What will the price of Bitcoin be in December? Please like/boost my idea right now.
Write a comment with your altcoin + hit the like button, and I will make an analysis for you in response. Trading is not hard if you have a good coach! This is not a trade setup, as there is no stop-loss or profit target. I share my trades privately. Thank you, and I wish you successful trades!
bitcoin testing waterBitcoin has been pumping in the past few days pretty massively. Why? There are 2 main reasons - the first reason is that Bitcoin has finished a major WXY corrective wave, and the second is that Bitcoin swept liquidity below a triangle (see my previous post for details). That was a very good opportunity to buy/long Bitcoin at that specific level I described in the previous analysis. But let's focus on the present and future!
We always want to find strong levels on the charts so we have a great entry point/take profit target. The next strong level is definitely the 0.618 FIB, which Bitcoin can hit in the very short term. Also, below the 0.618 FIB, we have a strong horizontal zone, which can also act as a strong resistance. Bitcoin should definitely go there and retest this zone.
We want to see how Bitcoin is going to react in the zone and FIB, but you can create a new limit order to short Bitcoin there so you don't miss anything. So currently I am temporarily bullish on Bitcoin, and in the next update I will make a big analysis on Bitcoin and a very likely scenario for the next months. What will the price of Bitcoin be in December? Please like/boost my idea right now.
Write a comment with your altcoin + hit the like button, and I will make an analysis for you in response. Trading is not hard if you have a good coach! This is not a trade setup, as there is no stop-loss or profit target. I share my trades privately. Thank you, and I wish you successful trades!

bitcoin is coolBitcoin has been pumping in the past few days pretty massively. Why? There are 2 main reasons - the first reason is that Bitcoin has finished a major WXY corrective wave, and the second is that Bitcoin swept liquidity below a triangle (see my previous post for details). That was a very good opportunity to buy/long Bitcoin at that specific level I described in the previous analysis. But let's focus on the present and future!
We always want to find strong levels on the charts so we have a great entry point/take profit target. The next strong level is definitely the 0.618 FIB, which Bitcoin can hit in the very short term. Also, below the 0.618 FIB, we have a strong horizontal zone, which can also act as a strong resistance. Bitcoin should definitely go there and retest this zone.
We want to see how Bitcoin is going to react in the zone and FIB, but you can create a new limit order to short Bitcoin there so you don't miss anything. So currently I am temporarily bullish on Bitcoin, and in the next update I will make a big analysis on Bitcoin and a very likely scenario for the next months. What will the price of Bitcoin be in December? Please like/boost my idea right now.
Write a comment with your altcoin + hit the like button, and I will make an analysis for you in response. Trading is not hard if you have a good coach! This is not a trade setup, as there is no stop-loss or profit target. I share my trades privately. Thank you, and I wish you successful trades!

bitcoin is going crazyBitcoin has been pumping in the past few days pretty massively. Why? There are 2 main reasons - the first reason is that Bitcoin has finished a major WXY corrective wave, and the second is that Bitcoin swept liquidity below a triangle (see my previous post for details). That was a very good opportunity to buy/long Bitcoin at that specific level I described in the previous analysis. But let's focus on the present and future!
We always want to find strong levels on the charts so we have a great entry point/take profit target. The next strong level is definitely the 0.618 FIB, which Bitcoin can hit in the very short term. Also, below the 0.618 FIB, we have a strong horizontal zone, which can also act as a strong resistance. Bitcoin should definitely go there and retest this zone.
We want to see how Bitcoin is going to react in the zone and FIB, but you can create a new limit order to short Bitcoin there so you don't miss anything. So currently I am temporarily bullish on Bitcoin, and in the next update I will make a big analysis on Bitcoin and a very likely scenario for the next months. What will the price of Bitcoin be in December? Please like/boost my idea right now.
Write a comment with your altcoin + hit the like button, and I will make an analysis for you in response. Trading is not hard if you have a good coach! This is not a trade setup, as there is no stop-loss or profit target. I share my trades privately. Thank you, and I wish you successful trades!
7 days ago
Note
Bitcoin hit my profit target of 0.618 FIB and continues to the upside. It looks like we are going to hit 109,000 USD in the short term, which is a very strong resistance! Middle of the previous big range, so prepare for a bounce here.