BTC VAH, Golden pocket, R3, confluence resistance at 108kBTC VAH, Golden pocket, R3, confluence resistance at 108k
We had a nice up move but now hitting a confluence of resistance. I'm looking for shorts for the correction before moving up again.
Looking at bearish divergence on smaller time frames for entry.
BTCUSDT.3S trade ideas

POC, Daily, Golden Pocket, S1 confluence support @ 104000POC, Daily, Golden Pocket, S1 confluence support @ 104000
Very strong support here. I'm putting a limit order anticipating a quick bounce.

BTC-----Buy around 107500, target 108000-109000 areaTechnical analysis of BTC on June 16:
Today, the general trend is still relatively obvious, so the trading strategy is to buy at a low price.
Today's BTC short-term contract trading strategy:
Buy in the 107500 area, stop loss in the 106500 area, and target the 108000-109000 area;

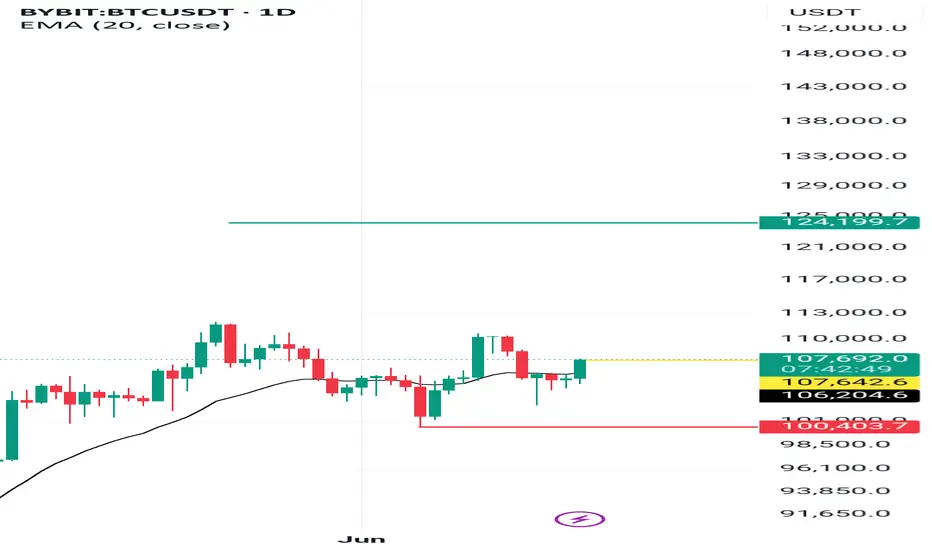
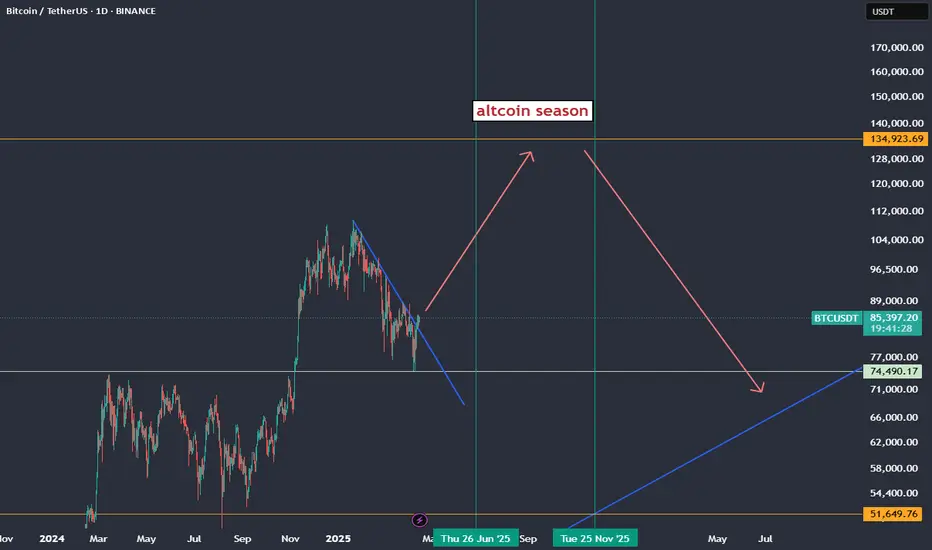
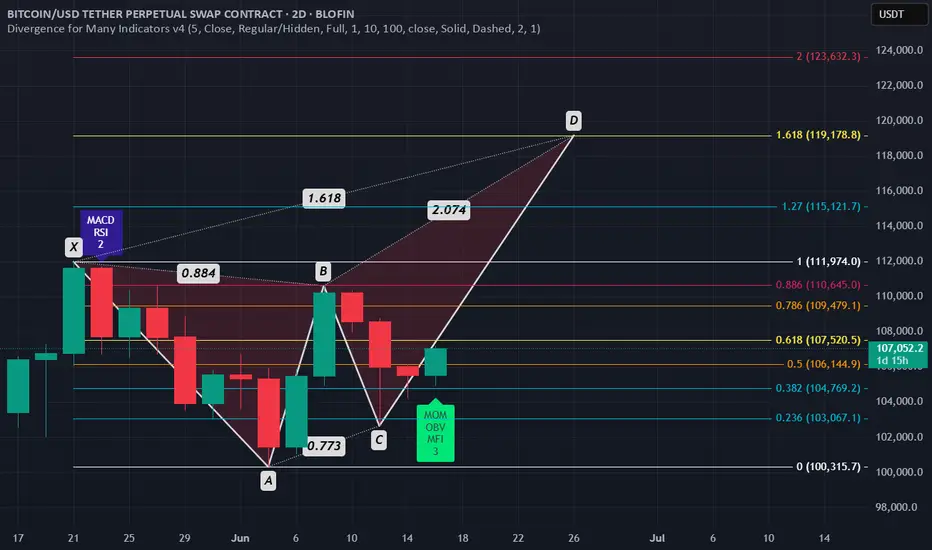
BTC doing a 1.618 means altcoin season is on🔥 Why 1.618 on BTC = Altcoin Season Coming
The 1.618 Fib extension is a common target for wave 3 or wave 5 in Elliott Wave theory. Once BTC hits it:
Many traders start taking profit on BTC.
That capital usually flows into ETH and major alts, then mid/small caps.
BTC dominance often peaks or stalls after hitting 1.618, which historically signals:
ETH/BTC starts rising
Altcoins gain strength against BTC and USDT
Retail and sidelined liquidity get attracted by BTC gains, but then chase faster % returns in alts.
🧠 Example Playbook
BTC breaks out → Runs hard → Hits 1.618 (e.g., from last correction low to current high)
ETH/BTC bottoms → ETH/USDT starts to run
Majors like SOL, AVAX, MATIC, DOT follow
Mid/small caps explode last (aka “altseason” proper)
BTC Plan: 16/06/25Bitcoin Bias Map – Monday BINANCE:BTCUSDT BINANCE:BTCUSDT.P
Current Context:
- Impulsive leg up completed.
- Reclaimed 106,400–106,500 on 4H timeframe with displacement.
- Higher low established on 4H.
- Equal highs around 110,700 on 4H, immediate draw on liquidity for bulls. Beyond that, all-time highs as targets.
Key Levels:
- Support: 106,400–106,500 region.
- Risk: Loss of this region H4 likely triggers a fast revisit to ~100k.
Price Action Signals:
- H4 overbought; M30 oversold — potential scalp long entry for move toward equal highs.
- H12 neutral but moving out of oversold.
- Daily neutral but price sitting in a daily bearish fair value gap.
Trade Plan:
- No interest in shorting unless 106,400 breaks decisively.
- No confirmed swing failure point yet to justify short trigger.
- Looking to enter long on pullback when H1 becomes oversold.
- Ready to flip short if wrong with clear structure break.
Personally, looking for longs. Until 106,500 is lost my bias is up now till EQHs. this is a strong reaction

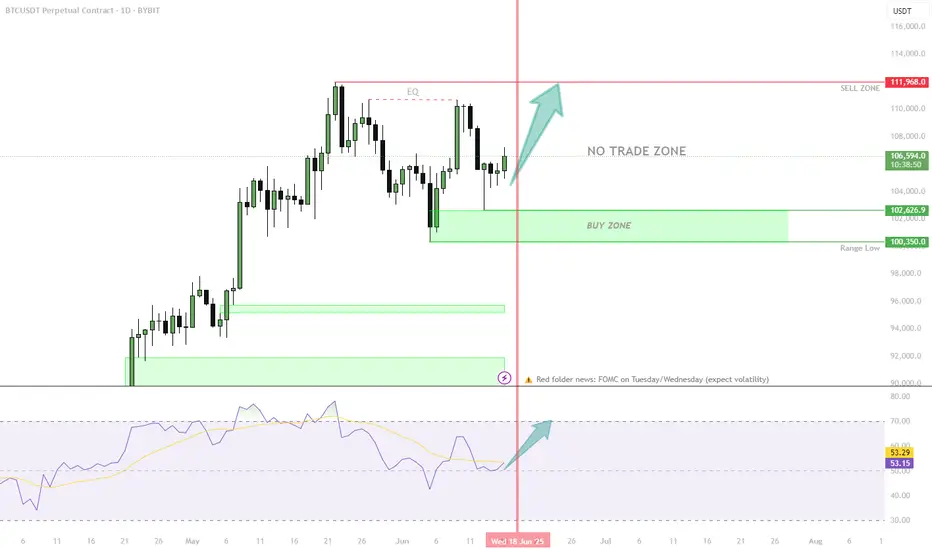
BTC Weekly Game Plan: Key Levels & Clear Setups!Short Scenario:
Enter on confirmed rejection (SFP or bearish MSB) from Equal Highs ($110,700) or BPR ($108,000)
Targets: $105,000 → $102,600 (Weekly Draw)
Invalidation (stop): Above $112,000 (Range High)
Long Scenario:
Enter on confirmed bounce (bullish MSB or SFP) at Weekly Draw ($102,600) or Range Low ($100,300)
Targets: $108,000 → $110,700
Invalidation (stop): Below $99,500 (under Range Low)
🔔 Triggers & Confirmations:
M15/H1 confirmation required: SFP or clear MSB before entry.
Avoid entries if price slices through levels without a reaction.
📝 Order Placement & Management:
🔻 Sell Limits: $110,700 & $108,000
🛡️ Short Stop: $112,100
🎯 Short Targets: $105,000 → $102,600
🔼 Buy Limits: $102,600 & $100,300
🛡️ Long Stop: $99,500
🎯 Long Targets: $108,000 → $110,700
🚨 Risk Warning:
Shorts are against HTF bullish momentum, increasing risk.
High volatility expected due to FOMC meetings (Tuesday/Wednesday).
BTC/USDT: Sector Momentum and Decision Zone Ahead of the Fed__________________________________________________________________________________
Technical Overview – Summary Points
➤ Strong multi-timeframe bullish momentum, confirmed by the Risk On / Risk Off Indicator signaling “Strong Buy” across all timeframes (daily, 12H, 6H, 4H down to intraday).
➤ Major supports (102,600–104,250 $) act as the market’s anchor; the 105,800–106,100 $ resistance remains the key level to break for a confirmed further bullish leg.
➤ Volumes are weak to normal, with no recent distribution, climax, or panic/extreme behavior (ISPD DIV neutral); market remains rational.
➤ Short-term TFs (1H, 2H) are more hesitant—favoring consolidation/range, suitable for scalping or risk management rather than directional breakout trades.
__________________________________________________________________________________
Strategic Summary
➤ Dominant bullish technical context, but facing key resistance, with macro and on-chain signaling for active caution.
➤ Opportunity: Buying pullbacks on 104,250–102,600 $, targeting extension if clean breakout above 106,100 $. Partial profit-taking into the 110–111k $ highs.
➤ Risk zone: Invalidation if there is a decisive break <102,000 $ or major red volume climax on failed resistance retest.
➤ Key catalysts this week: Fed/FOMC decision, major geopolitical events.
➤ Plan: Favour methodical accumulation pre-Fed, reinforce/swing post-announcement according to technical resolution.
__________________________________________________________________________________
Multi-Timeframe Analysis
1D : Trading below broad 105,800–111,000 $ resistance, Risk On / Risk Off Indicator strongly positive, normal volumes, no euphoria (ISPD DIV neutral). Healthy structure, upward bias confirmed.
12H/6H : Consolidation at major support; recent rebounds from 102–104k, no exhaustion signals. MTFTI Up but 2H-1H corrective divergence.
4H/2H : Range market, major supports defended, no breakout yet. MTFTI locally Down, indicating mild internal corrective dynamic.
1H/30min/15min : Intraday range, technical micro-bounces, weak directional bias, moderate volumes, no abnormal behavior. Scalping preferred below resistance, rigorous risk management.
Risk On / Risk Off Indicator : Strong aligned buy signal across all TFs, sector environment supportive.
__________________________________________________________________________________
Multi-Timeframe Key Points Summary
Strong bullish market, behavioral and technical stability.
Breakout >106,100 $ = legitimate bullish extension, 110k+ target.
Invalidation below 102k $: go to cash, wait for stabilization.
Volatility expected around (Fed/geopolitical) events: adjust sizing/stops accordingly.
__________________________________________________________________________________
Fundamental, Macro & On-Chain Analysis
Fed (FOMC June 17–18): Major breakout/volatility catalyst.
Geopolitical tensions (Israel/Iran): Risk-off spikes expected, watch liquidity zones.
On-chain: Key support at 100–102k $; no major distribution, long-term holders remain strong, options/futures point to underpriced volatility risk.
Strategy: Prefer gradual accumulation on supports, reduce exposure pre-Fed, confirm new swings post-FOMC.
__________________________________________________________________________________
Action Plan Summary
Accumulate on pullback 104,250–102,600 $, stop below 101,900 $.
Breakout >106,100 $: Target 110k–111k $, partial TP, monitor volume/volatility.
Avoid overtrading pre-FOMC or amid major geopolitical news.
Risk/Reward >2 on pullback – strict management mandatory.
__________________________________________________________________________________
Conclusion & Context Mastery
The market remains structurally bullish and supported by the combination of technical, sector and on-chain factors. However, macro/geopolitical volatility requires increased caution as the FOMC approaches. Focus on support entries, avoid chasing resistance until confirmed, and apply tight stops in this catalyst-rich context.
__________________________________________________________________________________
MARKET TECHNICAL BREAK DOWN FOR 16TH TO 20TH JUNE📊 Market Technical Breakdown – EURUSD, AUDUSD, XAUUSD & BTCUSDT 🔍
Traders,
Get ready for this week’s precision-driven analysis across four major markets:
✅ EURUSD – Is the euro gaining strength or facing more downside?
✅ AUDUSD – Key zones to watch as the Aussie reacts to USD data.
✅ XAUUSD (Gold) – Will gold hold strong or give in to bearish pressure?
✅ BTCUSDT – Bitcoin’s momentum shift: Are bulls still in control?
This breakdown covers:
🔹 Clean chart analysis
🔹 Key levels (support & resistance)
🔹 Trade ideas with potential entries & exits
🔹 My personal trading insight for each pair
🎯 Whether you're a beginner or a seasoned trader, this breakdown will help sharpen your bias and build confidence in your trades.
👉 Watch the video till the end to catch all setups, confirmations, and bonus tips for the week.
Drop a comment if you found it helpful or want to see a pair included in the next breakdown!

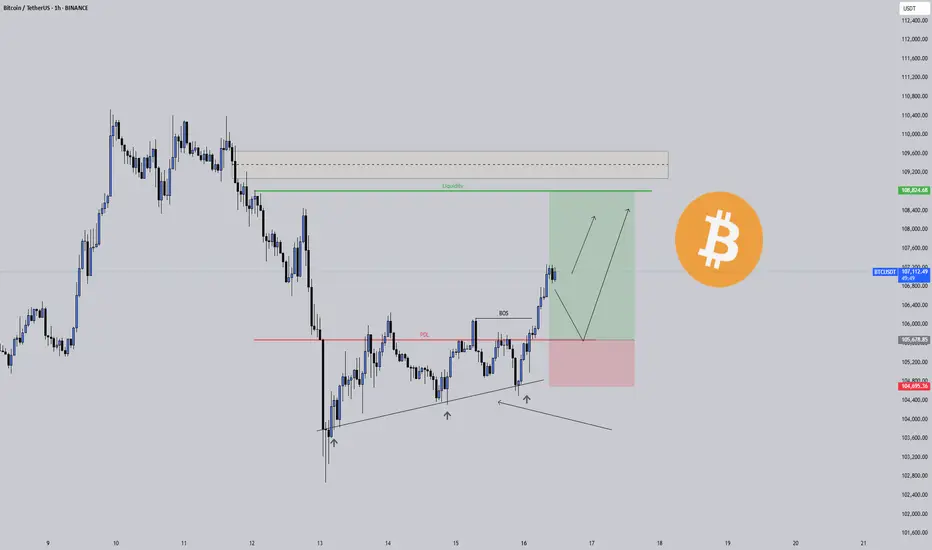
My BTC Play With a Macro BoostThis isn't about guessing.
This isn’t hype.
This is what happens when structure, liquidity, and macro fundamentals align.
Let me break it down:
Technical Perspective
BTC just pulled a classic trap.
✅ Liquidity Sweep: Price dipped below the 4PDL (Previous Day's Low), sweeping out late longs and triggering emotional shorts.
✅ Break of Structure (BOS): Price broke cleanly broke strucutre, confirming bullish intent.
✅ Fair Value Re-entry Zone: We now have a clean FVG zone if price pulls back.
But that’s not all...
🔼 Retail Pattern Detected :
Look closely, there's a textbook ascending triangle in there. Retail traders often use it to predict bullish breakouts. What they see as a triangle, we see as smart money coiling pressure before the move.
Fundamentals Supporting the Structure
This move isn’t just technical, it’s backed by real market weight:
Public companies are buying Bitcoin by the billions: MicroStrategy, Trump Media, Metaplanet they’re not “speculating,” they’re storing BTC as a treasury asset.
Institutional inflows are accelerating: ETFs, sovereign interest, and large-cap investors are building long positions — and it’s beginning to reflect in the chart.
The U.S. is formalizing a Bitcoin reserve policy.: Call it political, strategic, or monetary — either way, it reinforces that dips like this are being bought by giants.
The candle doesn’t lie but neither does the macro narrative when they both point in the same direction.
Mindset Tip: Ride Logic, Not Emotion
This setup teaches us something important:
You don’t have to catch every move. You just need to understand why it moved — and position accordingly.
If it pulls back, don’t panic. Let the market invite you, not rush you.
BTC accumulates, back to 108,500Plan BTC today: 16 June 2025
Related Information:
The price of gold is nearing its all-time high as tensions in the Middle East escalate, but analysts say they’re doubtful Bitcoin will do the same as investors prioritize other safe-haven assets.
The price of gold rose to $3,450 per ounce on Monday, just $50 shy of its all-time high of just below $3,500 in April, according to TradingView.
The usually slow-to-move asset has gained a whopping 30% since the beginning of the year, catalyzed by US President Donald Trump’s trade tariffs and, more recently, an escalation of military action in the Middle East following an Israeli missile strike on Iran on June 13, which caused Bitcoin prices to fall.
Gold prices have also been linked with inflationary pressures, as it is considered a safe haven and an inflation hedge by investors.
personal opinion:
The crypto market recovered at the beginning of the week after being affected by war news. It will almost certainly continue to maintain the 4.5% interest rate, so it will be difficult to break ATH this week.
Important price zone to consider :
Sell point: zone 108.400 - 108.600 SL : 109.100
Take profit : 107.900 - 107.000 - 106.000
Sustainable trading to beat the market
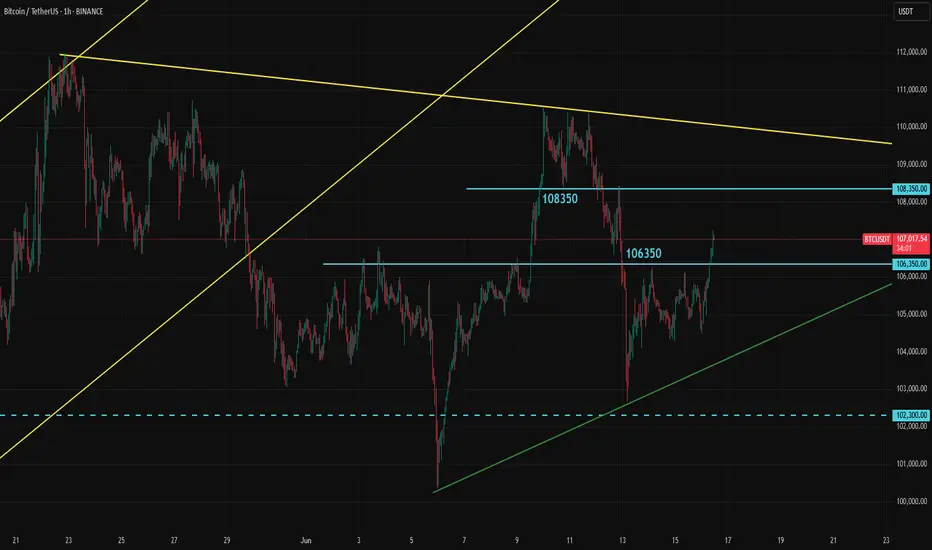
Bitcoin Attepmpts a Comeback with the Break of 106350Bitcoin is break above the key 106350 resistance and continues to rise. As long as BTC stays above this level, short-term bullish outlook remains intact.
The biggest risk for crypto right now is its correlation with the stock market. With the July 9 tariff deadline approaching and the Israel–Iran conflict raising broader market and oil price risks, a potential selloff in equities could weigh on crypto as well.
The good news for crypto is Ethereum's strength. In the last bull cycle, when BTC neared the cycle top, ETH began to lead, pulling altcoins up with it. While the market doesn’t appear to be at that stage just yet, recent inflows into Ether ETFs suggest that BTC could be nearing its final leg higher.
In the short term, 108350 is the first level to watch.
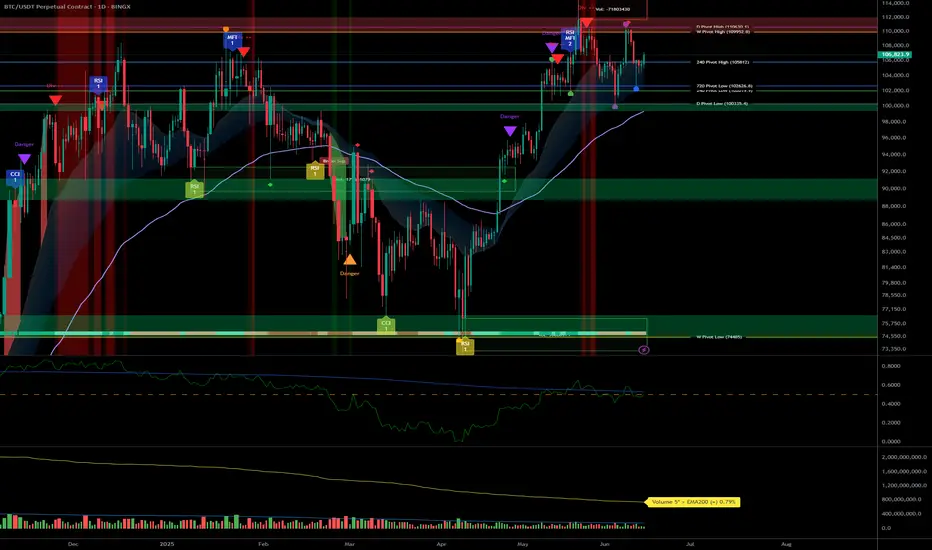
BTCUSDT Daily: Analyzing Key Support & ResistanceChart Overview:
BTCUSDT Chart indicates the price action from a bearish phase into a significant bullish reversal and subsequent consolidation. Key price levels, market structure shifts, and Fibonacci retracement zones are highlighted, offering potential areas of interest for traders.
1. The Bearish Phase & Breakdown (February - April):
• Initial Downtrend: The price initially depicts a downtrend characterized by a series of lower highs and lower lows, indicating strong bearish control.
• "Break Down": In late February/early March, price decisively broke below a significant support level (indicated by the "Break Down" label). This confirmed the continuation and strength of the bearish momentum, pushing BTCUSDT to lower lows around the $76,000 region.
2. The Market Structure Change (Late April - Early May):
• Trend Reversal: Following the lows in April, we observe a strong bullish impulse. This rally culminated in price breaking above a critical resistance zone (highlighted by the upper grey box labeled "Market Structure Change").
• Significance: This "Market Structure Change" is a pivotal event. It signifies a shift from bearish control (lower highs/lows) to bullish dominance (higher highs/lows), as previous resistance becomes potential support (a "flip" level). This is often the first major sign of a trend reversal.
3. The Bullish Impulse & All-Time High (May - Early June):
• Strong Uptrend: After the market structure change, BTCUSDT experienced a powerful bullish move, establishing new higher highs.
• "All Time High at $112,000": The price reached a new all-time high around $112,000 (specifically labeled as 111,999.0). This peak marks the top of the measured bullish impulse, which serves as the anchor point for the subsequent Fibonacci retracement.
4. Current Consolidation & Fibonacci Retracement (June - Present):
• Pullback from ATH: Following the new all-time high, BTCUSDT has pulled back and entered a period of consolidation, exhibiting a ranging behavior.
• Fibonacci Retracement: A Fibonacci retracement tool has been applied from the significant swing low (around $93,389.7, which is the 1.0 Fib level relative to the ATH) to the "All Time High." This tool helps identify potential support levels where price might find buyers during a pullback.
o "Daily Immediate Support": This area, approximately between $102,694.4 (0.5 Fib) and $100,498.5 (0.618 Fib), has acted as strong immediate support. Price has bounced from this zone multiple times, confirming its significance. The 0.618 Fibonacci level is often referred to as the "Golden Ratio" and is a highly watched retracement level for potential reversals or strong support.
o "Daily Key Support": This deeper support zone, around $93,389.7 (which aligns with the 1.0 Fib of the previous swing and the prior "Market Structure Change" area), represents a critical level. If the "Daily Immediate Support" fails, this zone would be the next major test for bullish continuation. Its alignment with the previous market structure change adds to its importance as a "flip" level (former resistance turned support).
• "Daily Target": The label "Daily Target" is positioned near the previous highs/resistance. In the current context of consolidation and pullback, this area now acts as a key resistance zone that bulls would need to overcome to resume the uptrend towards new all-time highs. It represents the immediate bullish objective.
Potential Scenarios:
• Bullish Continuation: If BTCUSDT continues to hold above the "Daily Immediate Support" (green zone) and then breaks above the "Daily Target" resistance with conviction, it would signal a likely continuation of the uptrend towards new all-time highs above $112,000.
• Deeper Retracement: A breakdown below the "Daily Immediate Support" would likely lead to a test of the "Daily Key Support" (lower grey zone). A strong bounce from this level would still keep the bullish structure intact for the larger timeframe.
• Trend Invalidaton/Reversal: A decisive break below the "Daily Key Support" (lower grey zone / 1.0 Fib of the prior swing) would be a significant bearish development, potentially invalidating the recent bullish market structure and indicating a deeper correction or even a reversal of the current uptrend.
Conclusion:
BTCUSDT is currently in a consolidation phase after a strong rally to new all-time highs. The immediate focus is on whether the "Daily Immediate Support" holds. Traders should closely monitor price action around both the immediate and key support zones, as well as the "Daily Target" resistance, for clues on the next directional move. Volume confirmation for any breakouts or breakdowns will be crucial.
Disclaimer:
The information provided in this chart is for educational and informational purposes only and should not be considered as investment advice. Trading and investing involve substantial risk and are not suitable for every investor. You should carefully consider your financial situation and consult with a financial advisor before making any investment decisions. The creator of this chart does not guarantee any specific outcome or profit and is not responsible for any losses incurred as a result of using this information. Past performance is not indicative of future results. Use this information at your own risk. This chart has been created for my own improvement in Trading and Investment Analysis. Please do your own analysis before any investments.

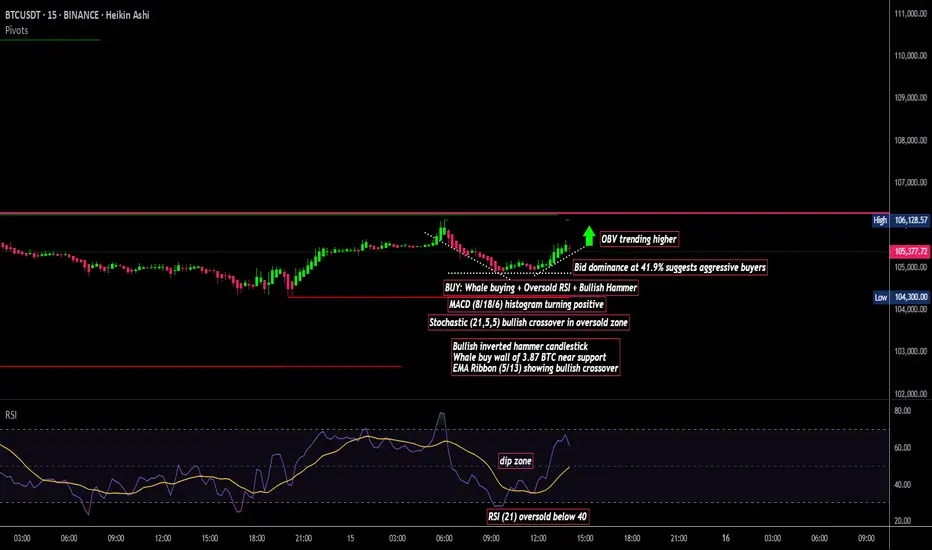
BTC/USDT Technical Analysis, 2025-06-15 14:00 UTCBTC/USDT Technical Analysis, 2025-06-15 14:00 UTC
This setup illustrates a high-probability short-term trade using confluence between technical indicators, price action, volume behavior, and order book data.
Entry Conditions
A potential long entry was identified around 105,289.39 based on the following:
RSI (21) was in the oversold zone, below the 40 level
MACD (8/18/6) histogram flipped from negative to positive, signaling momentum shift
Stochastic (21,5,5) showed a %K/%D bullish crossover in the oversold region
A bullish reversal candlestick pattern formed near short-term support
Whale activity detected in the order book, including a 3.87 BTC buy wall
EMA Ribbon (5/13) indicated a bullish crossover
Take Profit & Risk Management
Target level for potential profit was set near 106,489.39, representing approximately a 1.2% move from entry
Stop loss was positioned at 104,689.39, around 0.6% below the entry to maintain a 1:2 risk-to-reward ratio
Order Flow Context
On-balance volume (OBV) was rising, supporting upward pressure
Bid dominance reached 41.9%, indicating aggressive buyers in control
Depth of market showed strong support from large limit buy orders
Important Notes for Traders
Always backtest setups before applying in live market conditions
Use stop losses to protect capital
BTC - Current market updateAs mentioned in the last CRYPTOCAP:BTC update,
we're currently ranging within a very important area.
We just saw a fakeout below the trendline and quickly pushed up to the resistance at $106,000.
According to global liquidity data (with a 12-week lag),
June 16 is a highly significant date.
I'm curious to see what unfolds in the coming days —
especially with the FOMC meeting set for June 18.
That said, I’m neither going long nor short in this kind of environment —
I’m simply waiting and observing.

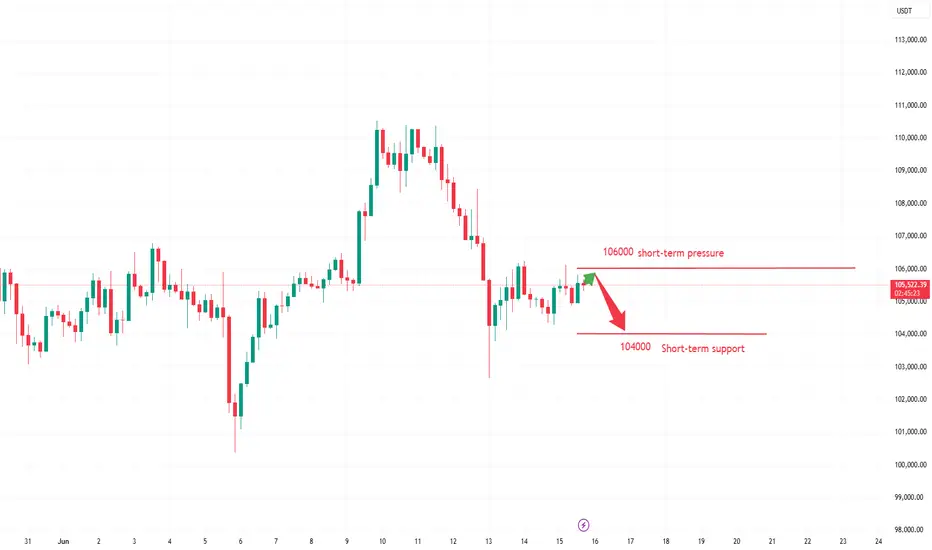
Analysis of Next Week's Market TrendsBitcoin is trading in a narrow range, with an intraday volatility of only 1.7% and trading volume shrinking by 18%, indicating market wait-and-see sentiment after key geopolitical events.
After the Israel-Iran conflict triggered $1 billion in liquidations, market panic has eased. Israel's preemptive strike on Iran on the 13th caused Bitcoin to flash crash to $102,000, but by the 15th, the market had partially digested the risks. The Fear & Greed Index stabilized at 60 (greed zone), showing that funds did not massively flee to safe havens.
Bitcoin is in a critical accumulation phase on the eve of a breakthrough. The digestion of geopolitical risks and institutional buying constitute supporting forces, but short-term attention should be paid to the risk of breakdown in the triangular pattern. It is recommended to strictly guard the defense level of $104,200 and the breakthrough point of $106,300.
Humans need to breathe, and perfect trading is like breathing—maintaining flexibility without needing to trade every market swing. The secret to profitable trading lies in implementing simple rules: repeating simple tasks consistently and enforcing them strictly over the long term.
Trading Strategy:
sell@105900-106000
TP:104000-1045000
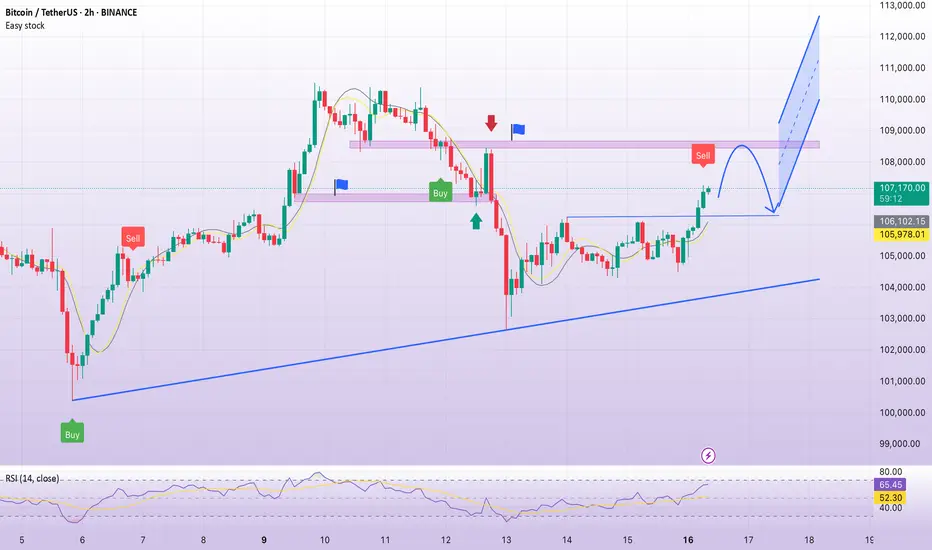
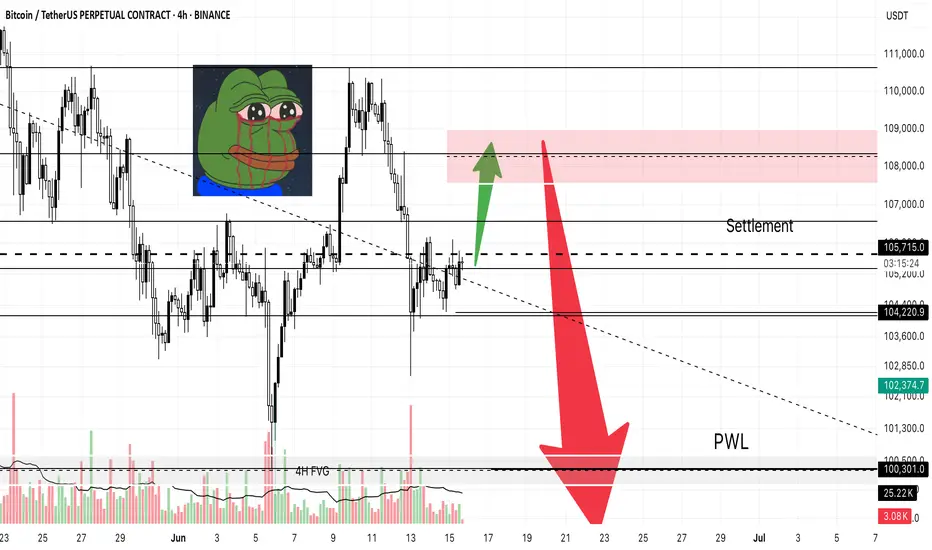
My BTC Plan. First Pump, Then Dump?As always, I’m sharing my personal thoughts on what I expect from Bitcoin in the next few days. This is not financial advice just my outlook based on technicals, volume zones, and market behavior.
CME Bitcoin futures closed Friday at $105,715. Historically, CME gaps often get filled. So unless we see new geopolitical escalation between Israel vs. Iran on Sunday, I expect a fake pump on Monday toward the $108,500-$108,600 area.
That would be:
A 0.705 Fibonacci retracement from the recent low
A typical Monday move to trap shorts and create early bullish euphoria
Midweek Expectation: Dump to 4H FVG
After the fake move up, I’m anticipating a strong retracement down toward the 4H Fair Value Gap (FVG) in the $98,632 - $97,378 region. This area:
Contains heavy previous volume zones
Aligns with Previous Day Low, Previous Week Low
Holds multiple imbalances still unfilled
If the market receives negative news or sentiment breaks down quickly, I wouldn’t be surprised to see an even deeper move into the next 4H imbalance at $96,167 - $95,080.
Below that? There’s still a massive amount of untouched liquidity, including the Previous Month Low $93,322.
My Macro View: Scenario of Maximum Pain
I think the bottom of this Bitcoin correction will land somewhere around $87,300 – $86,000.. Why?
This would be a scenario of maximum pain
It’s a level where most investors will capitulate, especially in altcoins
If BTC goes that low, panic selling will trigger across the board
And ironically, this is how altcoin seasons always begin from disbelief.
Stay focused, stay safe. The volatility this week will be high, and smart positioning is key.
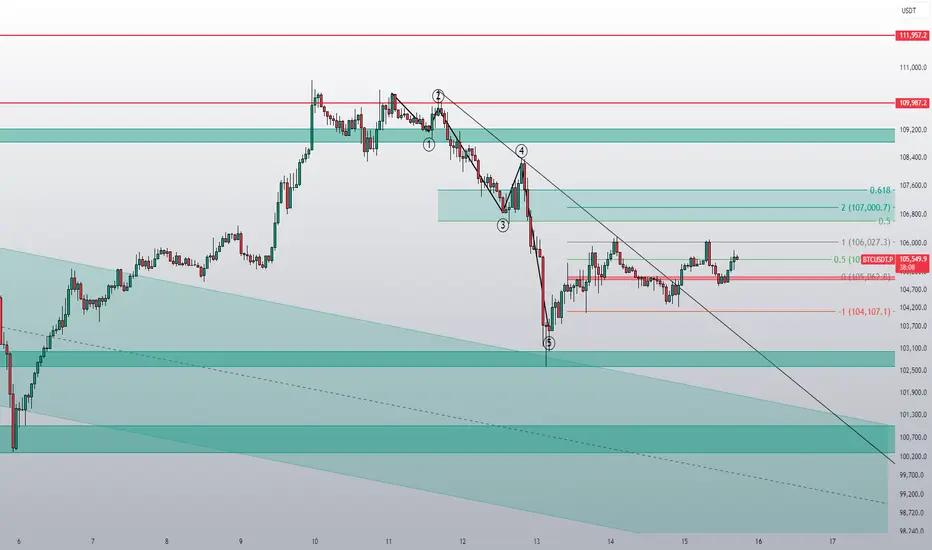
Reversal?I have to make a correction to my previous publication. Five waves had already been completed. This potential reversal therefore makes perfect sense at this point.
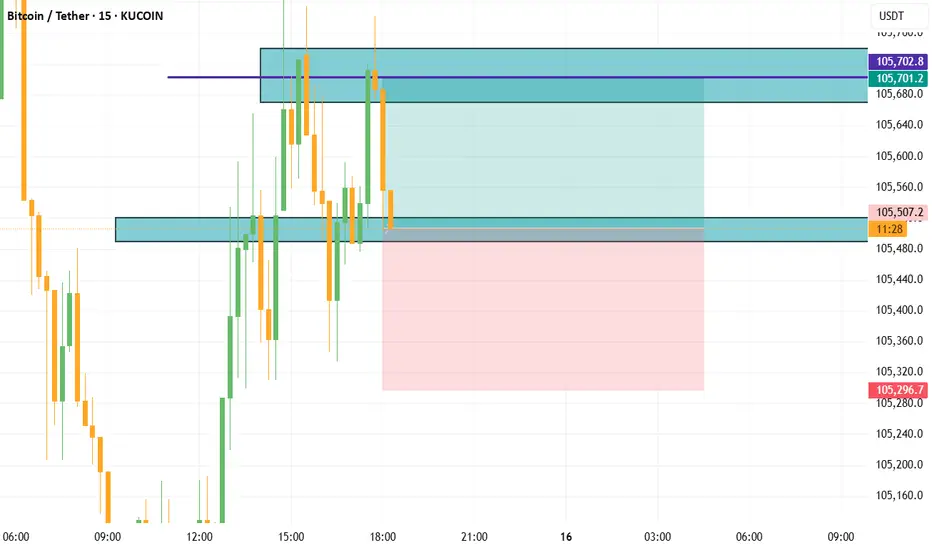
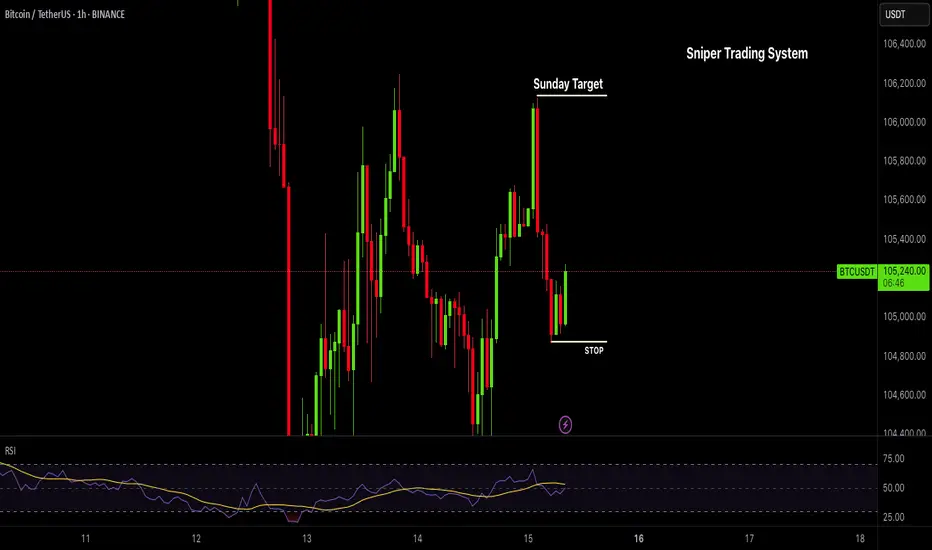
BTC Buy Setup | Sniper Trading System - Reverse Play🚨 BTC Buy Setup | Sniper Trading System™️ Reverse Play Activated
What you’re looking at isn’t luck — it’s Sniper-level execution.
This BTC reversal trade was triggered by my Sniper Trading System™️, which identifies institutional-level liquidity traps, dealer ranges, and timing zones with precision.
🧠 Setup Highlights:
— Liquidity sweep below key support
— RSI confirming reversal from the Fade Zone
— Dealer Range low respected
— Reversal candle + structure shift = high-probability sniper entry
📍 Chart:
This is powered by my Jesus Saves™️ + Fade Reversal Combo, built into the Sniper Trading System Suite™️.
BTC - Short-Term market updateWe’re currently moving sideways between the ATH and $100K.
We’ve tapped into the short-term trend reversal zone and are now consolidating around it.
The next move will come — whether it breaks up or down.
What matters most now is the $100K Higher low.
As long as we stay above it, the structure remains bullish.
If we break below, momentum will shift accordingly.
I’m not taking any positions right now — just observing,
while the geopolitical noise plays out.
The most important thing in phases like this are to
stay calm, focused, and filter out the noise.
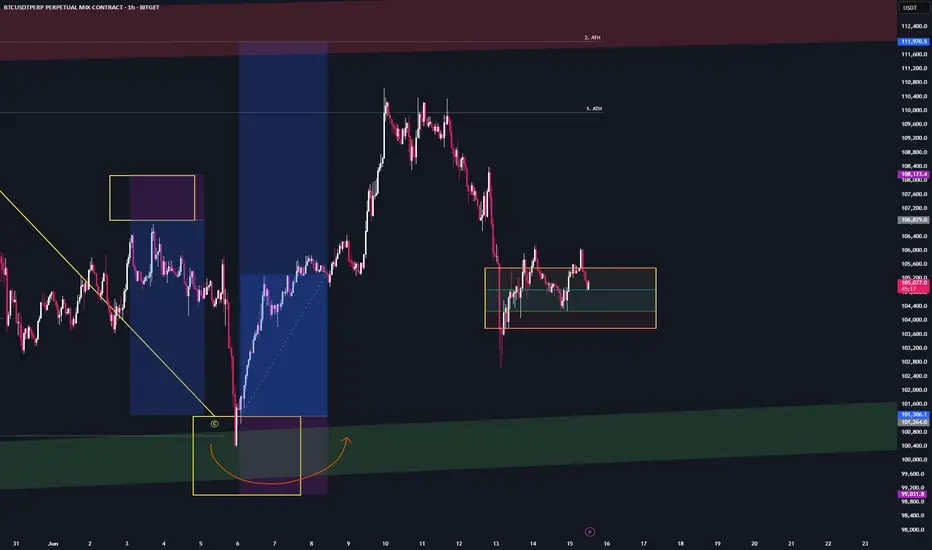
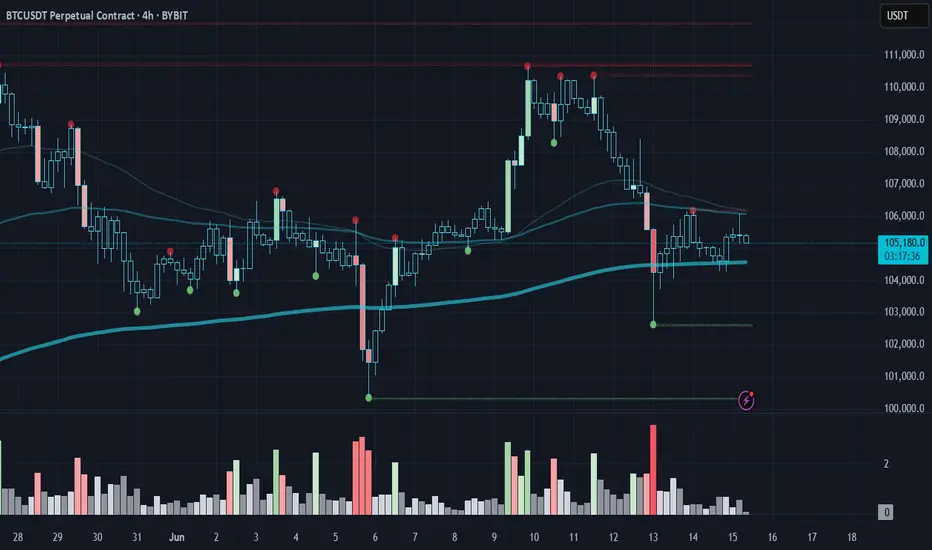
Bitcoin is holding the 200 EMA on H4 despite everything...Despite war news and heavy sell volume, BTC held the 200 EMA on H4.
Low-volume weekend = low liquidity, yet bears still couldn’t break it.
🧠 Classic Effort vs. Result: big effort, weak result = hidden strength.
🎯 If it holds: $106.5K → $108.2K → $110K in play.
Structure intact. Bulls stealthily in control.