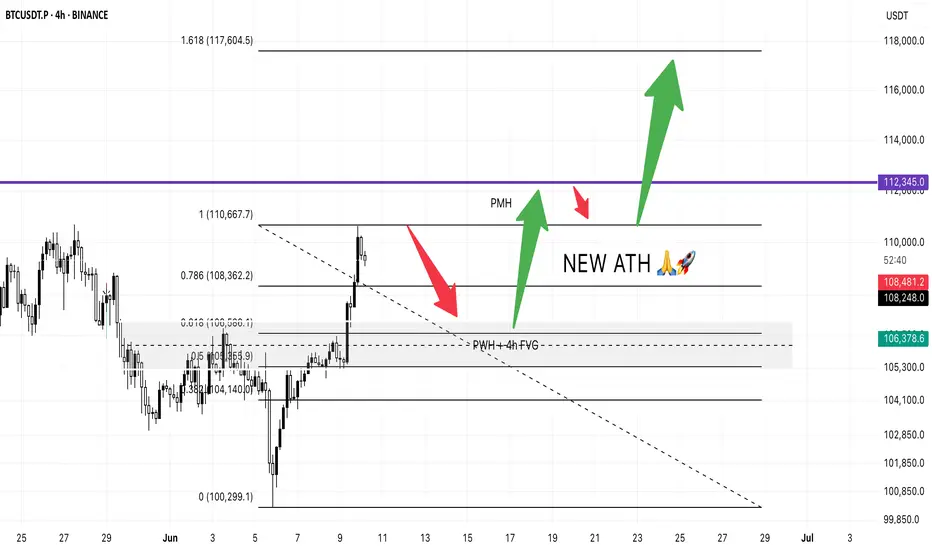
Bitcoin Pre-CPI PlanJust like in trading it’s all about structure, levels and reaction.
We’ve seen BTC bounce cleanly from the psychological level of $100,299 and rally all the way to $110,667.
Based on that impulse move, I’m watching the 0.618 Fibonacci retracement at $106,586 as a potential dip-buy zone. That level aligns perfectly with:
✅ 4H Fair Value Gap
✅ Previous Week High
If we get a healthy CPI print today, I expect BTC to continue the bullish move and go for a new ATH.
🎯 First target: $112,345 (slightly above Previous Month High)
📉 Then, a potential pullback to $110,667 (support retest)
🚀 Followed by a breakout move to $117,604 the 1.618 Fib extension
All eyes on today’s CPI. If the data is good, the sky’s the limit.
Let’s see if bulls have the strength to push it all the way. 💪📈
BTCUSDT.3S trade ideas
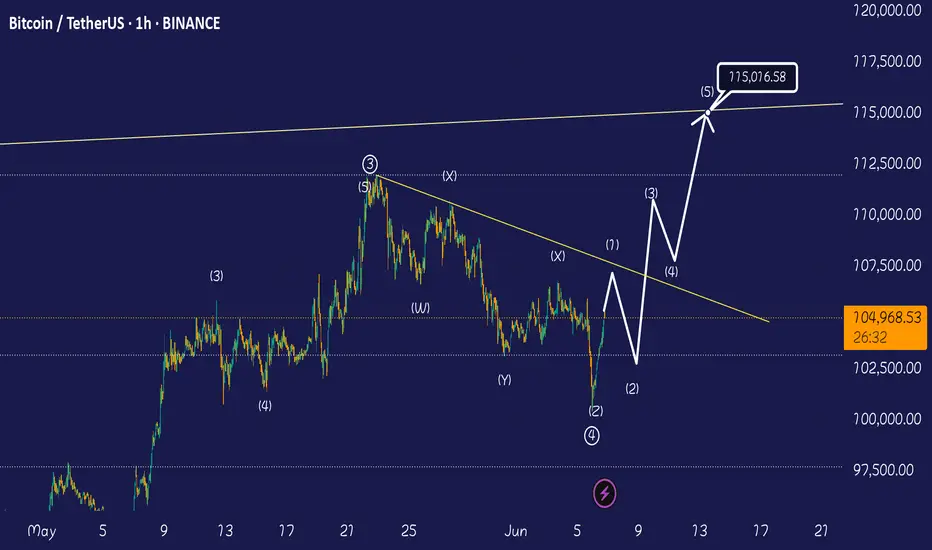
114k very soon Btc successfully completed wave4 , price can rise until 107k and after that micro wave 2 will correct price to 103k-104k , i dont open short position because BTC is very bullish, but i will wait for micro wave 2 . Good luck 👍
BTC - Ranges overview Let's have a look at BTC as we start this new week.
From a weekly perspective you can see how we through around the weekly gap (blue box)and respected it.
On the LTF we broke below it and failed to close below it.
From here expect us to aggressively trade back towards 110K and eventually new ATH.
IF we fail to hold the current sellside, we will revisit the weekly gap (blue box) and 105K.
As always WAIT FOR THE MARKET TO SHOW YOU ITS HAND AND TRADE WITH IT.
Stay safe and never risk more than 1-5% of your capital per trade. The following analysis is merely a price action based analysis and does not constitute financial advice in any form.

BTC - SetupWe’ve just broken through the major bearish trend reversal zone.
If momentum holds — and I believe it will —
we’re likely about to see the next BTC rally,
which means altcoins will follow.
But now is not the time to enter.
Anyone who hasn’t positioned long after all the entry setups we had is just fucked and missed it...
Right now, it’s time to wait and to do nothing.
We’ll see what the future will bring.
This is also the moment to lock in and stick to your plan — no matter what.
Euphoria is coming, and those without fixed rules
are going to get absolutely wrecked.
LFG.
Send it higher. 🚀
The current price action appears to be forming or just breaking 🔍 Pattern Analysis:
✅ Possibly a Rising Wedge / Bearish Channel:
• The price has moved up sharply and is consolidating in a narrowing, upward-sloping range, which is typical of a rising wedge—a bearish reversal pattern.
• These wedges often break downward, especially if they form after a steep rise (which BTC has recently had).
✅ Breakout Zone:
• BTC appears to be testing or just breaking above the upper trendline of a prior descending resistance (could be a breakout retest of a downtrend line from a larger timeframe).
• Volume shows a slight uptick, which adds some bullish confirmation, but RSI is in overbought territory (above 70), suggesting caution.
⸻
📊 RSI & Volume Context:
• RSI is above 70, showing potential overbought conditions.
• Volume spiked during the recent move up, suggesting strong buying interest—but watch for divergences.
⸻
🔄 What to Watch Next:
1. Fakeout Risk: If the price fails to hold above the trendline and falls back into the wedge, this would validate the bearish wedge and could lead to a drop.
2. Confirmation of Breakout: A sustained close above ~$108,000 with strong volume may flip this pattern into a bullish breakout, invalidating the wedge.
3. Support to Watch: $106,500 (recent breakout area), $105,000, and the lower wedge line.
⸻
⚠️ Summary:
• Likely Pattern: Rising wedge (bearish), with possible breakout attempt.
• Bias: Cautiously bullish short-term, but bearish risk increases if the price closes back below the trendline.

Is it possible 114k-115k ATH?Here is my insigt on BTC. Possible reach of 114k-115k. And if not, 105k down
Trade at your own risk
#NFA

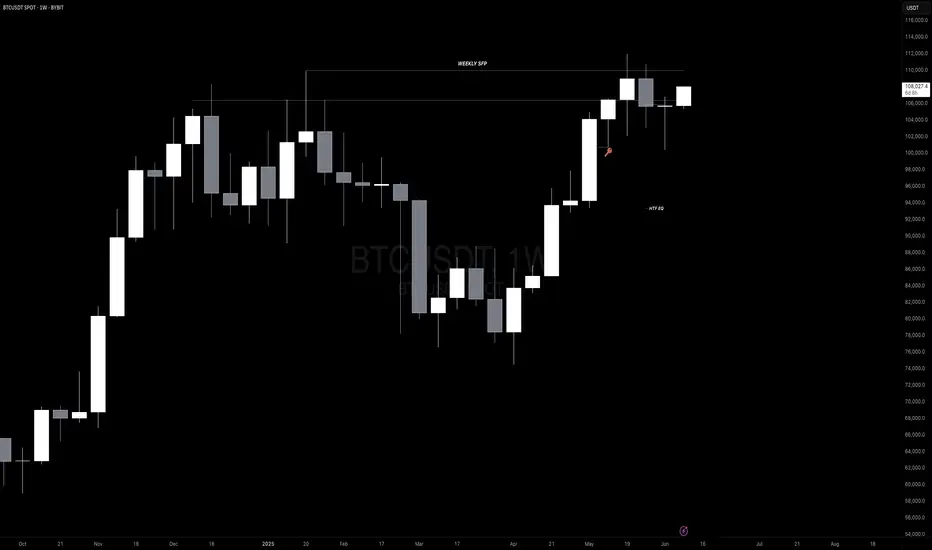
#BTC - Post Weekly Close Update 👉#BTC has deviated from the RLs and has since seen a magnificent recovery into KL, which, if closed above on the daily, can result in higher prices, potentially even a new ATH. The weekly candle itself is a long-legged doji, which, as you know, is an indecisive candle with a very small body representing indecision, and rightly so, as we continue to range on HTF with no resolution above or below the SH and SL.
I also note that despite the recovery, we’ve closed below the weekly resistance at 106400 on HTF. A weekly close above it would be ideal to confirm higher prices
👉On LTF/MTF – We’ve seen a break above the TL as well as 4H & 12H closes above the PSH at 106766, which ought to be sufficient as a signal for an upward move. For better confirmation, I’d like to see a daily close above PSH, followed by a PB into KL, and we can then look for entries on BTC or alts.
If, however, we see a rejection from the CMP and get below ~103K, it suggests a retest of 100K and potentially even 98K. So keep that in mind, even though that’s an unlikely scenario given the strength of the PA atm.
💪I also note that we haven’t left any imbalances in the chart. Every imbalance has been filled by an LH, which suggests we might see a swift move up if it comes. Now we’re just waiting for the daily close to confirm the BO above PSH, which seems likely given the PA.
💪Also, all BVOLs charts are at support atm, suggesting a massive surge in volatility may follow.
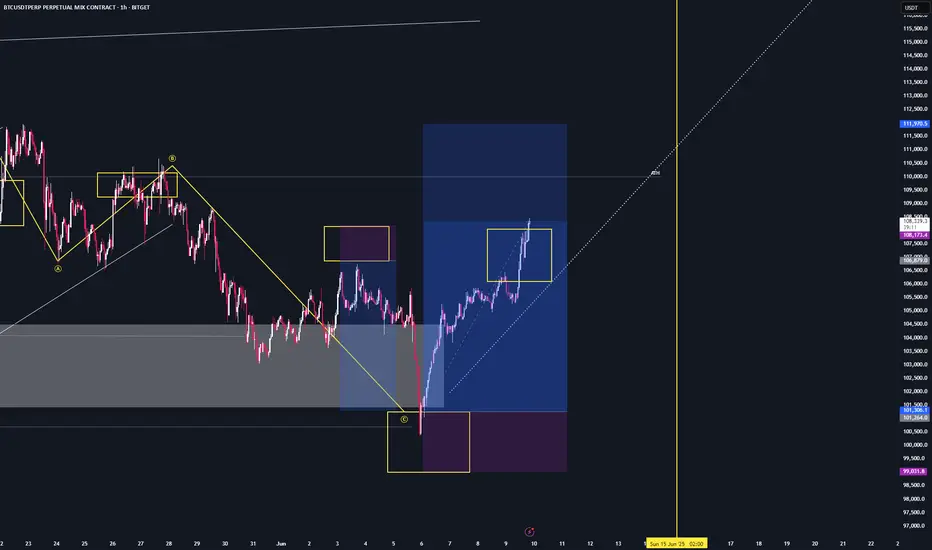
BTC RISKY SETUP (ANALYST TOKEN BREAKER)LONGED BTC HERE
RISKY ONE BUT CAN EXPECT PUMP TOWARDS WHITE LINE
BTC Risky Long
📦 Entry Zone: $107,986.2 (Marked on chart)
🎯 TP1: $110,335.5
🎯 TP2: $111,965.9
🎯 TP3: $117,929.0
❌ SL: $106,436.2
🧠 Strategy:
✅ Use low leverage
✅ Risk only 2–5% per trade
⚠️ Stick to the plan — no chasing trades.
Discipline = Consistency 💹

BTC Step-Up SetupBTC Step-Up Setup
Ooooh BTC I have to 3R this...
One two three -----> price manages to get above the second step ------> Step-Up Setup

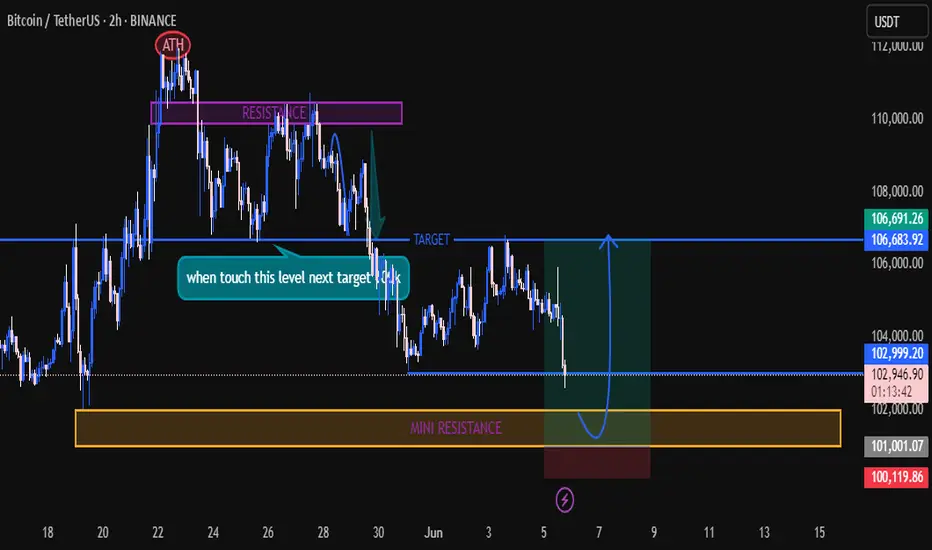
Bitcoin (BTC/USDT) 2-hour chart, focused on the buy side only!📊 Chart Overview
The chart shows BTC/USDT on the 2-hour timeframe, featuring clear levels of resistance, mini-resistance, and target zones. Let’s break down the buy idea:
🚀 Key Zones & Levels
💜 Resistance Zone (Purple Box):
Historical price ceiling.
Price dropped from this area several times.
🟦 Target Zone (Blue Line):
106,691 - 106,683 USDT.
Target for the next bullish move!
🟧 Mini Resistance (Yellow Box):
Around 102,000 USDT.
Acting as support (buy zone!) now.
💰 Buy Setup & Entry Area
✅ Buy Zone:
Just below 103,000 USDT, aligning with the mini resistance / support box (yellow).
✅ Entry Level:
Between 102,000 - 103,000 USDT.
Best if price consolidates or forms a reversal candle here.
🟢 Target:
First target: 106,000 USDT
Next major target: 106,683 - 106,691 USDT.
📉 Stop Loss:
Below 101,000 USDT for protection.
🎯 Trading Plan
1️⃣ Wait for a bullish reversal candlestick at the mini resistance box (~102,000 - 103,000 USDT).
2️⃣ Enter long (buy) position.
3️⃣ Target profit at 106,000 and 106,691 USDT.
4️⃣ Stop below 101,000 to manage risk.
⚡️ Summary
🟢 Buy: At mini resistance (~102,000 - 103,000).
🎯 Targets: 106,000 - 106,691.
❌ Stop: 101,000.
🚀 Let's ride the bullish wave! 💹📈🟢
$BTC similar pattern to early 2024CRYPTOCAP:BTC possible same scenario playing out. Similar pattern, liquidity grab long and short is done. Possible now is time to push higher. Idk what catalyst would push price higher, no rate cut in june. Perhaps tariff settlement.
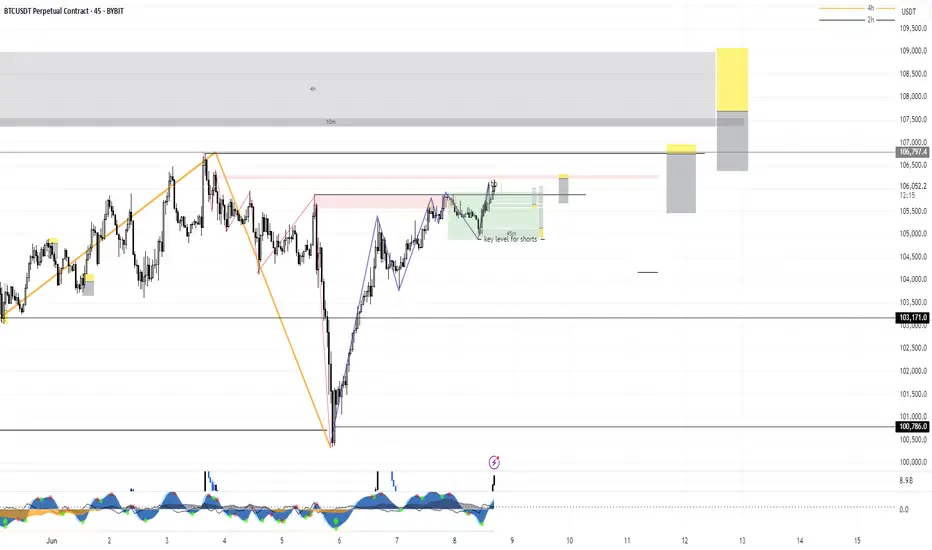
BTC short setup As previous weekly went good on BTC, a nice bounce from the area on swing setup. Now wait for the liquidity grab from 107.8k then take short, that whiteline is important to break and sustain for btc to continue it's Bullish trend. Longer sl is just to avoid wick damage closing matter here. Good luck, book at least 50% on 105.2k rest hold the position, and take long from mentioned zone.
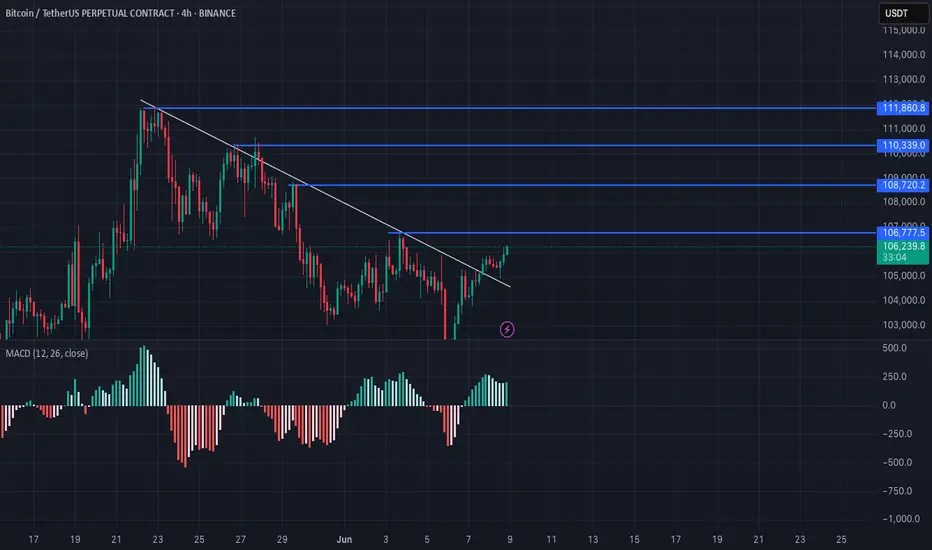
BTC – Testing 4H Descending Trendline ResistanceBTC is currently facing the descending trendline resistance on the 4-hour chart 🚀. If it breaks above this level, momentum could surge higher ⚡. However, a rejection might trigger another leg lower. This is a crucial spot to monitor – the market could move fast from here 👀!

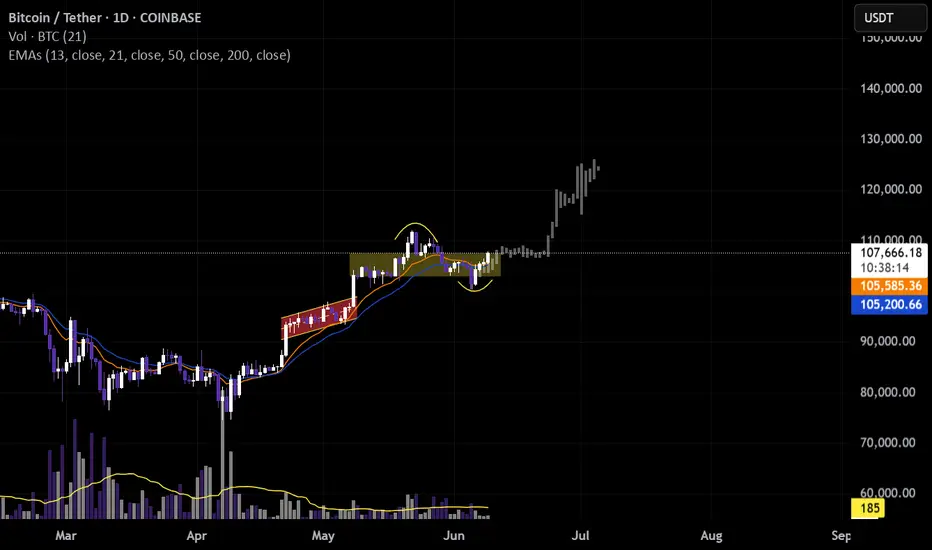
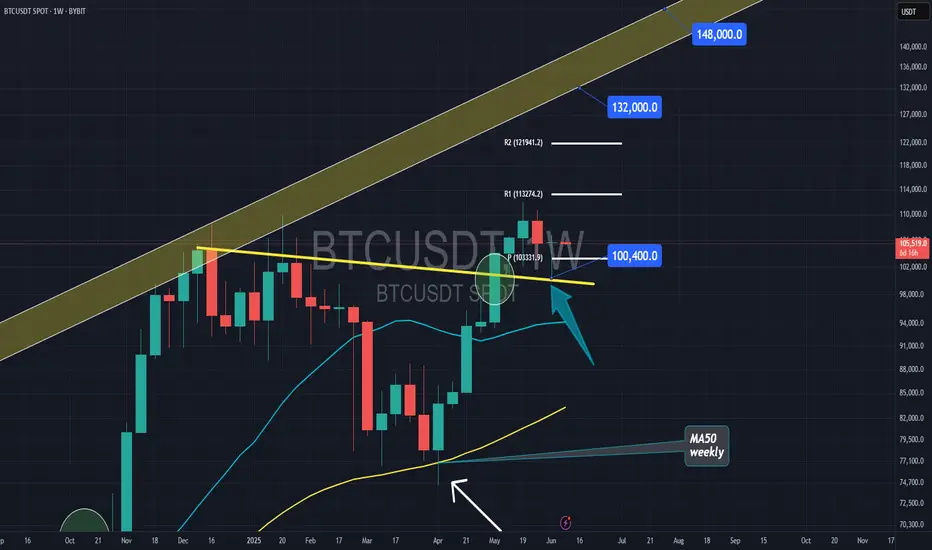
Bitcoin above the supportBitcoin back tested the important yellow resistance on weekly and closed a hammer candle above the pivot.
I wont be surprise to see $130k in couple of weeks.
Bitcoin Price Action Outlook – June 9, 2025🧠 Market Context
Bitcoin is currently breaking down from a rising wedge structure. Multiple Fair Value Gaps (FVGs) remain unmitigated, suggesting potential liquidity targets before any major move continues.
📌 Key Zones (FVGs Identified):
🔼 Upper FVG (Target zone): 106.3K – 106.6K
🔽 Mid FVGs (Retracement Zones):
105.1K
104.7K
🟣 Lower FVG Clusters (Strong Demand):
103.2K
102.7K
101.9K
🧩 Possible Scenarios
📈 Bullish Case (Support Reclaim & Bounce)
Price dips into mid FVGs (105.1K or 104.7K) and shows a bullish reaction.
If price reclaims the wedge structure → move toward 106.3K+ becomes likely.
📉 Bearish Case (Continuation Down)
Price breaks down further, targeting deeper FVGs at 103.2K or lower.
Watch for sharp reversals from demand zones (especially below 103K) for potential long setups.
📊 Strategy Ideas
🚀 Long Setup: Wait for bullish confirmation at 104.7K or 103.2K FVG → enter on price reversal.
🧨 Short Setup: Watch for rejection near 105.5K (top of wedge and 50% level of recent FVG) → downside potential to 103K.
⏰ Note
This is an intraday price action analysis. Use proper risk management and confirm setups with HTF confluence (1H / 4H).

BTC Divergence formingBollinger Bands 89 SMA (3D Chart)
Median trajectory is 120 Days back to
all-time high of $112k
... price will gravitate back to median
RSI is 65.78, still has room to go higher but
look at Divergence

Bitcoin Overall: aiming higher--may test supportWhile I believe BTC is heading higher (not ATH highs yet) after ending at least pt 1 of a larger corrective phase, if it breaks the current near-term trend but falling below the indicated wick, I think there's a good chance of reaching the first indicated support. Upon which there should be a long to the short region indicated.

BTC long in play BTC has broken the range and going up, trading idea and range in consideration. #BTC #ETH #Crypto
2nd Tiqgpt signal for BTCUSDT todayMARKET NARRATIVE: The analysis of BTC/USD across multiple timeframes reveals a consistent narrative of smart money accumulation and price advancement. Starting from the 1-hour chart, we observe a significant upward movement marked by a series of bullish candles, indicating a strong buying interest. This movement is characterized by the formation of a robust Order Block (OB) around the $106,300 level, which acts as a foundational base for subsequent price ascents.
Drilling down to the 15-minute timeframe, the continuation of bullish sentiment is evident as price action maintains above the previously established 1-hour OB, suggesting sustained institutional buying pressure. The price structure here shows a series of higher highs and higher lows, indicative of a Break of Structure (BOS) to the upside, confirming a bullish market structure shift.
On the 5-minute chart, the granularity increases, and we see more detailed interactions around key liquidity zones. The price action around these zones suggests that smart money is actively managing the ascent, possibly accumulating more positions on minor pullbacks. Each pullback into short-term mitigation blocks is met with a swift response, propelling prices further up.
The 1-minute timeframe provides the closest look at the micro-movements and shows the precision with which institutional players are operating. Notably, there is a slight pullback to a mitigation block near $106,318, which could be an inducement for further buying activity. This level aligns closely with the OBs identified in higher timeframes, reinforcing its significance as a strategic entry point.
INSTITUTIONAL THESIS: The consistent demand across all observed timeframes and the strategic positioning around key OBs suggest that smart money is targeting higher liquidity zones above the current price levels. The intent appears to be to drive prices towards the next significant liquidity pool, potentially around the $107,000 mark, where previous highs and unmitigated OBs converge.
LEARNING POINT: The interaction between multi-timeframe OBs and the execution of trades around these zones exemplifies the smart money concept of using lower timeframe pullbacks to OBs as high-probability entry points in the direction of the prevailing market structure.

BTC V-Shaped Recovery in Play Range ]
📊 Bitcoin 1H–4H Analysis: V-Shaped Recovery in Play — Range Still Holding Unless $106,355 Breaks
Bitcoin continues to consolidate within the range of $101,638 – $110,173, as previously anticipated. This range-bound movement remains valid unless price breaks above the $106,355 level.
On the 1H and 4H timeframes, a V-shaped recovery pattern is forming, which increases the likelihood of a bullish breakout. However, the orange trendline drawn from previous price action still holds as a key dynamic level — offering both technical structure and resistance.
---
🟢 Long Setup:
📍 Entry Trigger: Break and close above $106,355
📈 Momentum Confirmation: If RSI on the 1H timeframe closes above 67, it adds strong confirmation to the bullish bias
🛡️ Stop-loss: Around $104,950
---
⚠️ Range Context:
Current range: $101,638 – $110,173
As long as price stays inside this range, both breakout and breakdown setups remain valid
📉 Breakdown zone: Still watching $103,822.8 as bearish trigger (from earlier analysis)

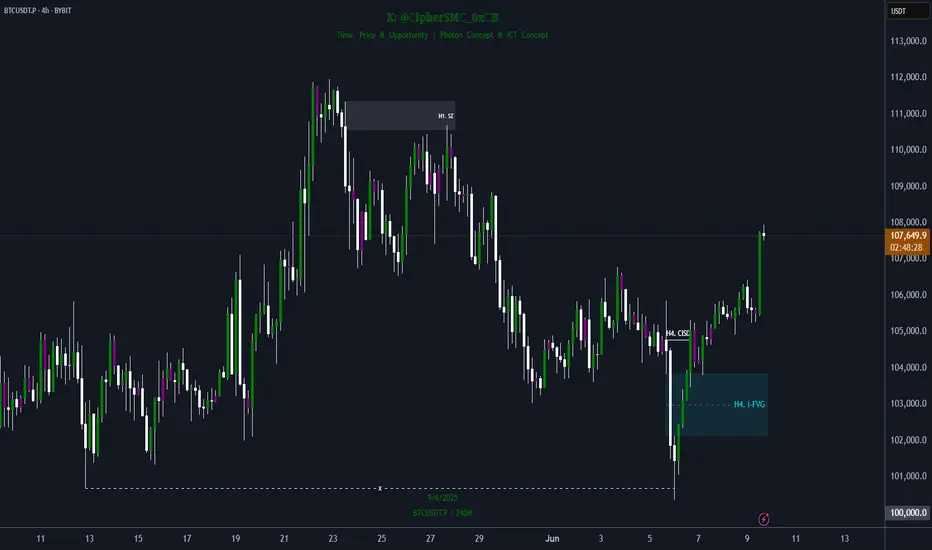
NEW WEEK NEW TRADES! New Week. New Opportunities. 🚀
As we step into the second week of June, we’re fully prepared to take advantage of the markets — with both long 📈 and short 📉 setups ready in advance.
✅ We caught most of the major moves last week — now let’s see if the trading gods 🙏 are on our side again.
📊 Charts are ready — feel free to download them, and drop any trade setups you’re watching in the comments below.
🟠 BTC is on the road to redemption after the SFP at the daily higher low.
Will it break 4H structure? Or reverse back down? Either way, we’re prepared and positioned for both scenarios.
🗓️ This Week’s Schedule:
Classes are expected on Monday, Tuesday, and Friday.
⏰ Exact times TBC — stay tuned.
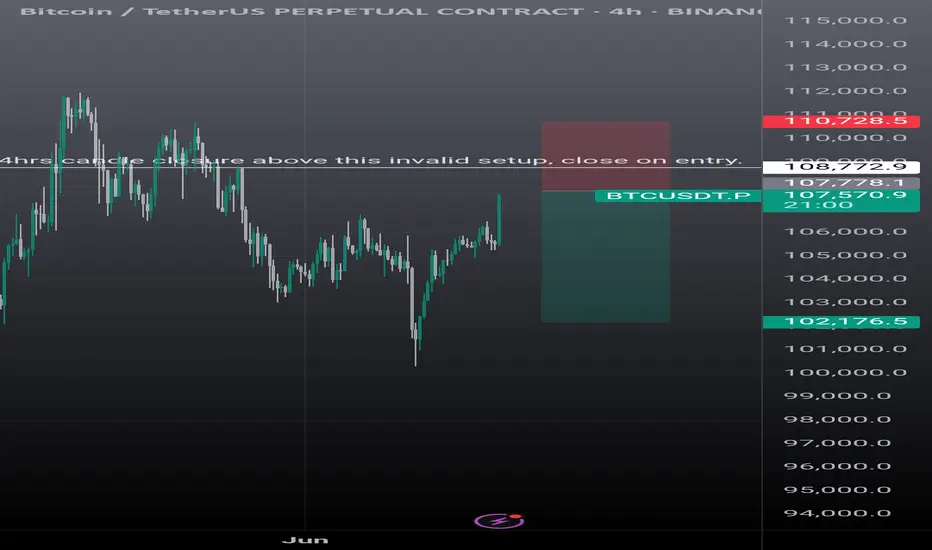
FREE MONEY! My next trade ideasNew Week. New Opportunities. 🚀
As we step into the second week of June, we’re fully prepared to take advantage of the markets — with both long 📈 and short 📉 setups ready in advance.
✅ We caught most of the major moves last week — now let’s see if the trading gods 🙏 are on our side again.
📊 Charts are ready — feel free to download them, and drop any trade setups you’re watching in the comments below.
🟠 BTC is on the road to redemption after the SFP at the daily higher low.
Will it break 4H structure? Or reverse back down? Either way, we’re prepared and positioned for both scenarios.
🗓️ This Week’s Schedule:
Classes are expected on Monday, Tuesday, and Friday.
⏰ Exact times TBC — stay tuned.
