Bitcoin Trading Strategy for Monday's OpeningThe Bitcoin market as a whole showed a volatile trend this week. The price opened near $105,000 at the beginning of the week, and then fluctuated up and down under the combined influence of news and market sentiment. The highest touched $107,000, and the lowest fell to $101,000. From a daily chart perspective, the price hovered near key levels multiple times, indicating a fierce game between bulls and bears in the market. In terms of trading volume, it decreased compared to last week, suggesting that market participants have a certain wait-and-see attitude at the current price level.
Comprehensive analysis shows that the Bitcoin market will continue to maintain a pattern of multi-empty games next week. If macroeconomic data is positive, there are no major negative news on the policy front, and market sentiment remains stable, the Bitcoin price is expected to break through the short-term resistance level of $105,500 and challenge the resistance level of $107,000 or even higher.
Humans need to breathe, and perfect trading is like breathing—maintaining flexibility without needing to trade every market swing. The secret to profitable trading lies in implementing simple rules: repeating simple tasks consistently and enforcing them strictly over the long term.
BTCUSDT.3S trade ideas

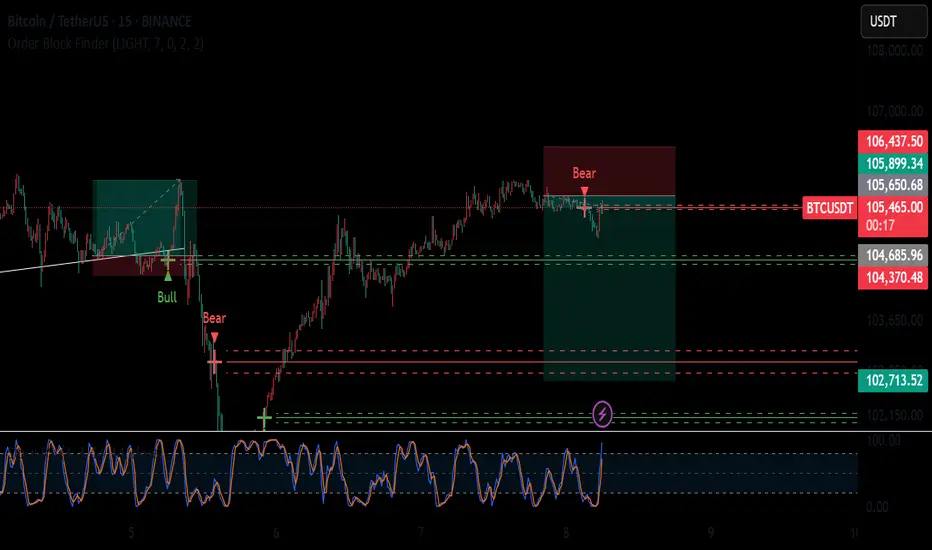
Btcusdtbtc beat most of the traders expectation as btc did massive sell two days ago and pick up to seek higher price again...
so am still expecting btc to seek lower price even if is going to continue his bulish movement again. so the bias is to buy and to sell later
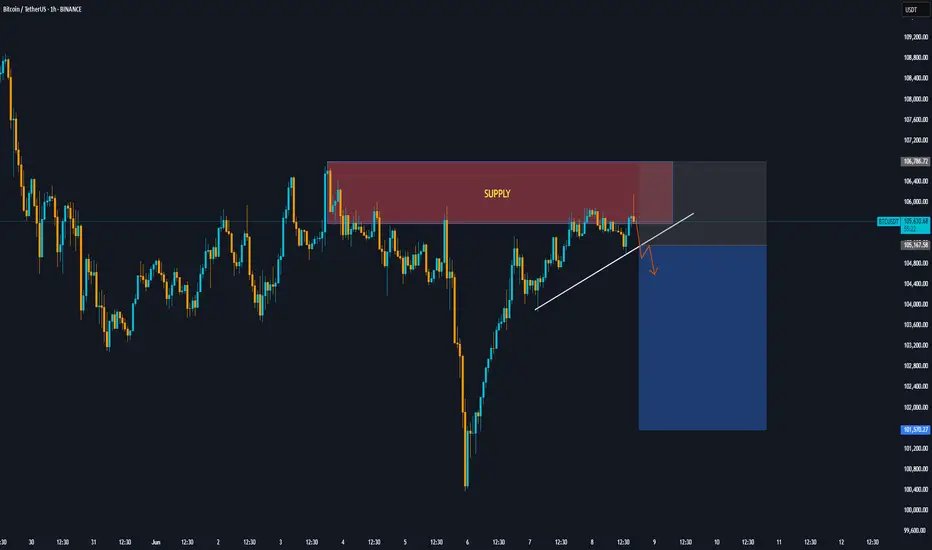
BTC H1 Short area Bitcoin is in a strong supply range, and breaking the trendline allows you to enter a sell position to lower demand areas.
enjoy traders :)
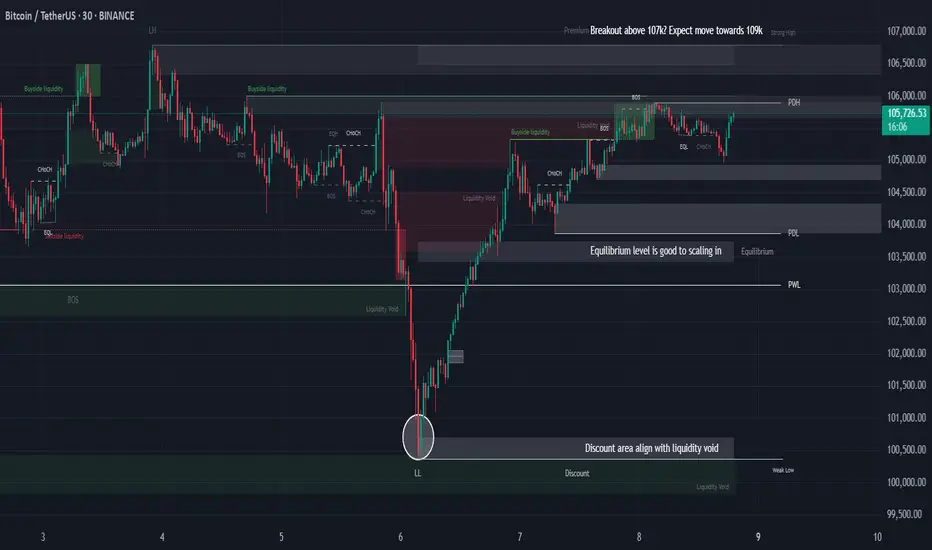
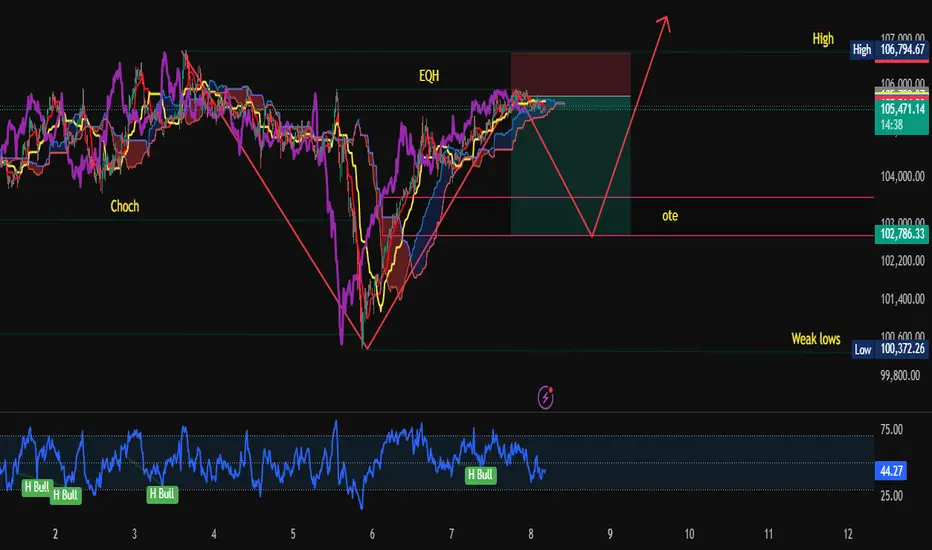
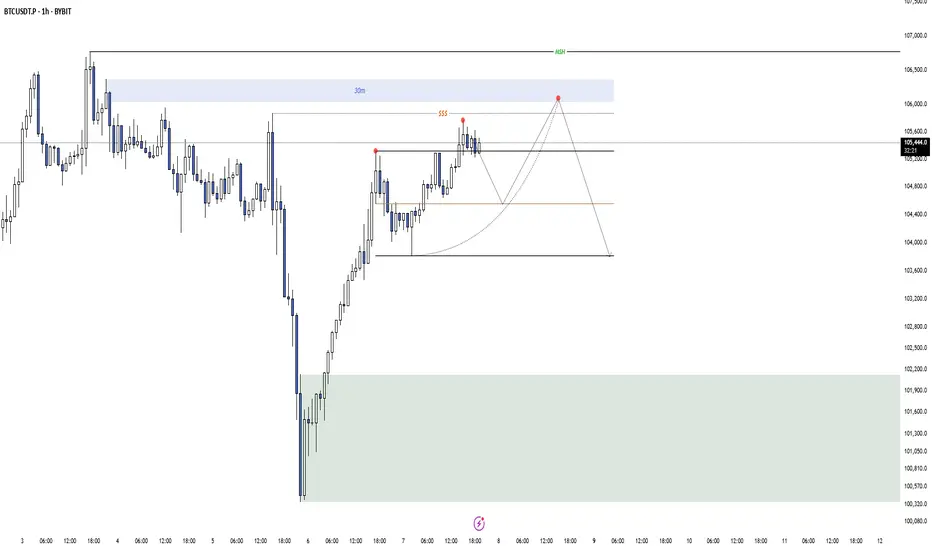
BTC at Resistance, Correction or Breakout to 109K?Yo traders! 😎 Here's a clean smart money breakdown of BTC/USDT on the 30-min chart. Be ready—this could be the calm before the pump or the trap before the dump 🧠⚡
🧠 Key Observations:
1. BTC is currently at a resistance zone, reacting near 107K, which is the Previous Daily High (PDH) 🧱 → Be cautious here—a rejection could trigger a correction.
2. If price successfully breaks above 107K, the next liquidity magnet is at 109K, right at a Strong High level. That’s where price might get drawn to 🚀
3. In case of rejection or correction, we’re watching the equilibrium zone (EQ) as a high-probability scaling-in area 🎯 → It gives a better risk-reward and aligns with the overall bullish structure.
4. Look how the discount zone aligns beautifully with a liquidity void 🤝 → Smart money loves these confluences. That’s where they often step in.
5. Previous structure shows a Lower Low (LL) followed by a strong displacement upward, indicating a potential Change of Character (ChOCH) ➡️ Bullish Bias 🔄🐂
6. We also got a clean sweep of sell-side liquidity before price pumped. This confirms accumulation by smart money below the EQ area 📉💰
⚡ Summary:
🔺 Above 107K = Breakout Potential → 109K Target
🔻 Rejection at 107K = Watch EQ zone for re-entry
⚠️ Don't rush in at resistance—wait for confirmation (BOS, retest, or signs of strength)
💬 What’s your take? Are you waiting for the breakout or prepping to buy the dip? Let’s chat below 👇
And make sure to follow for more clean, structured BTC updates like this 🔥📊
Bitcoin 4H – Battle at Resistance | Two Perspectives 🧪 1. 🐸 Miracle’s View – “Altcoins' Prophet” 🐸
"Yo fellow degenz! It's me – Miracle from the meme-coin clan, and I'm sniffing something bullish... but not so fast!"
Price is tryin’ to break out of a wicked resistance zone.
That red line? 🔴 It's not ketchup — it's the final boss trendline, and BTC must defeat it with volume ⚔️
Market sentiment is bullish, but Miracle says: "Wait for a clean break and retest — no fomo attacks!"
🔍 MA50 (gray snake) is curling up like a noodle of support. If we bounce off it again → 🚀 108.5K, 111K and beyond!
📉 BUT — if price gets rejected and drops below 105K… we might slide to 103.8K (or worse, the dungeon at 101.7K) 🕳️
📢 Miracle Rule: “Breakout without a retest is like a meme coin without a rug — rare!”
🔮 TL;DR:
🟢 Above 106.7K = Go time, ride the wave!
🔴 Below MA50 = Watch your bags, exit or short it with a stop above the resistance!
🔍 2. Unknown Analyst’s Neutral View (Clean & Pro)
BTC is challenging a major resistance zone between ~105.7K–106.7K.
A strong breakout above both the horizontal zone and descending trendline could initiate the next bullish leg.
MA50 and MA200 are offering dynamic clues:
MA50 holding = bullish confirmation if price closes above resistance
Failure to hold = a likely revisit to lower demand levels
Confirmation needed:
Clean candle close above resistance zone
Followed by a successful retest of the zone or MA50 as support
If rejection happens here → Potential retracement to 103.8K or lower (support & previous consolidation)
🎯 Targets on Breakout:
108.5K (local high)
111K (liquidity zone)
Extension possible if volume supports it
🧠 Dual Insight:
"Same chart. Two voices. One truth: Trade with logic — not emotion."
💬 Let us know in comments:
Are you team 🐸 Miracle or team 🧠 Unknown Analyst?
🎬 TradeWithMky – where altcoins speak louder than Bitcoin!
#Bitcoin #CryptoAnalysis #BTC #TradingView #TradeWithMky #MiracleShot #AltcoinArmy

TradeWithMky — Where Altcoins Speak Louder Than Bitcoin!Welcome, fellow trader, to TradeWithMky — the only TradingView realm where charts are alive, trendlines whisper secrets, and candles burn with prophecy.
Led by Miracle, the pepe-faced meme wizard of TA, we don’t just follow the market — we ride it like a shooting star across the altcoin galaxy 🚀.
💡 Here’s what you’ll unlock inside this spellbook of price action:
🌀 Magic Channels & Trend Spells
🔄 MA50 Rejections & Support Summons
📉 Fakeouts Exposed, Traps Uncovered
📈 Breakouts Blessed by Fibonacci Spirits
🧠 Deep-dive TA with a twist of humor, mystery, and meme-lore
From the shadows of fake breakouts to the light of uptrend awakenings, our charts tell stories — and you are the hero. Whether you're a seasoned wizard or a humble apprentice, here you’ll find something rare:
Real analysis. Real magic. Real fun.
🎯 Targets that work. Levels that matter. A vibe you won’t forget.
👉 Follow now and let Miracle show you why:
@TradeWithMky – Where Altcoins Speak Louder Than Bitcoin!

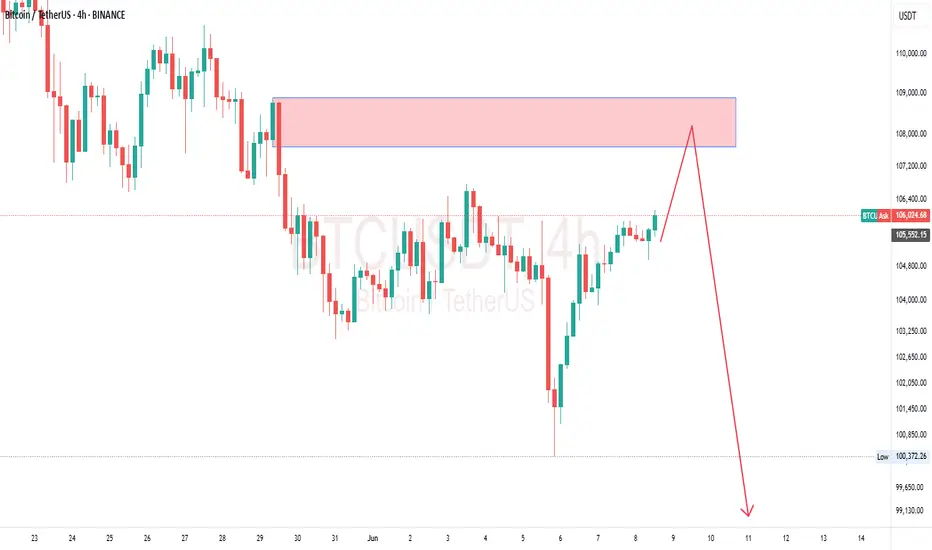
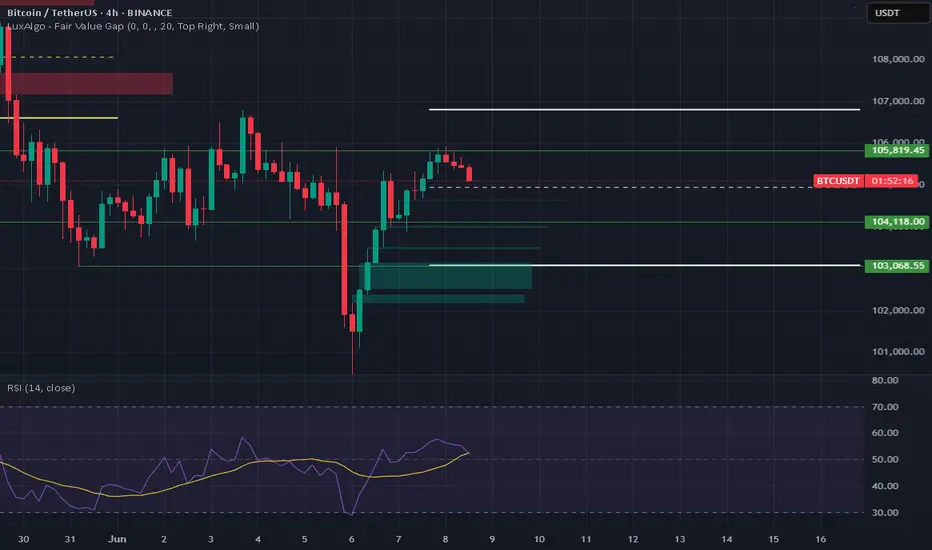
BTC/USD Short: Bearish Flag Targets $101,000Symbol: BTC/USD
Timeframe: 4H
Trade Type: Short
Entry Price: $105,700
Take-Profit: $101,000 (4.4% move, 22% with 5x leverage)
Stop-Loss: $106,500 (0.8% risk, 4% with 5x leverage)
R:R: 5.5:1
Leverage: 5x
BTCUSDT Analysis – Pivot 103k/106k, strategy and key zones__________________________________________________________________________________
Technical Overview – Summary Points
__________________________________________________________________________________
Momentum : Bullish structure on 1D/12H (MTFTI “Up”), but short-term consolidation (1H-2H “Down”). Momentum exhaustion observed.
Key Supports/Resistances : Resistances: 105287.8 / 106743.9 / 109952.8 / 111949. Supports: 103033.3 / 100333.3 / 93337.4. Repeated rejections below 105-106k, active testing of 103-100k supports.
Volume : Normal or slightly elevated on all timeframes. No capitulation or euphoric extremes detected.
Multi-TF Behaviour : Strong sector leadership (Risk On / Risk Off Indicator = “Strong Buy” across all frames; growth stocks > market). No behavioural anomalies on ISPD DIV. High-cycle consolidation below resistance.
__________________________________________________________________________________
Strategic Summary
__________________________________________________________________________________
Overall Bias : Neutral/bullish as long as 103k/100k holds. Bullish momentum intact, but short-term caution warranted.
Opportunities : Defensive buys/technical pullbacks above 103k; scalp/range trading 103-106k.
Risk Zones : Confirmed breakdown below 100k or acceleration in LTH distribution.
Macro Catalysts : Next FOMC June 17-18; no major short-term events identified (recent neutral macro, FOMC is key for swings).
Action Plan : Prioritize strict stops (≥3%) near pivots, consistent monitoring of behaviour/volume. Avoid overexposure pre-FOMC.
__________________________________________________________________________________
Multi-Timeframe Analysis
__________________________________________________________________________________
1D : Structuring range below 109952.8-111949 resistances. Bullish HTF trend, but momentum pausing. Average volume. Risk On / Risk Off Indicator “Strong Buy”. No extreme ISPD signals (neutral).
12H – 6H : Consolidation; supports holding, no euphoric confirmation (normal volumes, ISPD DIV neutral). Sector leadership unchanged.
4H : Compression below 105287.8. Moderate volume. Defensive resumption on supports. MTFTI bullish. Dynamic risk: monitor for sell-side capitulation.
2H – 1H : Technical correction, active retest of 105k (range 103-105k). Absorption volume. MTFTI “Down”.
30min – 15min : Short-term positive bias above 103k. Risk of false break if volume remains low. Risk On / Risk Off Indicator “Buy”/“Strong Buy”.
Cross-Indicators : Market leadership confirmed: Risk On / Risk Off Indicator = Strong Buy on all frames >15min. No excess behaviour or significant divergences detected. Key ranges: 103k-105k. On-chain: heavy LTH profit-taking but no panic.
Summary : BTC market in post-cycle-high congestion phase, structurally robust, but momentum recalibrating with fewer “easy trades.”
__________________________________________________________________________________
Cross insights & on-chain summary
__________________________________________________________________________________
On-chain (Glassnode) : Top at $111.8k, correction to $103.2k by LTH profit-taking. Spot accumulation on $103.7k/$95.6k. Upside limited unless fresh buying flows return.
Macro events : Awaiting FOMC; no recent surprises. Price action and levels dominate short-term strategy.
Stops/invalidation : Swing long defended at 103k/100k (stop <100k H4). Partial short/sell below 106743.9/109952.8. Dynamic targets: 106-109.9k; extension: 111.8k if breakout on volume.
__________________________________________________________________________________
Conclusion & Actionable Plan
__________________________________________________________________________________
Market condition:
- High consolidation, ranging below major resistances.
- Long-term bullish, short-term momentum fading.
- Neutral/bullish if 100-103k holds.
- “No macro — only levels” until FOMC or volatility catalyst.
Tactical decision:
- Trade technically, stops ≥3% under supports.
- Defended buys at 103k (stop <100k), partial profit 106-109k.
- Continuous monitoring of volume/on-chain zone reaction.
- Aggressive exit/hedge below support, target 96k/83k.
__________________________________________________________________________________
100% analysis based on TradingView multi-TF, Glassnode on-chain, macro calendar and risk management.
__________________________________________________________________________________

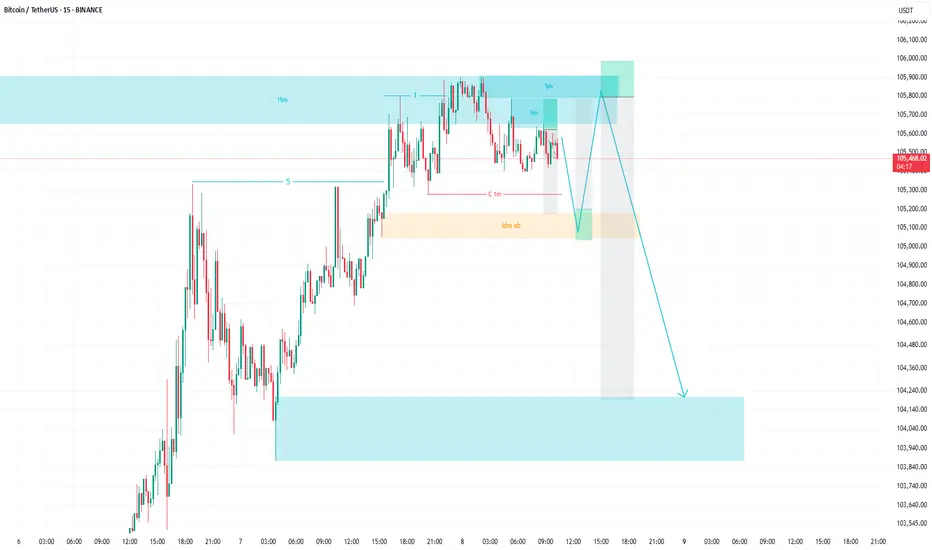
BTC short scenario BTC will drop to 104.2k first, then maybe we'll see 103k if lucky. Range high range low rotation.
BTC/USD DAILY MARKET OUTLOOK Price recently pulled back to $100k price level. Even though investors are still optimistic about BTC on longterm. We’re still having a price moving in a flag pattern which Indicate a possible fallback to $102k or $103k before investors will add more longs.

BTC/USDT signal by tiqgptMARKET NARRATIVE: Analyzing the provided charts for Bitcoin against Tether (BTC/USDT) across multiple timeframes (1H, 15M, 5M, 1M), we observe a consistent narrative of price action that reveals the strategic maneuvers of institutional players. Starting with the 1H timeframe, the price displays a descending pattern, marked by a series of lower highs and lower lows, indicative of a dominant bearish market structure. This is further validated by the presence of descending mitigation blocks, which have been revisited but not significantly breached, suggesting a lack of buying interest at these levels.
Descending into the 15M and 5M charts, we see a more granular view of the bearish sentiment, with price action creating tight consolidation zones below previous mitigation blocks, signaling potential accumulation by smart money before further downward movement. The 1M chart offers the most detailed view, showing multiple liquidity sweeps below recent lows, which likely serve as inducements to trap retail traders into unfavorable positions before a potential expansion phase.
INSTITUTIONAL THESIS: The consistent bearish structure across all timeframes suggests that smart money is potentially targeting lower liquidity pools below the current price levels. The repeated liquidity sweeps and the formation of tight consolidation zones below mitigation blocks indicate a preparation phase for a further push downwards. This strategic positioning by institutional players aims to capitalize on induced retail selling pressure, allowing for accumulation at premium prices before a likely bearish continuation.

BTS Fibonacci tracing to identify the OTE zone from the lowest point to the highest point. We perceive the crossing of the red tenkan and the yellow kijun moving from the bottom that joins the cloud.
Short Signal – BTC Structural UpdateZemoG Trading Group Short Signal – BTC Structural Update
Bitcoin (BTC) reached the left shoulder wick at 105.8k, a key structural point we’ve been watching closely. This price action signals the market is preparing for its next decisive move — likely to complete the right shoulder of a developing head-and-shoulders pattern, a classic reversal structure rooted in market psychology.
As always with the ZemoG Strategy, we approach price from a structural and cyclical perspective, not just candlestick behavior. With BTC completing this setup, it further validates short momentum as we begin targeting lower levels.
With volume exiting the market, we’re now initiating a short bias, positioning for the next high-probability move.
🟥 Short Entry Trigger:
• A confirmed close below 105.8k on the 555-minute timeframe with structure continuation.
🎯 Short Targets:
• 104.6k – First liquidity pocket
• 104.2k – Support mirror from previous micro high
• 103.4k – Internal structure base
• 103.2k – Full shoulder completion zone
• 102k – Volume void level
• 101.4k – Deep liquidity sweep
• 100.3k – Main target and completion of right shoulder
🔒 Stop Loss:
• 106k – Just above structural invalidation; protects us from head-fake moves and liquidity traps.
We don’t chase price — we position ourselves for high-probability trades rooted in measurable structures, harmonic symmetry, and mirrored movements in time.
This unfolding move could be part of a larger cyclical rotation within BTC’s macro structure, which we’ve been tracking since the ATH at 111.97k. If the right shoulder completes and breaks down further, we may see momentum shift toward deeper retracement levels, opening the door to future setups with elevated reward potential.
Stay patient, focused, and aligned with the rhythm of the market.
ZemoG Trading Group – Sacred Structure. Timeless Precision.

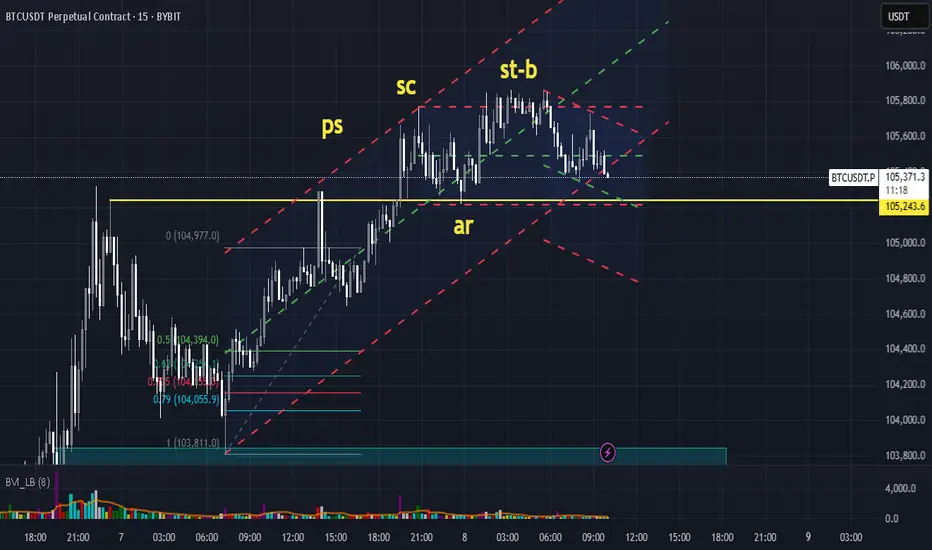
BTC M15 distribution1. PS (Preliminary Support) –
highest volume
2. SC (Selling Climax) –
SC at lower volume and have a bull back
3. AR (Automatic Rally
after SC price is going up with a strong bull back
4. ST-B (Secondary Test in Phase B) –=
Waiting a Spring before crate a phase C
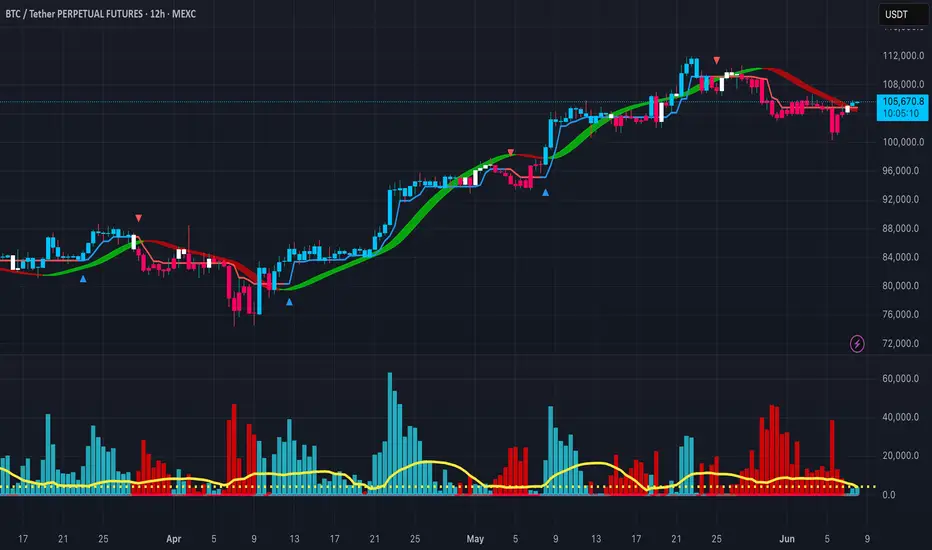
BTCUSD – Pressure is Building! WAE Squeeze Before the Storm?🔥 BTCUSD – Pressure is Building! WAE Squeeze Before the Storm?
Pair: BTC/USDT
Timeframe: 12H
Indicators: Waddah Attar Explosion + Trend Ribbon (Red/Green Zones)
📈 Market Snapshot:
Bitcoin has pulled back from the $112K region and is consolidating below the red resistance ribbon. But beneath the surface, the WAE histogram shows compression, signaling a potential breakout is on the horizon.
⚙️ Key Technical Signals:
✅ Trend Ribbon: Transitioned from red to flat — market is looking for direction.
📉 Volume Squeeze: WAE histogram is tightening under the yellow baseline, often the calm before major volatility.
🔵 Last Bullish Impulse: Price rallied strongly from $92K to $112K — this current zone could be a healthy bullish retracement.
📍 Support Levels:
$103,500 – short-term support
$100,000 psychological level
🚀 Breakout Level: $107,200 (clearance above red trend ribbon)
🎯 Strategy:
Wait for breakout confirmation of WAE (histogram bars break above yellow baseline with volume surge).
Entry zone: $106,000 – $107,500 (after confirmation)
Stop Loss: $102,800
TP1: $110,500
TP2: $114,800
TP3: $120,000+
💬 Caption:
Bitcoin is coiling... WAE shows compression.
Red zone acting as a lid, but smart traders know:
Pressure = Potential. 💣
Once the histogram bursts above the yellow line — it's time to move.
Are you ready for the breakout?
Bitcoin H4 Timeframe Update
Bitcoin overall panda fam is forming a possible bullish structure but still this is consolidating no confirmation yet for next possible impulse up 👀
Possible Scenario #1 — Correction phase for confirmation 🍃, Possibly panda fam we will experience first a rejection on major trend resistance then bounce at PBr1 support ranging approx 102.3k - 102.7k, If we respect PBr1 support keylevel possible there will be a strong bounce and breakout on the follow days / weeks.
Possible Scenario #2 — Aggressive breakout Aggressive move 🚀, This will only happen panda fam if we consolidate near resistance for example on the pink mini channel then next follow days possible there will be a aggressive breakout above trend major resistance.
Possible short term target if ever PBr2 keylevel ranging 109.3k - 109.7k area. As per my own opinion panda fam hanggang dyan na muna mahirap ipredict yung market kung pangunahan mo ng maraming future movement only make a analysis malapit sa present price action for more better accuracy and confirmation.
ℹ️ : @pandanambawan

BTC is heading toward ATH On the weekly timeframe, I can see we’ve entered an FVG, swept the liquidity in front of it, and now there are no obstacles left to move higher.

Finally Falling Wedge Broken on the right LevelFalling wedge is a strong figure, but when break on a right level of fibonacci can be really strong, first target is the top of the wedge, if the price will stay above the last high btc can go up with a sense and not with pump and dump
wait a retracement on 15-30 min chart and long it with max 10x leverage
stop loss is the end of wedge

BTC 07.06.25I would expect something like this to play out for BTC over the weekend. Until there is a BOS above 106.777$ i expect more lows to form an accumulation model.
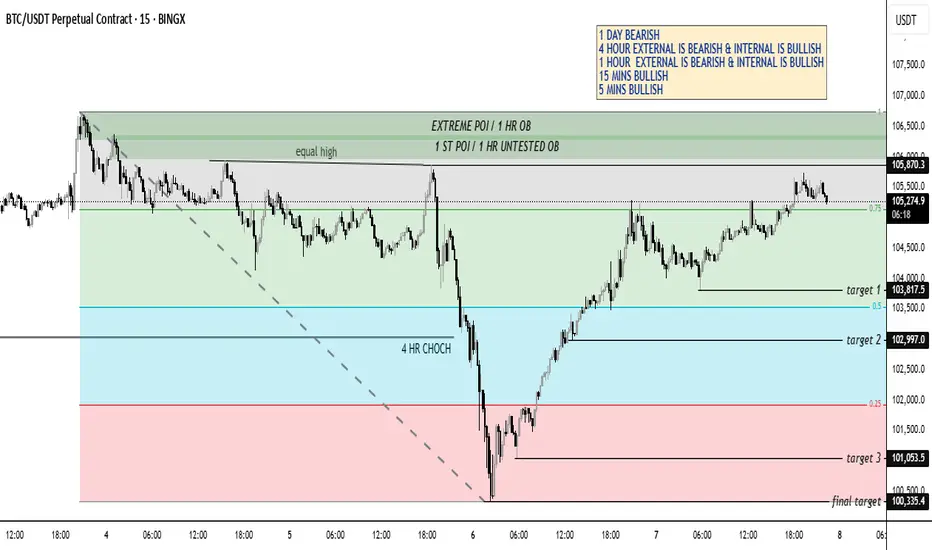
BTCUSDTP ADVANCE ANALYSISBelow mentioned is for educational purpose and is not a financial advise.
BTC seems to be very bullish. However if you look at it closely, you will discover that the larger time frames of 1 day, 4 HR and 1 HR are still bearish and all the bullishness in only in the internal structures. The price is currently in discounted range and we should wait for internal price action to align with external. You can wait for the liquidity sweep above the equal highs and a tap in any of the above two POIS which is 1 HR order blocks. Let the price shows us a choch on 15 mins time frame and a retest combined with additional confirmation will be our entry for shorts targeting as mentioned on the chart.
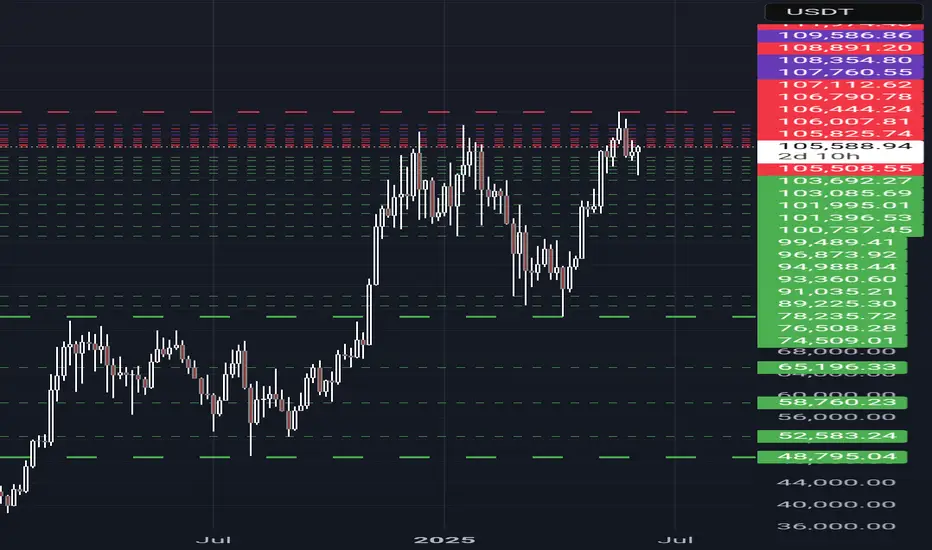
BTC Market Wicks & Key Levels
ZemoG Trading: Market Wicks & Key Levels 🔮📊
Please note:
At ZemoG Trading, we don’t concern ourselves with market direction. Whether the market moves up or down, we embrace both long and short opportunities with precision and patience. Our focus is on positioning for high-probability entries based on market structure and wick reactions.
---
🔄 Current Market Outlook:
From our perspective, the market has been completing a significant structure. We're anticipating a revisit to the 100.7K wick level. If price closes below that, we continue to expect a deeper correction toward our primary target of 74.5K.
However, as price continues to bounce upwards, it’s essential to remain dynamic and present. If you are currently in a long or planning to enter one, it’s important to observe how price behaves around key wick levels to validate the continuation of the move.
The same applies if you’re preparing to go short — we are watching for how price interacts with major historical wick levels.
---
📉 SHORTS – What We’re Looking For:
When price action reaches these wick zones, we are watching closely for:
A candle to wick above a key level, then fail to hold,
Followed by the formation of a new upper wick, signaling a potential reversal in market direction.
---
📈 LONGS – What We’re Looking For:
For long confirmations, we want to see:
Price reaching a key wick level,
Followed by new bottom wicks forming, indicating strong buying pressure and upward continuation.
---
🔑 ZemoG Key Wick Levels to Watch:
Upper Levels (Watch for short signals):
105.5K
105.8K – Key Level
106.8K – Key Level
107.1K – Key Level
108.9K – Key Level
109.5K
Lower Levels (Watch for long signals):
104.6K
104.2K
103.4K
103K
102.3K
100.6K
---
Stay tuned for our next post, where we’ll dive deeper into how wick reactions at these levels align with ancient cycle patterns and harmonic price echoes 🔁📐
As always—"Wicks don’t lie."
— Team ZemoG 🔮
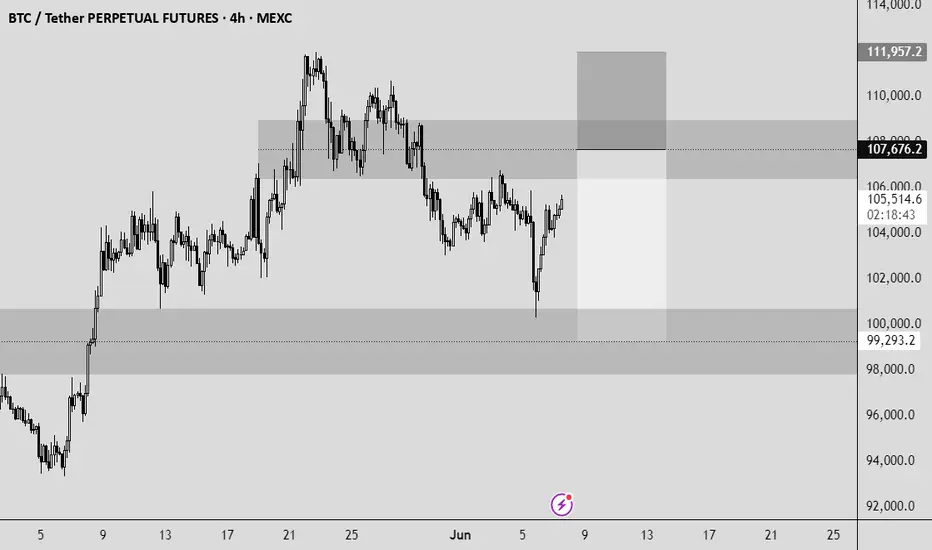
BTC short I expect the price to go up during the weekend and tap into the Weekly orderblock I marked up on the chart at from there I would like to go short and take profits at EQ of weekly gap.
TP:99293.2
SL:111957.2
Entry:107676.2
GLHF, do not overleverage!