BTCUSDT.3S trade ideas
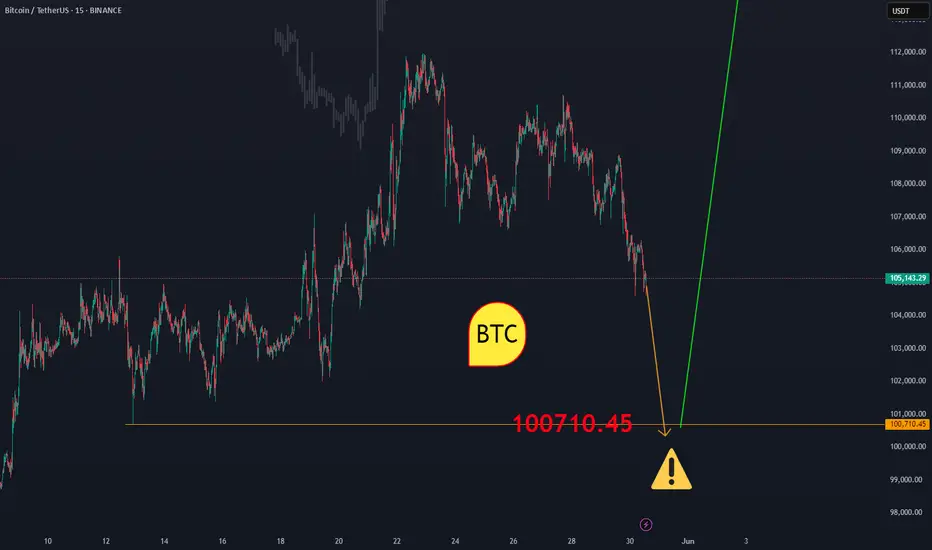
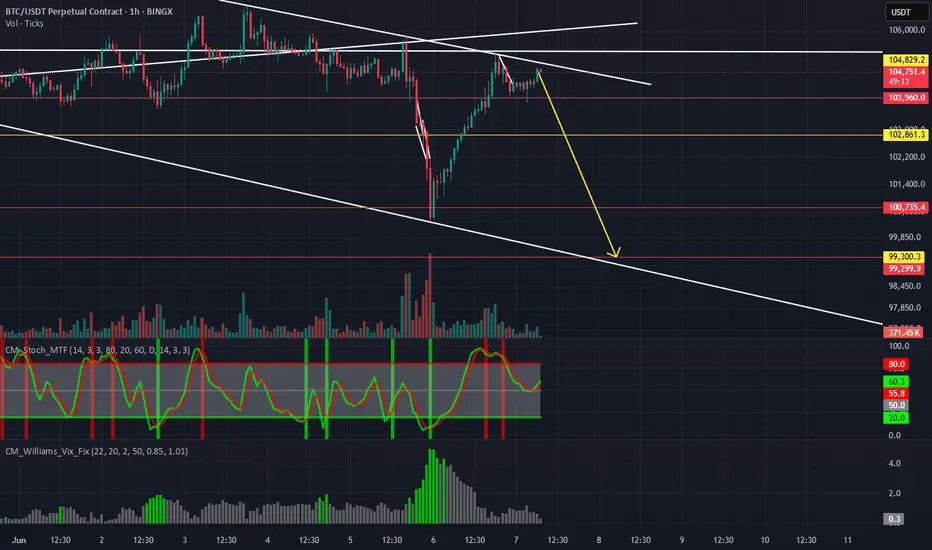
BTCUSDTBitcoin may be looking to complete the downward correction from the $101,000 price range to $99,000 and then begin a long-term upward trend. Pay close attention to the extent of the correction and don't give in to fear or greed.
In any case, it should go to $1300,000.
BINANCE:BTCUSDT
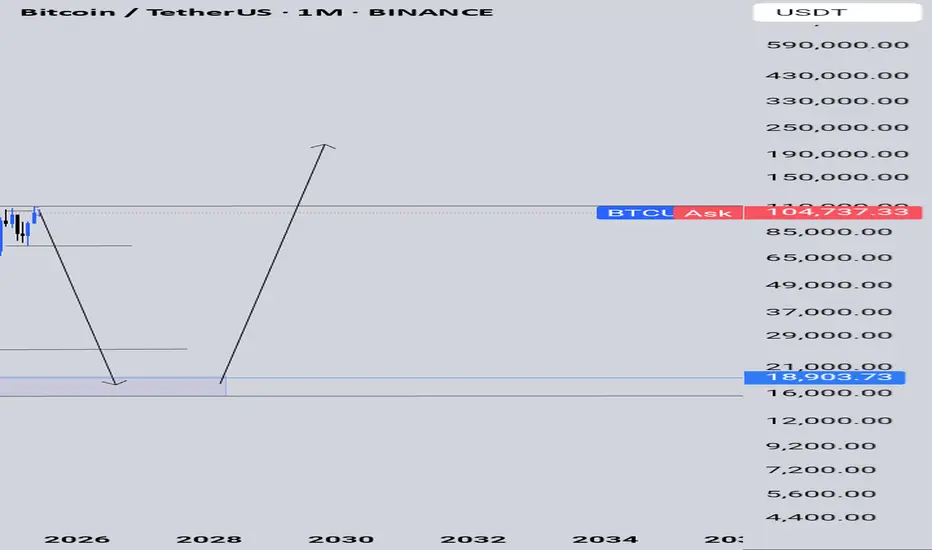
The market is still bullish. $BTCWe got out of the bear market cycle so quickly that I don't think anyone has understood yet...#BTCUSDT

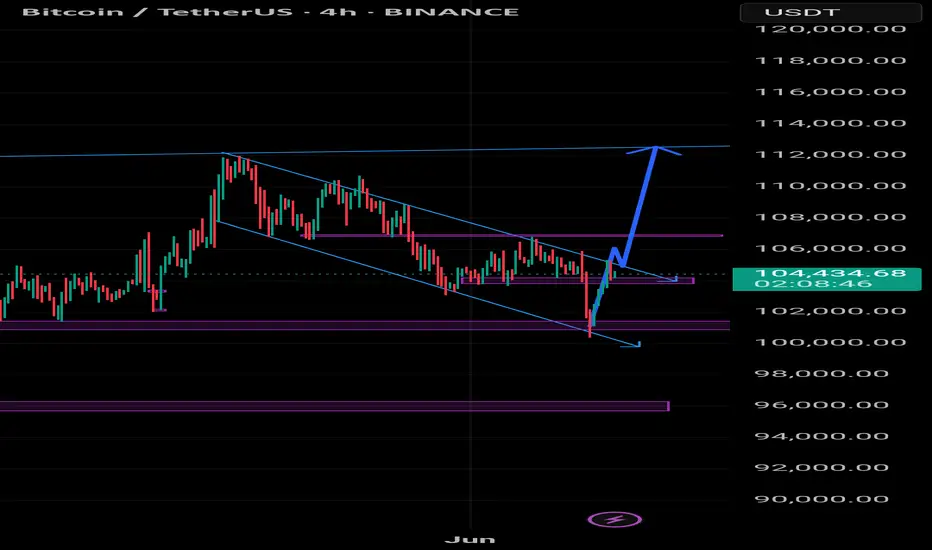
BITCOIN 2024/2025THE current chart of btc shows a strong sign of recovery into 118k and 120k after updating 111k daily RED ascending supply roof of the structure, we need one more buy confirmation to see strong bullish healthy candles.
the bulls defended 100k level as that level represents a strong demand floor and break and a close below it will follow another layer of demand 96k zone
#btc #bitcoin

$BTC – Reclaim Test & Momentum Watch (4H)
📊 CRYPTOCAP:BTC – Reclaim Test & Momentum Watch (4H)
🔍 On the 4-hour timeframe, CRYPTOCAP:BTC is retesting the broken symmetrical triangle resistance. If price manages to reclaim this structure, it could open the gates for a bullish leg up.
🟠 At the same time, price is navigating within a descending channel. A clean breakout above the channel’s resistance — supported by strong momentum — would validate a potential trend shift and strengthen the bullish case.
⚠️ This dual structure — reclaiming the symmetrical triangle while challenging the descending channel — is critical for the next major move. If the reclaim fails, short-term bearish pressure could continue. However, if buyers step up, this could mark the start of a new impulsive wave.
👁️ Keep a close watch — the next move will shape market sentiment!

BTC bearish ideaBTC is still moving inside the downward channel and I don't expect it to break above, bitcoin will fall back down to the lower trendline.
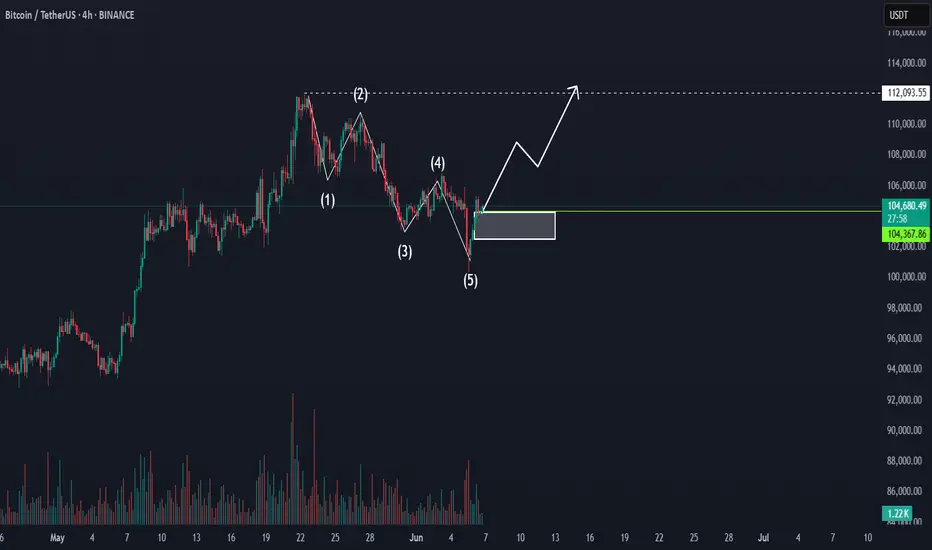
BITCION TO $112,000Hello! Analyzing the Bitcoin price again. BTC's price action has remained in a very good consolidation zone, where it has shown strength and a real intention to remain bullish. Currently, Bitcoin is declining slightly, attempting to capture the latest liquidations to launch a strong bullish movement. The area of greatest interest is near the previous high. Volume and buying interest remain stable, and therefore, on a daily chart, the projection would remain bullish, without ruling out liquidity draws near $100,000.
Disclaimer: This is solely the opinion of a trader. It is not an investment recommendation.
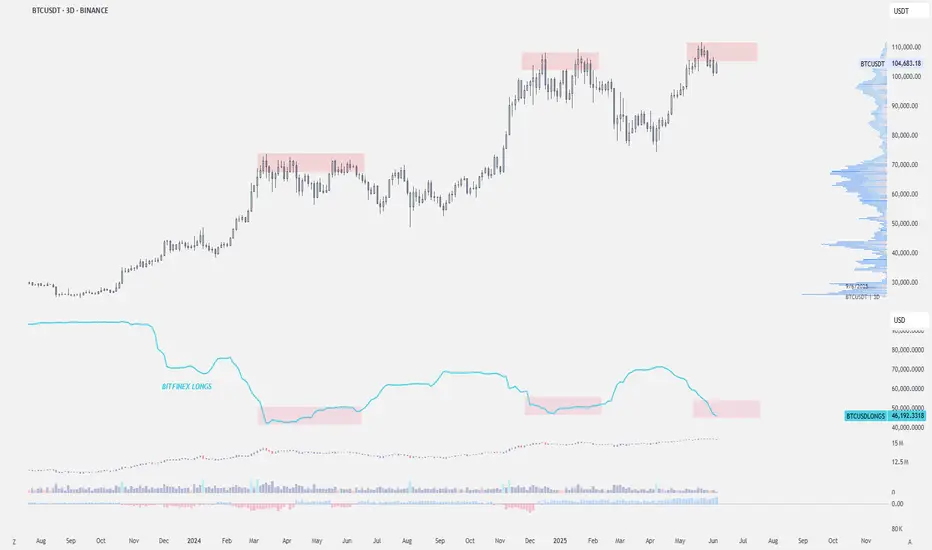
Bitfinex closed $BTC longs — local top?This Bitfinex Bitcoin long positioning is worth monitoring.
Each marked price top aligns closely with a local peak or plateau in Bitfinex longs, followed by distribution or a pullback.
Currently, Bitfinex longs have again plateaued or declined, just as BTC is forming a potential local top.
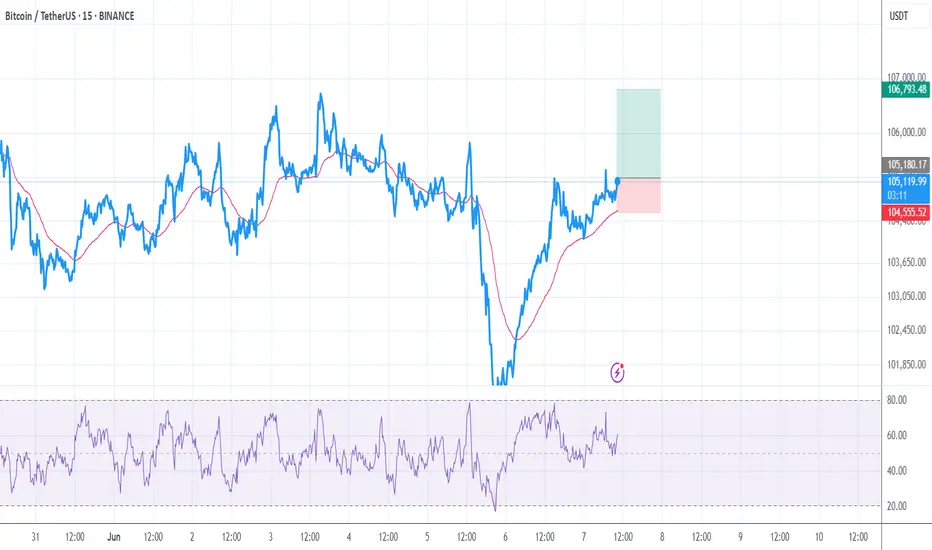
Bitcoin setup for next moveBTC 1day is in a larger accumulation range within a macro bull phase For a confirmed recovery from current levels price will need to break out of this 104.5k sideways move to reclaim the 106.8k level with a successful retest to move on upwards and test the ATH 112k area resistance If the 106.8k resistance breaks price down or the retest fails then we likely follow the red arrow to 100.5k first support level in the green box We would need to bounce hard from 100.5k in a classic bottom V pattern to follow the green line back to test the 106.8 resistance for the second time on this idea Obviously if support fails at 100.5k we follow the bottom red arrow down to the 95-93k high demand area in the green box In support of the 100.5k solid support area we see that this level will complete a local Head & Shoulders pattern for a solid bottoming The key levels are 106.8k resistance and 100.5k support creating this recent accumulation range It could also be argued that we are in a larger Head & Shoulders pattern with the bottoming at the 95-93k high demand area...have fun the Institutions are here in force and retail is nowhere to be found
Btcusdt 4hr time frameA bearish H&S pattern is forming. Minor and major gaps at 98k and 86.5k still need to be filled, which may delay an all-time high.
Still far from 100 daily ma.

BtcusdtCompletion of the current bullish flag pattern could lead to a potential increase in price in btc
BitcoinAm expecting more drop in price for btc and my buy green bar zone could be the demand you are looking for.
As the dollar index holds 98 $ firmly we could be seeing btc correct below 100k.

BTC — Compression Into Downtrend Line, Key Demand Zone BelowPrice is compressing into a macro descending trendline, with recent strength off the $101.4k key demand zone. Structure shows potential for continued chop before a proper breakout or rejection decision is made.
🟩 Key Demand Zone: $101,300–101,800
• Previous strong reaction area
• Aggressive bids expected here again if retested
• Still valid while above — structure remains intact
📉 Trendline Resistance: ~$105.5k
• Critical compression point
• Watch for reaction here — breakout = bullish trigger
• Rejection = likely continuation of chop or lower retest
🔁 Playbook:
Rejection from trendline → range & chop → sweep demand
Clean breakout above = targeting $107k+
Deep flush back into $99–101k zone = buy opportunity
📌 Compression into major levels sets up explosive follow-through — either way, volatility incoming.

BTC/USDT – Short-Term Long SetupBTC/USDT – Short-Term Long Setup
Bitcoin is bouncing off key support and showing bullish signs.
I'm looking for a short-term long position targeting $105,650.
🟢 Structure looks solid — momentum is building.
📈 Clean chart, tight setup.
🔔 Follow for more sharp entries and real-time analysis!

Bitcoin Prediction - WARNING - Short Set-up Looming? We are spectating something serious on Bitcoin looming right now! Confirmations explained in the video!

Bitcoin (BTC/USDT) Technical Analysis📊 Bitcoin (BTC/USDT) Technical Analysis | Back at Key Resistance
As seen on the chart, Bitcoin has once again returned to a major resistance zone — a level that has previously acted as a strong barrier to further upside. Price action here is critical and could define the next short-term move.
🟢 Bullish Scenario: Break and Rally
If BTC manages to break above this resistance, the next key levels to watch are:
$105,106 – initial resistance
$105,305 – stronger resistance that could act as a mid-term target
A clean breakout above these zones may trigger further upside momentum.
🔻 Bearish Scenario: Rejection and Pullback
If price gets rejected from this area again, we could see a short-term correction. Key support levels include:
$104,271 – first support on the way down
$103,948 – mid-range demand zone
$103,387 – next support if selling pressure builds
$102,600 – the main support level to hold for bulls
📌 Summary
Bitcoin is at a critical decision point. A breakout could trigger a bullish continuation, while a rejection might invite a deeper retracement. Watch for candle confirmation and volume reaction before entering a trade.
🔥 If you find value in these setups, follow me for daily clean charts, smart trade ideas, and real-time updates.
Let’s trade the market with logic — not hype. 🚀📈

BTC/USDT Analysis – Breakout from Sideways Range
Hello everyone! This is the trader-analyst from CryptoRobotics with your daily market update.
As expected, Bitcoin dropped to the local low yesterday. At the time, there was no sign of buyer support, and the price moved down to the next support level.
Just around $300 short of a round-number level, a strong absorption of market sell orders occurred, and we saw a rebound.
At the moment, the price has reached the range of accumulated volumes within the sideways channel — $104,500–$105,800 — which is currently positioned short. Therefore, the priority scenario is another wave of decline toward the $101,600–$100,000 zone.
If there is no selling reaction in that area, we’ll then expect Bitcoin to move to the next supply zone.
Supply Zones:
$104,500–$105,800 (accumulated volumes)
$107,000–$109,800 (accumulated volumes)
Demand Zones:
$101,600–$100,000 (previous push-volume zone + current buyer defense)
$98,000–$97,200 (local support)
$93,000 level
$91,500–$90,000 (strong buy-side imbalance)
This publication is not financial advice.

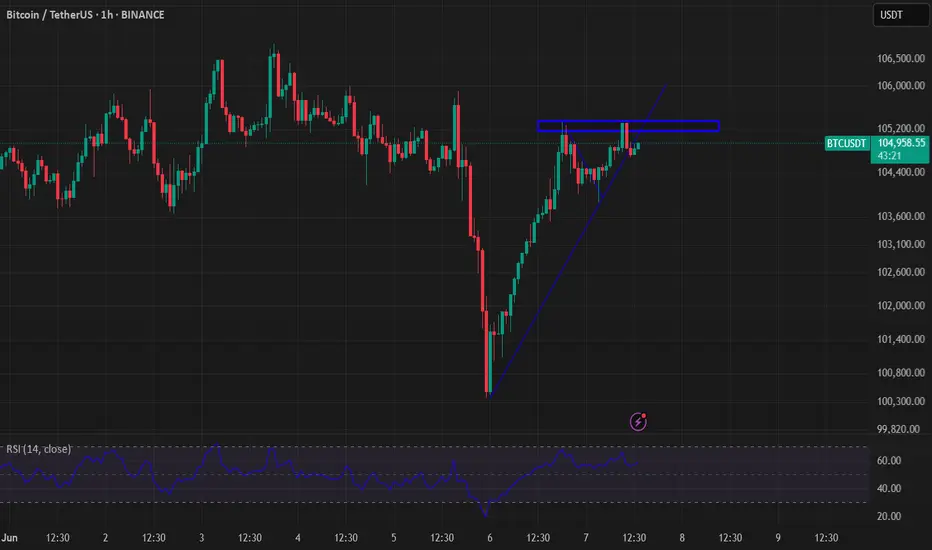
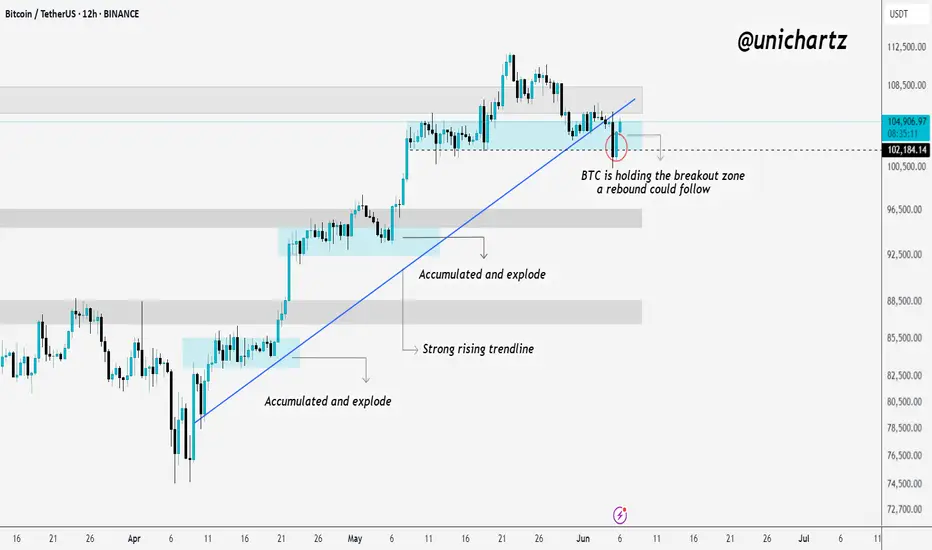
False Breakdown? BTC Eyes Rebound From Demand Zone!Bitcoin has broken below its strong rising trendline, but this move could well turn out to be a classic seller’s trap. Despite the breakdown, BTC is currently holding above the key breakout zone, which has historically triggered strong rebounds.
The price is also sitting right inside a previous "accumulated & explode" demand zone — an area where buyers have consistently stepped in. If BTC manages to hold this zone, a sharp rebound could follow, trapping late sellers and driving price higher.
However, if the support zone fails, we could see deeper downside. For now, this is a critical pivot — watch price action closely to see if bulls defend this level or if sellers gain control.
If you liked it, do comment and follow us for regular market updates.
THANK YOU
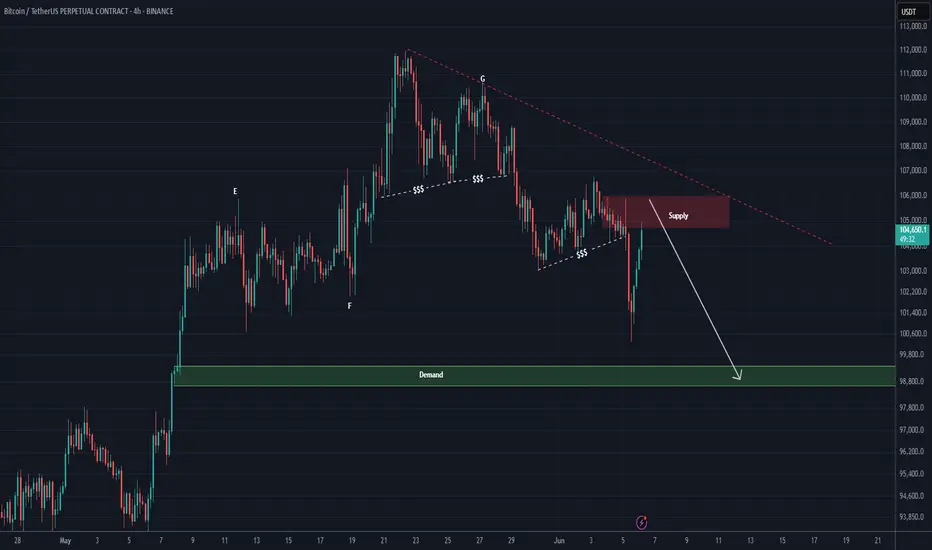
BTC NEW UPDATE (4H)After dropping toward the 100K zone and sweeping the liquidity pool, Bitcoin has made a strong rebound to the upside, putting high-leverage short positions at risk. However, it is now approaching a supply zone that could potentially push the price back down toward the 98K area.
If the market maker intends to drive the price lower and trigger a bearish scenario, this is the zone to do it from. Let’s see what happens.
A daily candle close above the invalidation level ($107,000) would invalidate this analysis.
Let’s see how Bitcoin reacts to the red box.
For risk management, please don't forget stop loss and capital management
When we reach the first target, save some profit and then change the stop to entry
Comment if you have any questions
Thank You
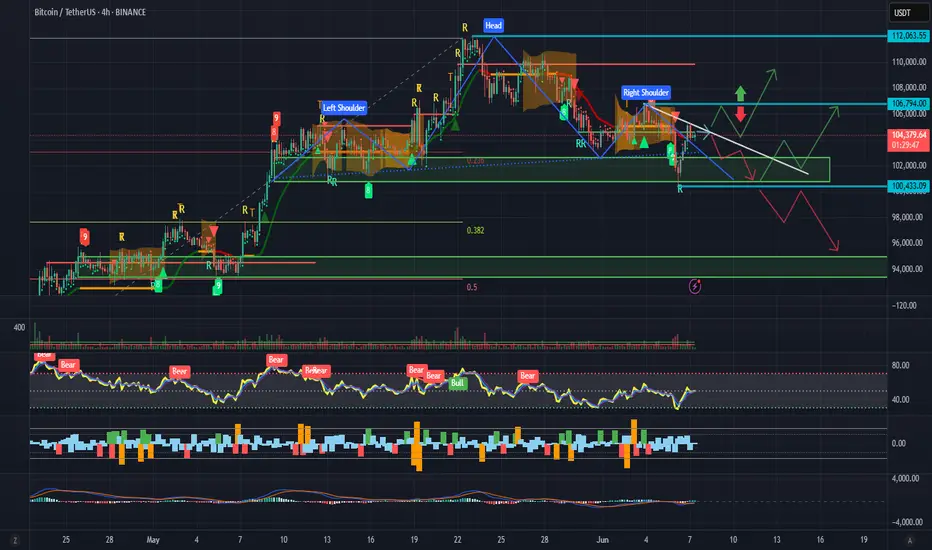
BTCUSDT reversal is not yet complete -> 95k???Despite yesterday's mini-dump, which initially appeared to be the right shoulder of the head and shoulders breaking out, the immediate retracement means the trading range sits within the range seen in the left shoulder.
We are still inside the incomplete head and shoulders pattern, and a bearish parallel channel.
If the price breaks out to the downside of the channel and the left shoulder range, the target for the retracement would be the same as the distance from the head to the neckline of the H&S pattern (y). This puts it inside the support zone of the 78.6% fib level of the continuation of the swing in the head of the pattern, at ~95k.
If the bulls thought they're through worst of it, the pain may not have even begun yet.
Even breaking out of the parallel channel might not be enough. The only thing that would signal the failure of the head & shoulders pattern is a new ATH, and that would need to happen quickly to save BTC from further falls.

BTC Correction Watch: MA100 Retest, Channel Breakdown & MA200BTCUSDT looks poised for a corrective move.
Expecting a second test of MA100 since the rally from $73k.
A pullback to the rising channel support is likely next.
If the channel breaks, we could see a decline to the green channel, and ultimately a first-time test of the MA200 in this wave.
This scenario could trigger a declining BTC.D, potentially fueling an ETH rise towards the $3200 annual pivot.
Key Levels: MA100, Rising Channel, Green Channel, MA200.
Disclaimer: Trading involves risk. This is not financial advice. DYOR.
