Next Volatility Period: Around June 22
Hello, traders.
If you "Follow", you can always get new information quickly.
Have a nice day today.
-------------------------------------
(BTCUSDT 1M chart)
The morning star candle that we often heard about when studying candles appeared.
However, since the candle has not closed yet, the shape of the candle may change.
In stock charts, there were cases where the movement could be predicted with the shape of these candles, but in the coin market, it is impossible to predict.
The reason is that trading is possible 24 hours a day.
Most candle shapes occur with gaps, allowing for a comprehensive interpretation, but in the coin market, gaps are not likely to occur, so I think there is nothing that can be known from the shape of the candles.
Therefore, it is recommended not to try to analyze the chart with the actual shape or pattern of the candles.
However, you need to study to be able to read the arrangement of the candles in order to set support and resistance points.
Even this is not difficult to indicate support and resistance points because there are indicators that indicate support and resistance points.
-
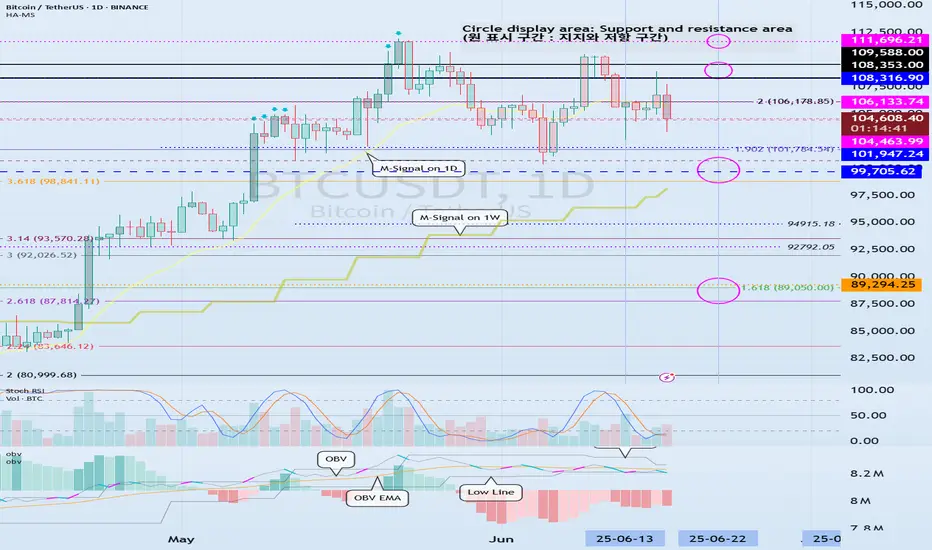
(1W chart)
The 104463.99 point is the DOM (60) indicator point, which corresponds to the end of the high point.
Also, the 99705.62 point is the HA-High indicator point, which corresponds to the middle of the high points.
Therefore, the 99705.62-104463.99 section can be interpreted as the high point boundary section.
The actual trend is likely to occur while falling from 99705.62.
The importance of the 99705.62 point is increasing because the M-Signal indicator on the 1W chart is rising near the HA-High indicator point.
If it falls below the M-Signal indicator on the 1W chart, it is possible that the trend will be determined again when it meets the M-Signal indicator on the 1M chart.
Also, if it falls from the HA-High indicator, it can meet the HA-Low indicator.
Therefore, if the price starts to fall, you should check whether the HA-Low indicator is generated.
The fact that the HA-Low indicator was created means that it rose from the low range.
That is, just as the HA-High indicator corresponds to the midpoint of the highs, the HA-Low indicator corresponds to the midpoint of the lows.
The end point of the lows corresponds to the DOM(-60) indicator point.
-
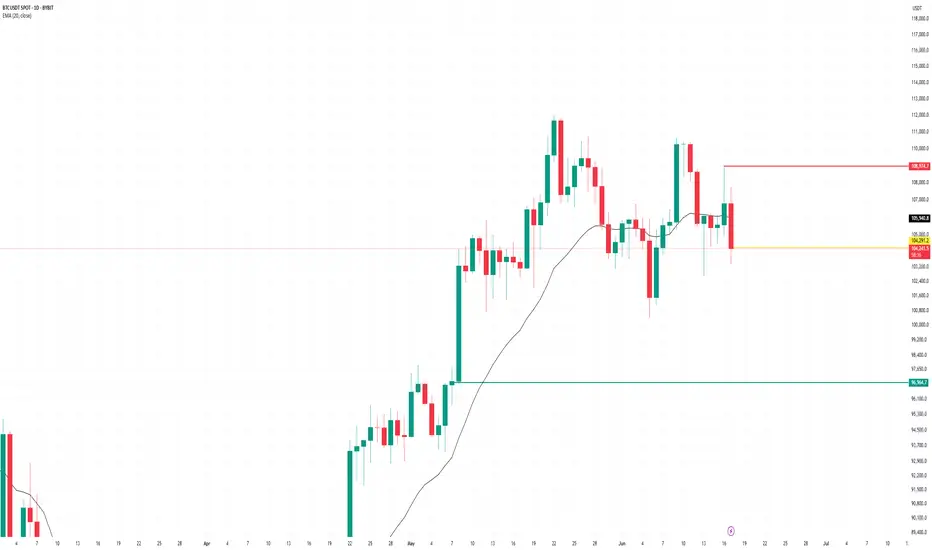
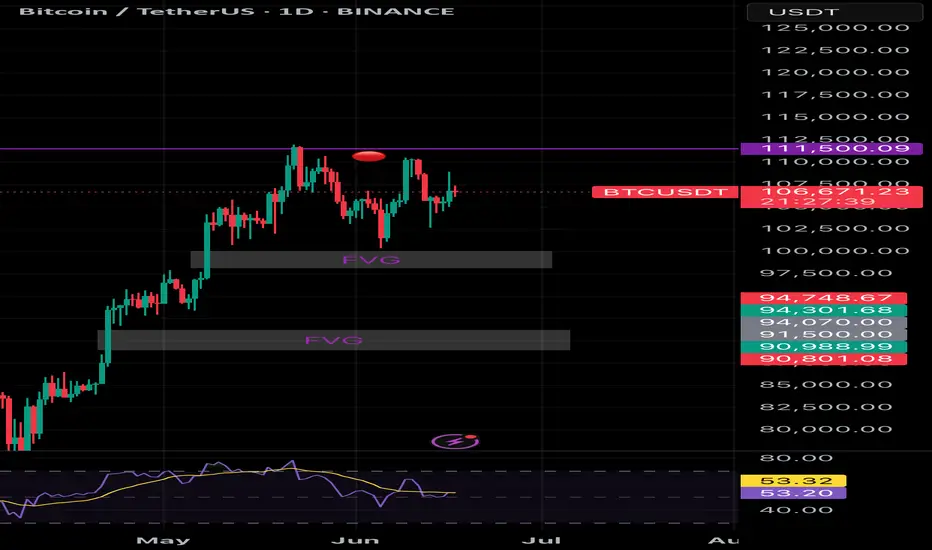
(1D chart)
For this reason, it is important to see support around 104463.99-106133.74.
The trend is likely to appear after the next volatility period, around June 22nd (June 21st-23rd).
Therefore, we should consider the 104463.99-106133.74 range as the middle range,
- and see if it falls below 99705.62,
- or rises above 108316.90.
Accordingly, we should create a response strategy and be prepared not to panic when a trend appears.
-
The OBV is currently below the Low Line.
Therefore, if it does not receive support at the 104463.99 point, it is likely to fall again.
Since the OBV oscillator is still below the 0 point, we can see that the selling pressure is strong.
However, looking at the overall movement of the oscillator, we can see that the selling pressure is decreasing.
Therefore, if there is another decline, the key issue is whether there is support near 99705.62.
-
In summary, the area around 104463.99 is playing an important role as support and resistance.
Therefore, after the next volatility period, around June 22, we need to check and respond to the direction in which it deviates from the 99705.62-108316.90 range.
-
Thank you for reading to the end.
I hope you have a successful trade.
--------------------------------------------------
- This is an explanation of the big picture.
(3-year bull market, 1-year bear market pattern)
I will explain more details when the bear market starts.
------------------------------------------------------
BTCUSDT.3S trade ideas
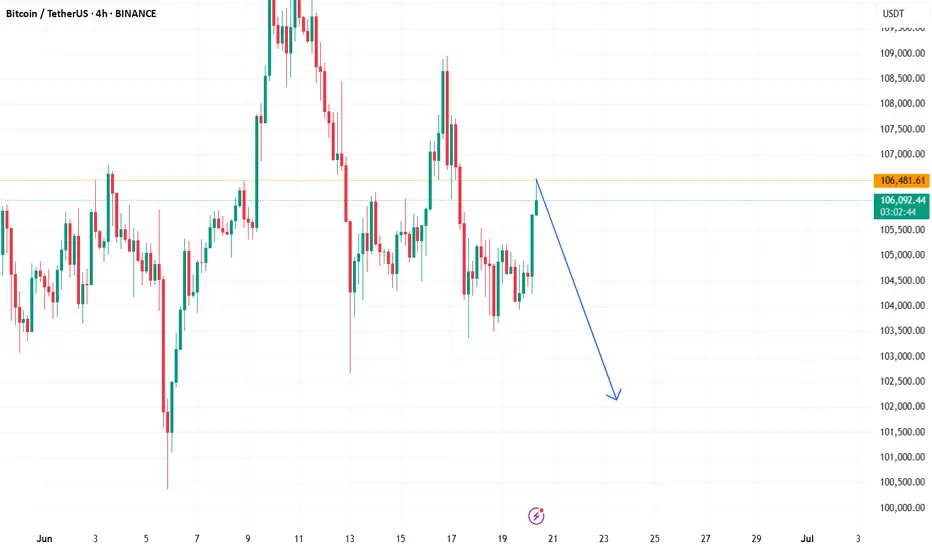
Evening BTC Market Analysis and Trading RecommendationsToday, U.S. markets are closed, leading to light trading activity and relatively limited overall market volatility. From a technical analysis perspective, the 4-hour K-line chart currently shows prices trading below the middle band of the Bollinger Bands, exhibiting a classic range-bound consolidation pattern. Bulls and bears are locked in a tug-of-war between key support and resistance levels, with K-line formations alternating between bullish and bearish patterns.
In terms of chart structure, the lower support zone has demonstrated strong buying conviction, while the upper resistance level has exerted clear restrictive force. Multiple failed upward breakouts have formed a short-term top. This box consolidation—characterized by resistance above and support below—is expected to sustain sideways trading through Friday.
Against the backdrop of no major positive catalysts, bearish momentum may gradually dominate if no substantial bullish triggers emerge. Maintain a trading strategy of selling into strength.
BTCUSDT
105000-105500
tp:104000-103000
Investment itself is not the source of risk; it is only when investment behavior escapes rational control that risks lie in wait. In the trading process, always bear in mind that restraining impulsiveness is the primary criterion for success. I share trading signals daily, and all signals have been accurate without error for a full month. Regardless of your past profits or losses, with my assistance, you have the hope to achieve a breakthrough in your investment.

Sidelined Due to Geopolitical Tensions in the Middle East🛑 Sidelined Due to Geopolitical Tensions in the Middle East
Due to the rising geopolitical tensions and the ongoing conflict in the Middle East, I’ve decided to stay out of the market for now. War-related news often triggers short-term volatility, driven more by fear and uncertainty than technical or fundamental analysis. I prefer to wait until the market stabilizes and the emotional reactions fade, allowing for more reliable trade setups.
BTCUSDT: Sharing of the Latest Trading StrategyAll the trading signals today have resulted in profits!!! Check it!!!👉👉👉
Fundamental Analysis:
The Federal Reserve's potential rate cut is expected to increase market liquidity, driving up prices of risk assets like Bitcoin.
Positive developments in China-U.S. trade talks have boosted market risk appetite, benefiting Bitcoin's price.
Technical Analysis:
Bitcoin rebounded strongly from the June 5 low of $100,377, with the RSI quickly recovering from oversold territory to around 55, indicating robust rebound momentum.
The lower Bollinger Band near $101,000 provided strong support, and price has now returned above the middle band.
Overhead resistance: $107,000 and $108,000
Support levels: $103,000, $101,500, and $100,000
Trading Recommendation for Aggressive Traders
Consider initiating light long positions if price pulls back to the $103,000–$103,500 zone.
Trading Strategy:
buy@ 103000–103500
TP:106000-108000
Share accurate trading signals daily—transform your life starting now!
👇 👇 👇 Obtain signals👉👉👉

BTCUSDT Price may Test as Short TermBTC/USDT Price Analysis (Interpretation):
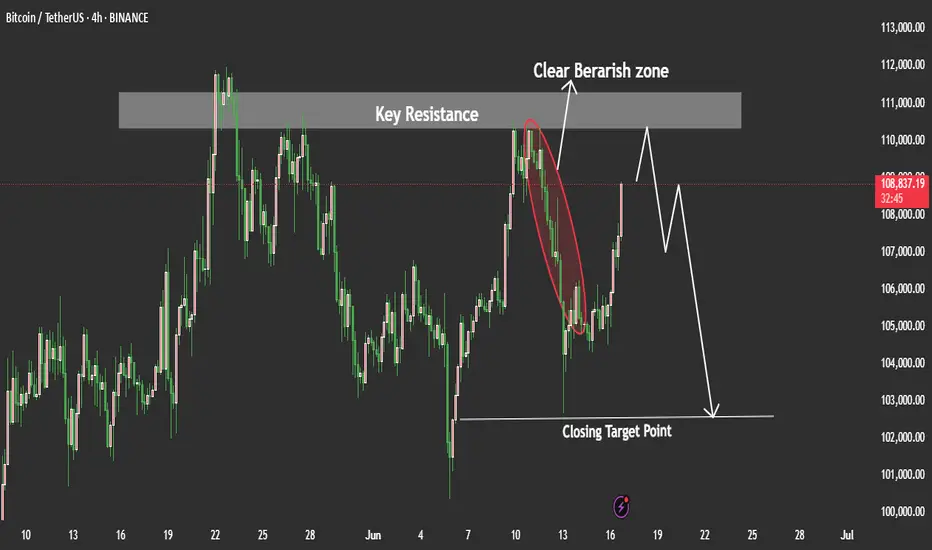
BTC/USDT recently tapped into a well-defined rejection zone on the 4H and Daily timeframes. This zone has previously acted as strong resistance.
Given this, we could expect a potential move to the downside unless the price breaks above that rejection zone with strong momentum. However, before the downside move fully plays out, there is a chance the price may retest the 102,500 level again — possibly as a liquidity grab or a false breakout — before resuming a bearish push. My Goal is 102,500 lets we see how how the price will plays out.
if you like tis idea and if you find good thing in this analysis share in comments we need support from you Guys.
BTC dump time , fake breakout, watch US news todayAny US strike on Iran will lead to a big dump in price
Bitcoin hits new uptime milestone!
Bitcoin has traded above $100,000 for more than 40 consecutive days since May 7, a major milestone for the top cryptocurrency, which has also surpassed 6,000 consecutive days of uptime this month.
BTC unaffected by global events
On June 19, Bitcoin recorded more than 40 consecutive days of trading above $100,000, despite uncertainty and heightened geopolitical tensions in the Middle East. According to Coingecko data, May 8 was the last trading day for BTC below $100,000, meaning that as of June 19, it had been above this level for 42 days.
Meanwhile, Blockchair data shows that BTC has been above $100,000 for 43 days, forming a new resistance level, which some technical analysts believe. During this period, BTC hit a new all-time high on May 23, surpassing the milestone previously reached on January 20. As of this writing, the top cryptocurrency is trading just above $104,000, which is familiar territory for BTC in June.
Prior to BTC’s return to six figures in U.S. dollar terms in early May, BTC spent more than 60 days trading below $100,000 amid global market turmoil caused by the trade war sparked by U.S. President Donald Trump’s “reciprocal tariffs.” At the time, BTC’s significant correlation with traditional assets and markets seemed to weaken its claim as a safe haven asset.
However, since dropping below $75,000 on April 7, BTC has trended upward, rising by about 50% to near $112,000 about 45 days later. Since then, BTC has fluctuated between $110,000 and $100,000, with major global events, including Israel’s launch of its attack on Iranian nuclear facilities, seemingly failing to push it below $100,000, according to Coingecko data.
Not only has the flagship cryptocurrency remained above $100,000 for more than 40 consecutive days, it also celebrated a significant operational achievement in June: more than 6,000 days of continuous uptime.
According to Bitbo, the Bitcoin network has been operating uninterruptedly since its inception at 02:54:25 GMT on January 3, 2009. Aside from two isolated incidents in its early history (one in 2010 and one in 2013), this uptime record has remained unimpaired, highlighting the network’s unparalleled resilience and robustness. These recent achievements further solidify BTC’s place as a stable and enduring digital asset and an increasingly established player in the global financial landscape.
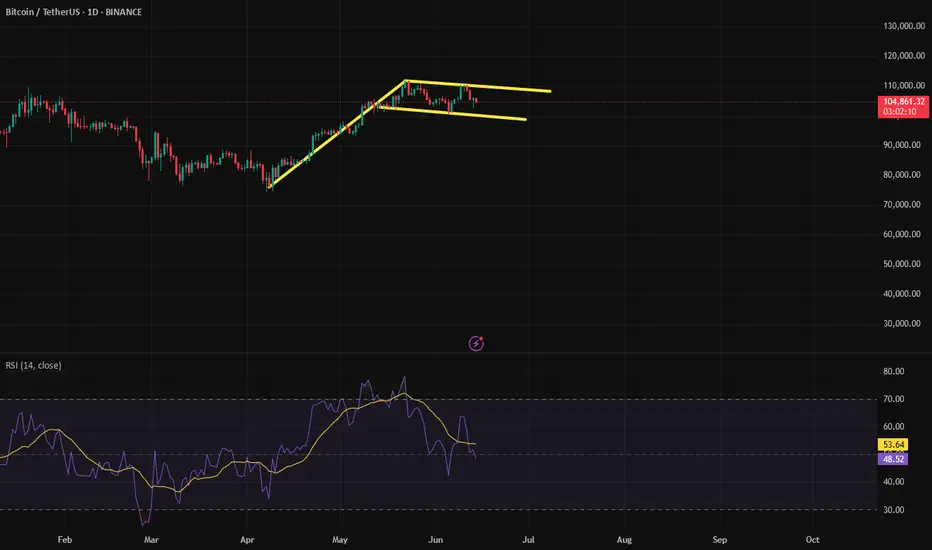
Bitcoin (BTCUSDT) - Price Consolidating Inside Sym. Triangle - DBITCOIN (BTCUSDT) price has recently bounced up from above the 50EMA (yellow line).
Since May 2025, price has been consolidating sideways and has now formed a symmetrical triangle (blue lines). 10% to 20% volatility could be incoming for Bitcoin this summer.
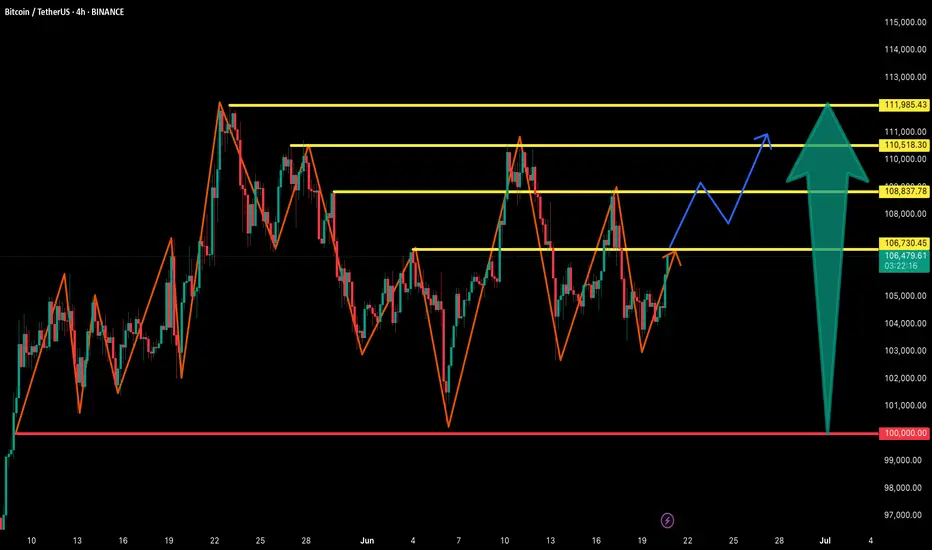
The key resistance prices that Bitcoin has yet to breakout above are: $110000, $112000, $115000, and $120000+.
Support prices are holding at this time, such as $105000, $104000, $102000, and $100000, $95000.
If price holds above $100,000 to $105,000, there is still a chance that Bitcoin can continue to uptrend and rally higher this year in 2025.
However, if $100,000 price and support levels are lost, a new downtrend could occur and price could possibly test the 200EMA zone (red line).

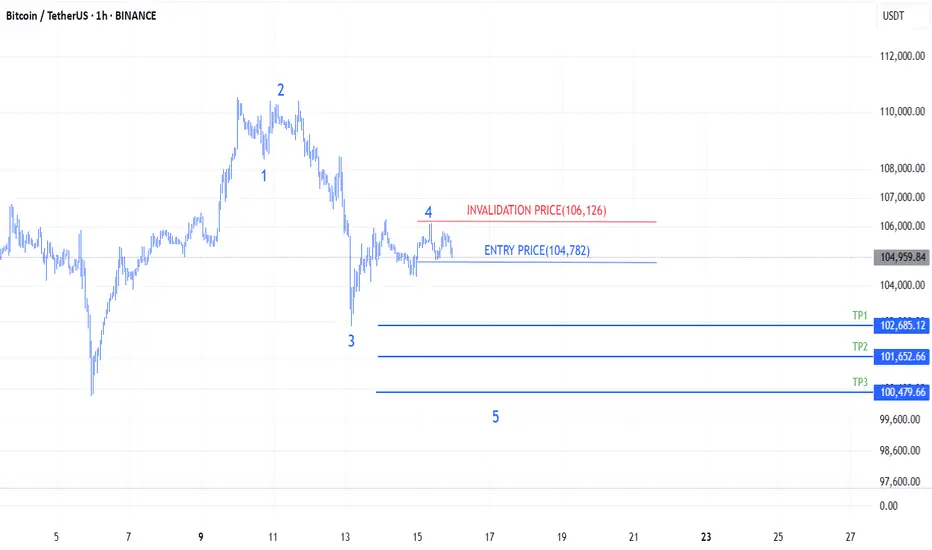
Most likely scenario for BitcoinI am tired of all analysts just saying that we are going down to 70k or up to 200k in one go.
So let me add a small informative chart for all people new or lost.
Don't get me wrong, i am bullish mid and long term but right now we are in the middle of a strong correction but shouln't last long.
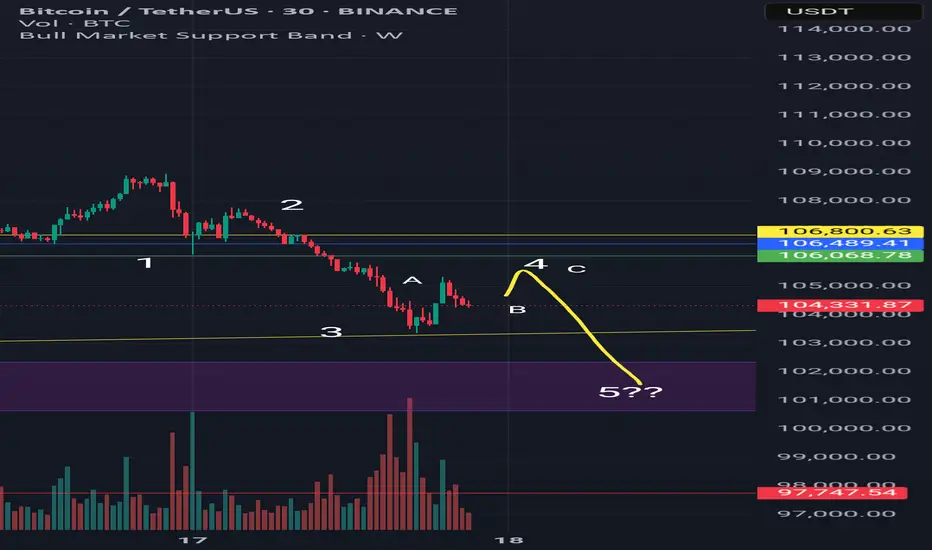
We could have been super bullish above 106k but the price broke down with strength.
Now we see a super clear 5 wave movement down.
Currently we are in the 4 wave, trying to bounce back to the 106k area and doing a classic 4 wave ABC correction.
The bounce lacks volume so the most likely scenario is completing the 5 wave. We might get to the 101k area and ONLY THEN we can see what could happen.
If you are a futures trader, do it with caution and small leverage.
If you are a long term investor, these are perfect areas to buy more.
Good day to everyone.
BTC channels chart Here I provide you what I believe to be BTC channels down trend channels in terms of being bullish each dotted channel is median and all darken red are tops and bottoms currently we are at median level and as long as we hold this level we can get a bounce to top channel if not then targets of bottom channel it may not be clear the first time but trying channels can provide extra clarity and here’s my chart to witness the BTC breakouts since 2022

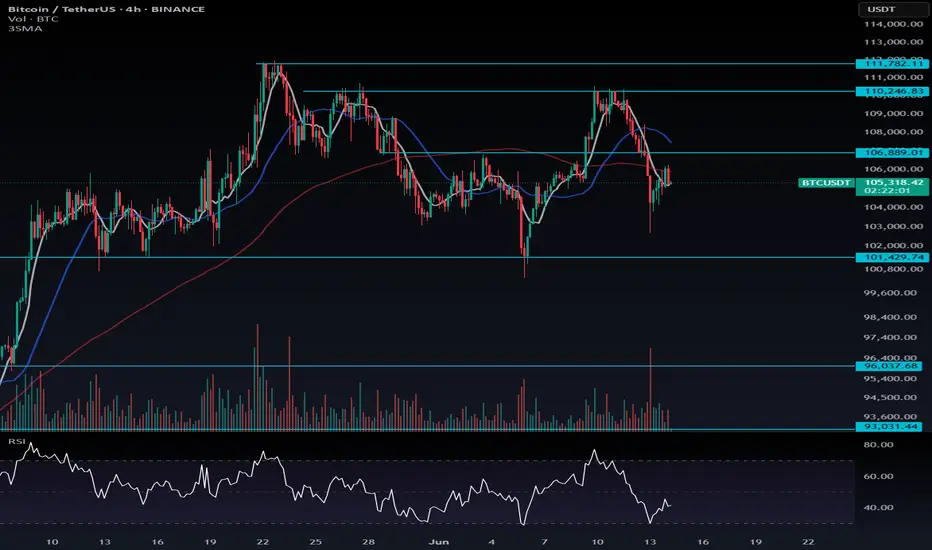
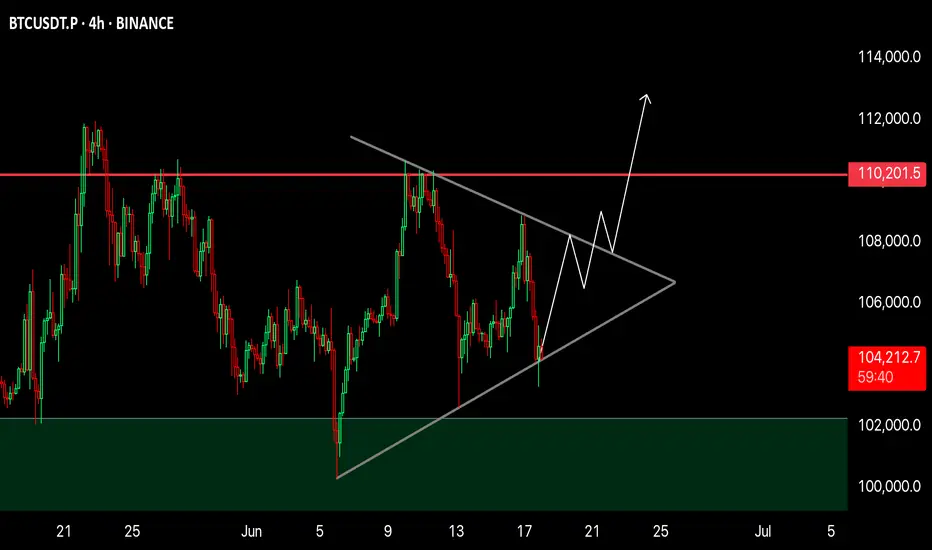
BTC 4H Analysis📈 BTC 4H Analysis – Symmetrical Triangle Breakout Loading
Bitcoin is currently consolidating inside a Symmetrical Triangle, forming higher lows and lower highs – a classic sign of volatility compression.
🔹 Structure: Symmetrical Triangle
🔹 Support Holding Strong – bulls defending the zone
🔹 Breakout Expected Soon
🔹 Major Resistance: $110,200
🔹 Breakout Target: $112,000+
Price is coiling up. Break above the triangle = strong bullish continuation likely.
🚀 Eyes on breakout — next move could be explosive!
NFA | DYOR
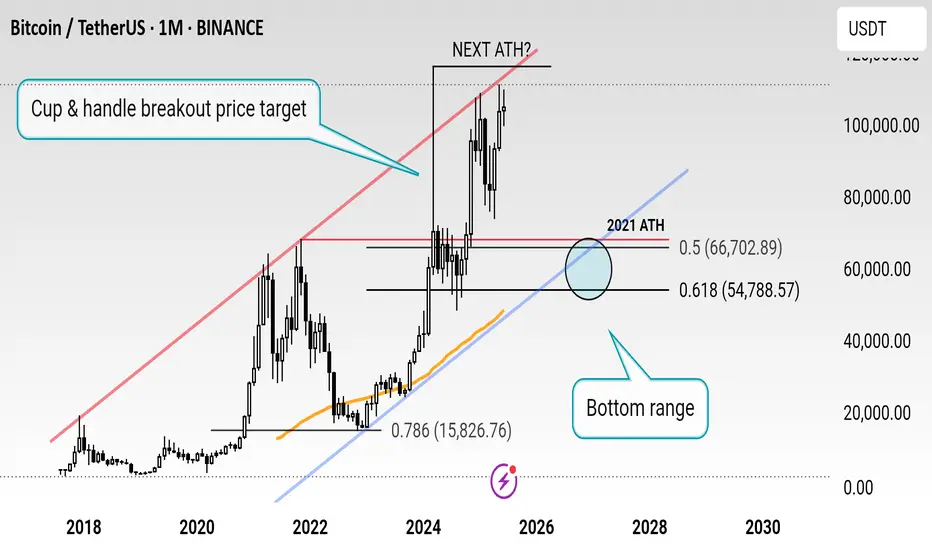
$BTCUSD Predictions support line
Bitcoin traders, get ready for an epic ride! This chart shows BTC still has to hit the price target from the Cup & Handle breakout, pushing it toward a major channel resistance! Once it peaks, a bear market could kick in, driving prices down to the support line. Buckle up for the volatility ahead!
btc chipping down de road This is de rasshole fractal—the fractal from the future, the one whispered through the blockchain by quantum echoes of bull runs past, the one that knows, that sees, that is. It bends time, folds sentiment, loops liquidity through dimensions you haven’t even leveraged yet. It doesn’t care about your indicators, your trendlines, your cousin’s TA on Reddit—it just exists, pulsing with the inevitable. You can squint at it, laugh at it, ignore it—but it’s already printed, already fulfilled, already written in the candlesticks of destiny. Don’t try to understand it. Just feel it. Because the fractal knows: the price is going up. Did you buy the dip, or are you still refreshing?

BTCUSDT-– Symmetrical Triangle Breakout LoadingBitcoin is currently consolidating inside a Symmetrical Triangle, forming higher lows and lower highs – a classic sign of volatility compression.
🔹 Structure: Symmetrical Triangle
🔹 Support Holding Strong – bulls defending the zone
🔹 Breakout Expected Soon
🔹 Major Resistance: $110,200
🔹 Breakout Target: $112,000+
Price is coiling up. Break above the triangle = strong bullish continuation likely.

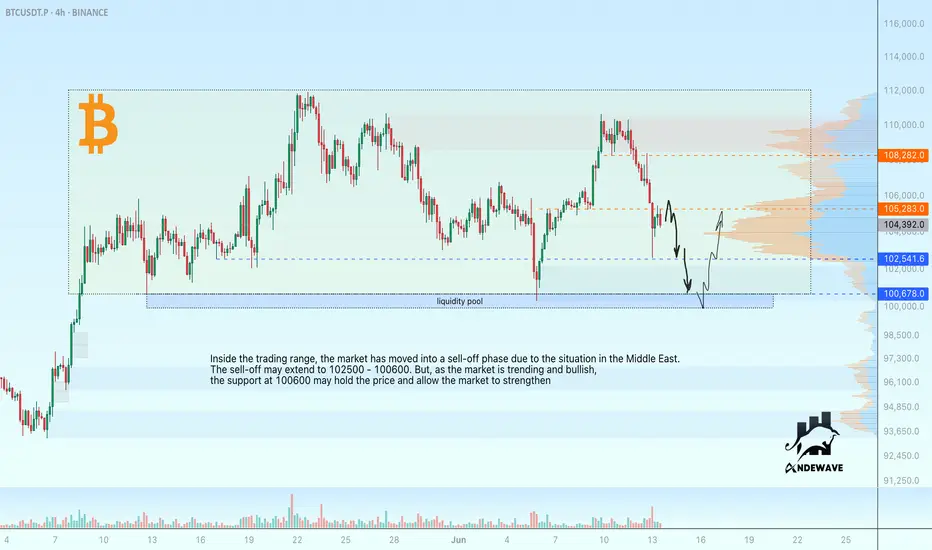
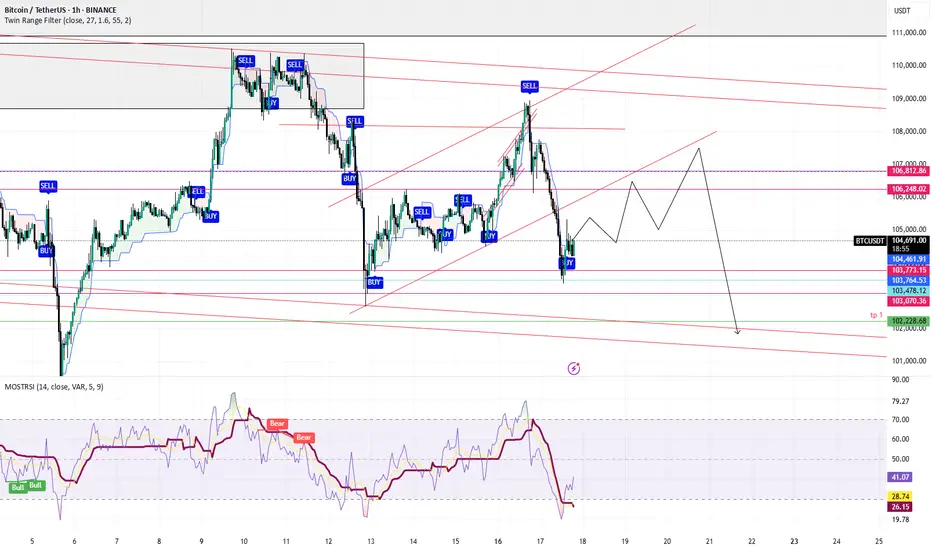
BTC gathers liquidity ahead of growth Inside the trading range Bitcoin has moved into a sell-off phase due to the situation in the Middle East. The sell-off could extend to 102500 - 100600. But as the market is trending and bullish, the support at 100600 may hold the price and allow the market to strengthen
Scenario: A false break of the resistance at 105280 is formed. Accordingly, I am initially waiting for a decline to 102500. If 102500 fails to hold the move, bitcoin could then head to the liquidity pool. A false break of 100600 may give a chance for a rise to 105200 - 108200.
BTC Drops again ?
**Mastering Zones: Your Quick Trading Guide!**
Remember the core logic:
* **🔵 Blue Zone:**
* **PUMPS FROM BLUE** (Look for buys!)
* **DUMPS IF BREAKS BLUE** (Consider sells/exit longs!)
* **🔴 Red Zone:**
* **DUMPS FROM RED** (Look for sells!)
* **PUMPS IF BREAKS RED** (Consider buys/enter longs!)
Apply this to your charts for clear signals. Stay sharp!
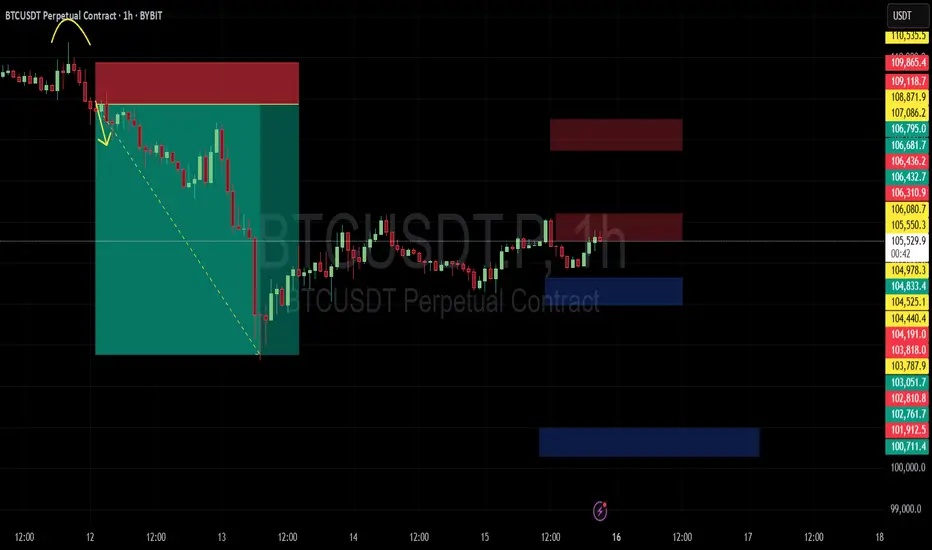
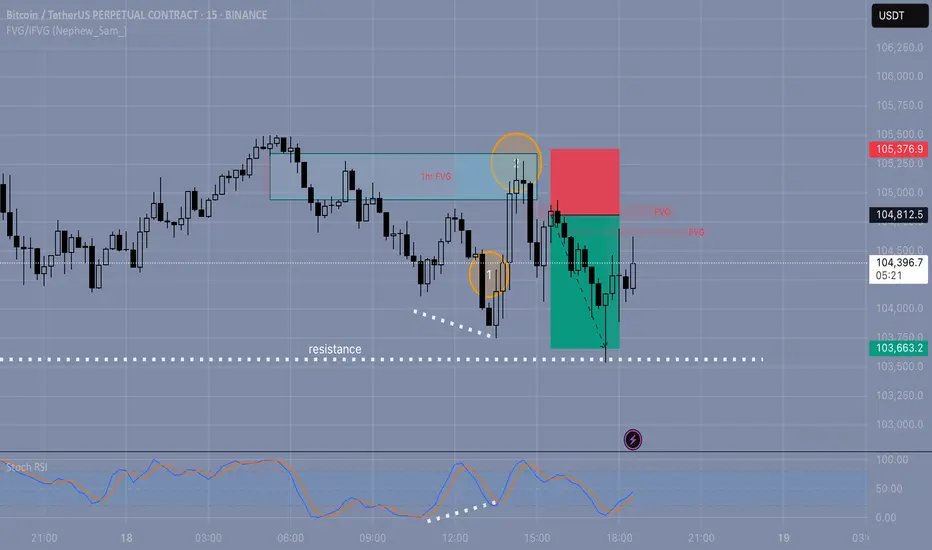
BTC Short | FVG Setup + RSI Filter | 18.06
Smart Money Concept | Intraday Trade | 1:2 RR
🔍 The setup:
Today I was watching for a short opportunity.
Price reached a key level and formed a bearish FVG — looked clean at first.
But I held off entering because I noticed RSI divergence — a red flag I always consider when expecting a potential level break.
💡 Why it matters:
RSI divergence often signals weakness in momentum.
For me, it's a key filter that helps avoid fake breaks — this was a good example of how I apply it.
📈 What happened next:
Price moved up to test the 1H FVG (zone #2) and formed another FVG slightly lower.
That second one was my entry point for the short.
🎯 Target:
I exited at a 1:2 risk-reward, which is my minimum.
The day was ending, and I didn’t want to hold the position longer — I’m not convinced the down move would continue cleanly (possible wicks or traps).
🤔 Question to the community:
How do you filter FVG entries?
Do you also use RSI or wait for structure shifts?
And what’s your outlook on BTC from here?
Will History repeat itself for BTC?Why Bitcoin Could Fall
Historical pattern?
-Bitcoin seems to be replicating the old crash from 60k.
Regulatory or policy uncertainties
-Future regulation remains uncertain; unexpected rulings or crackdowns could reduce institutional appetite and lead to pullbacks.
Dependence on economic sentiment
-If global liquidity tightens or equities falter, Bitcoin could behave like a high-risk asset and decline sharply
Current War situation
-The effecs of the Iran-Israel war will affect BTC as USD is seen as a risk-off asset (so if USD goes up, then BTC goes down)
-Disclaimer: This analysis is for informational and educational purposes only and does not constitute financial advice, investment recommendation, or an offer to buy or sell any securities. Stock prices, valuations, and performance metrics are subject to change and may be outdated. Always conduct your own due diligence and consult with a licensed financial advisor before making investment decisions. The information presented may contain inaccuracies and should not be solely relied upon for financial decisions. I am not personally liable for your own losses, this is not financial advise.

What is what I think BTC is bearish short to full the FVGs if you look very closely to the chart. Full the gaps and back up for a long
$BTC has seen neither wars nor crises nor antics.CRYPTOCAP:BTC has seen neither wars nor crises nor antics. But it is still here and still rising. What do you see in this chart? I do not recommend investing in the rise. I may be wrong about buying with what I wrote, but I am bullish flag technology in this chart. 100k 99k needles can be thrown but it will go up after closing the day under it.