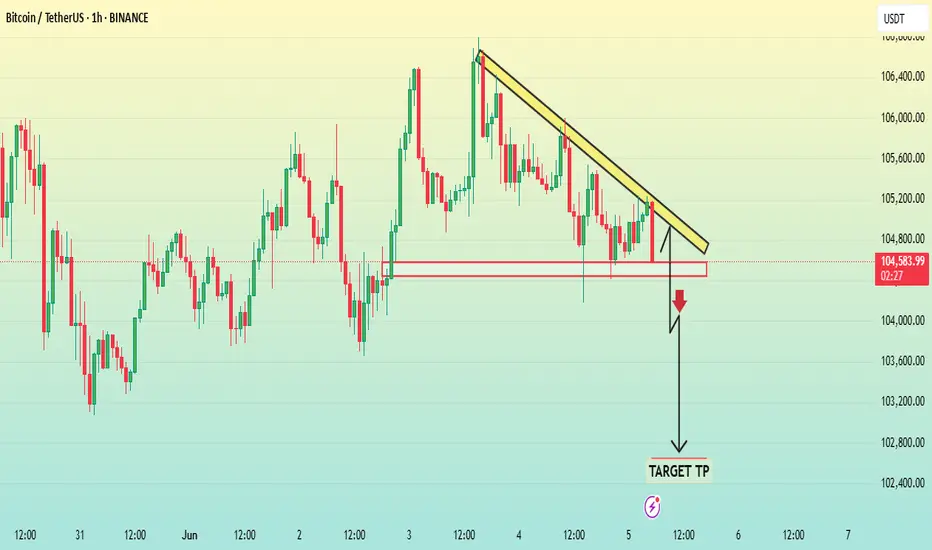
BTC - SetupCalled the potential exact bottom yesterday.
Now, the zone between $103,500 – $104,600 is crucial.
Either we get rejected from there and form a stronger bottom — or we break through and head toward new all-time highs in the near future.
Won’t be posting over the next few days.
If something important happens, I’ll drop a quick update — otherwise, see you in a few days.
LFG. 🚀
BTCUSDT.3S trade ideas
BTCUSDTHello Traders! 👋
What are your thoughts on BITCOIN?
Bitcoin entered a corrective phase after a liquidity hunt above the recent highs and is currently in a short-term pullback.
We expect this correction to extend toward the identified support levels, after which a new bullish wave may begin, potentially leading to fresh all-time highs.
The broader trend remains bullish, and the current correction could offer a buy-the-dip opportunity in line with the ongoing uptrend.
Don’t forget to like and share your thoughts in the comments! ❤️
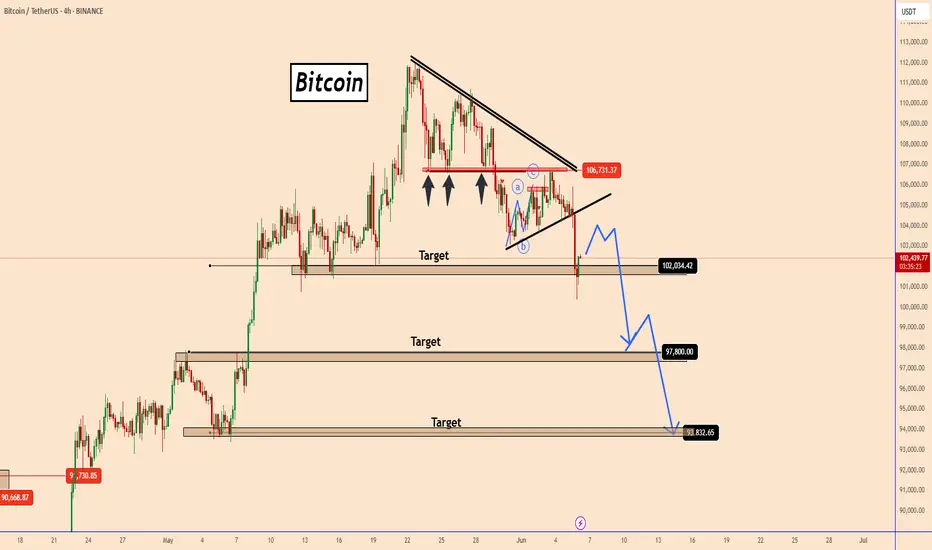
Bitcoin in a clear bearish movementBitcoin in a clear bearish movement
BTC created a clear bearish movement yesterday following our previous swing trade setup.
The price spend some time below the red zone near 106700 and yesterday suddenly the bearish wave started and already reached the first target.
The price could take a pause today near to 103500 - 104000 but it should continue to drop further as shown in the chart with targets 97800 and 94000
You may find more details in the chart!
Thank you and Good Luck!
❤️PS: Please support with a like or comment if you find this analysis useful for your trading day❤️
Previous analysis:
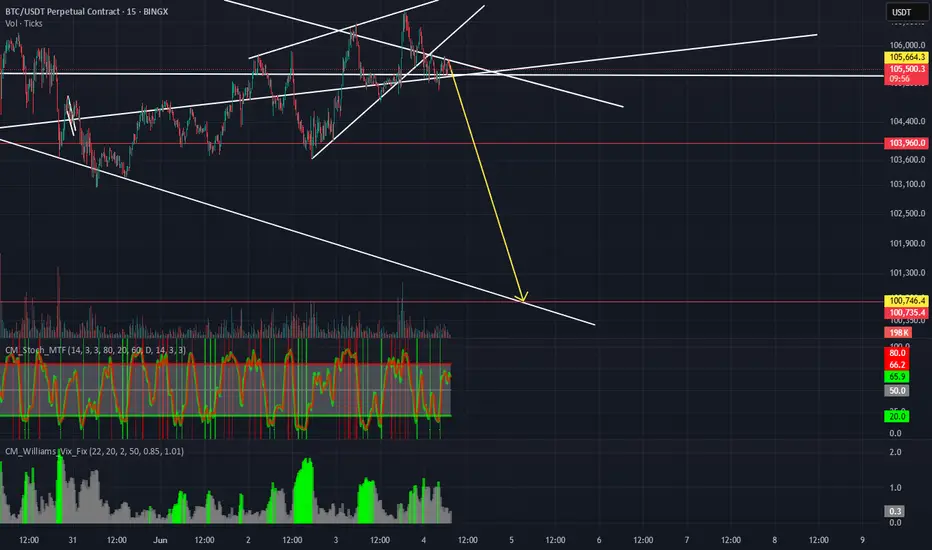
BTCUSD 1HThe second chart you uploaded is a 1-hour candlestick chart for Bitcoin (BTC/USDT) on Binance. Here's the analysis based on what is shown:
---
Chart Analysis:
1. Bearish Descending Triangle Pattern:
Descending resistance (yellow trendline) connects lower highs — indicating bearish pressure.
Horizontal support zone is marked in red, where price has repeatedly bounced — indicating strong support.
This setup forms a descending triangle, a bearish pattern that often results in a breakdown below support.
---
2. Breakdown Expectation:
A black arrow and zigzag line suggest a possible breakdown scenario.
The target TP (Take Profit) is drawn significantly below the current price, targeting near the $102,400–102,600 zone.
---
Implied Strategy:
Trigger for Entry (Short): A clear break and close below the horizontal red support zone (~$104,500).
Target TP: Around $102,400
Stop-Loss (not shown): Likely above the descending trendline, maybe near $105,200–105,300 to invalidate the pattern.
---
Technical Implication:
A descending triangle in this context suggests sellers are consistently pushing down while buyers are losing strength at the support level. A breakdown would confirm bearish control.
---
Would you like a comparison of this BTC setup vs. the SUI breakout chart in terms of trade setup strength or risk-reward?
Btc ran stopsQuick wick as a swing fail pattern and poked into the fair value gap inefficiency, looks like we might get a retest and we’ll see how it goes. We might get 150k BTC before GTA 6
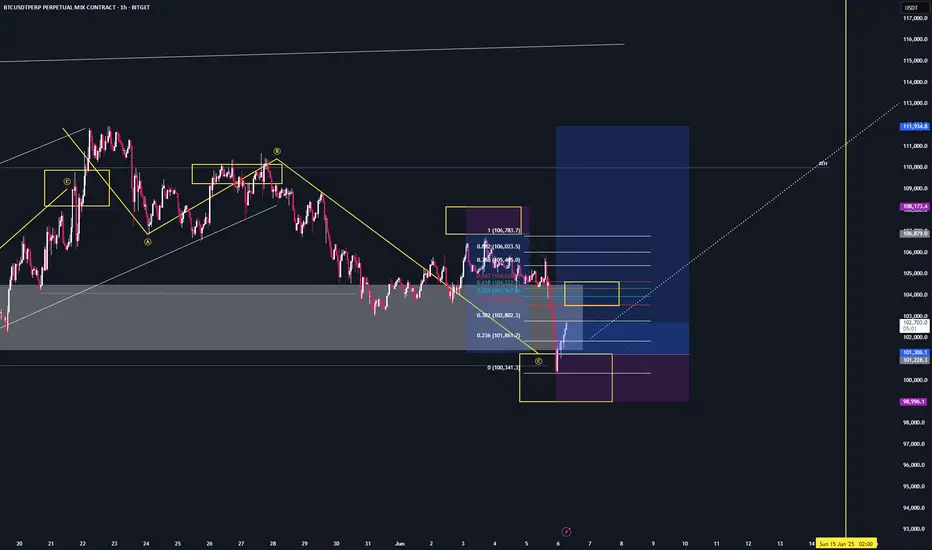
BTC Current Structure and Future movesZemoG Trading Strategy: Market Structure, Major Wicks, and Cycle Completion
My trading strategy is centered around identifying major wicks on higher timeframes combined with numerology, 55 degree angles, cycles and volume.
As we all witnessed, BTC reached a new all-time high (ATH) of $111,970 on May 22, 2025. With that milestone behind us, BTC is now moving toward the completion of its broader market structure cycle.
Every asset follows a cycle. By observing price action and structural behavior, we can anticipate the next move—especially when major wick rejections serve as signals for market dominance and directional bias.
Current Market Observation:
At the moment, BTC is bouncing from a significant wick zone around 100.7k. This move upward appears to be mirroring the left side (shoulder) of the larger market structure, setting the stage for the formation of the right shoulder.
As BTC continues this path, we expect it to wick above previous major wicks (see levels below) before initiating a reversal back toward its midpoint level wick at 100.7k.
---
Long Setup (Bullish Scenario):
Key Support: 100.7k
Long Targets:
104.1k
104.9k
105.8k
Stop Loss: 103k
---
Short Setup (Bearish Scenario):
If BTC closes below the 100.7k level, it would confirm a shift in market dominance toward the downside. Below this level, there are few significant wick supports, allowing for a smoother drop through multiple levels with little resistance.
Key Break Level: Close below 100.7k
Short Targets:
96.8k
95.8k
93.4k
92.9k
91.6k
83.9k
81.1k
79.9k
78.5k
76.6k
Final Target & Origin Zone: 74.5k
This 74.5k level is crucial, as it would complete the entire market structure and possibly reset the next cycle phase.
---
Stay aligned with the cycles, watch the wicks, and follow the structure.
As above, so below.
– ZemoG Trading Group

Bitcoin Crashes To $81,346.77? Good News & Bad NewsBitcoin is crashing... ? Not really, Bitcoin continues really strong above $100K.
We have good news and bad news.
Bad news. The very ultra-strong, long-term unbreakable support zone is being challenged. This is the $100,000 - $102,000 price range.
God news. It holds. This support zone is being challenged but so far it holds.
So far there is nothing unexpected here we know the market can shake, the market is bound to produce swings. If 100K breaks though this would be a completely different story. If it breaks, Bitcoin continues bullish producing a retrace only to end as a higher low followed by additional growth.
Will support break or hold, is there a way to know?
Bitcoin's retrace after the all-time high so far amounts to -10%. A standard retrace can easily push prices between 0.382 and 0.5 Fib. retracement. Anything lower and this would be a correction rather than a retrace.
Will it break?
It is possible but so far 100K is a very strong support. We have EMA55 here as well as several Fib. levels but if Bitcoin remains below $102,000 then it can definitely break.
The next major support below 100K sits at MA200 or $95,000. This is in-between 0.382-0.5 Fib. retracement. This can be used as the higher low zone and re-entry zone. But, Bitcoin is really strong and demand is big, so we have to wait for the weekly close.
Remember, Bitcoin will continue slightly bearish, consolidating, until the Fed decision. After the event, it is very likely to go full blown bullish. The altcoins will grow as well.
Watch the market shake just to recover the next day.
Are you a weak hand or a strong hand?
Do you have a trading plan?
If you do, nothing changes, simply short-term noise.
If you don't have a plan, right now you might be thinking that the world is close to its end. It isn't, Bitcoin will continue to grow, it takes time for the bulls to recharge before the next wave of growth.
Focus on the long-term.
Thanks a lot for your continued support.
Namaste.
Bitcoin 05/06/2025I can see in this level of price , buy in timeframe h4. Now we are bearish, the next step would be to drop to the H4 candle purchase zones. pay attention with yours buyss.
Bye bye
Lucas Gomez

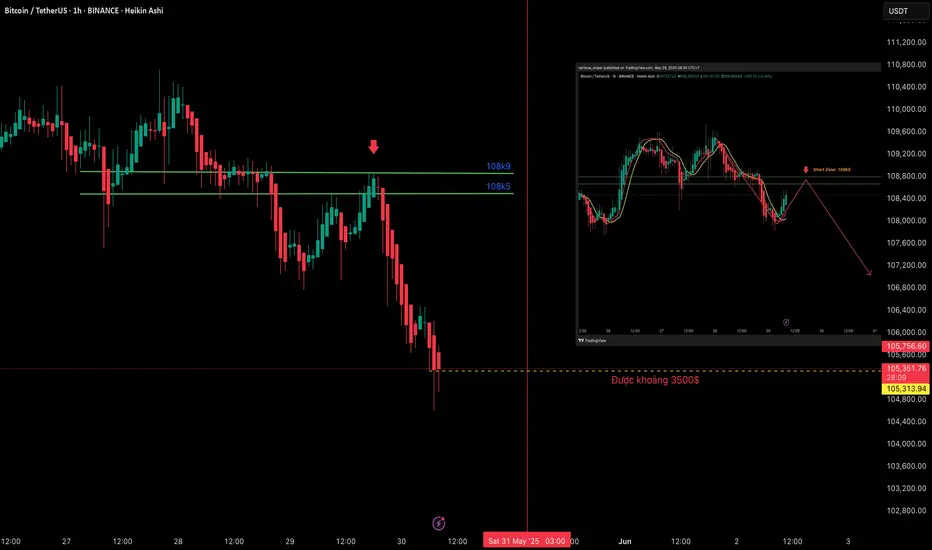
Why Do Trendlines, Chart Patterns Only Work Probabilistically?Why Do Resistance, Support, Trendlines, Fibonacci, and Chart Patterns Only Work Probabilistically?
(Meaning they are sometimes accurate, sometimes not)
In an uptrend, we follow the strategy of "buying at the bottom, selling at the top." But in a downtrend, what strategy should guide us? It’s the opposite: "shorting at the top and closing the short at the bottom." The approach is not much different from spot trading. We still use tools to identify tops and bottoms to execute our shorting plan and close positions.
For BTC on the D1 timeframe, the trend remains bearish. According to my system, BTCUSDT formed a peak on D1 on May 27 and May 28, with two "has peak D1" signals. This suggests that if we follow a short strategy, we would take profits at the D1 bottom.
In terms of price, we could wait around the $100k level to observe price action for profit-taking. Alternatively, using a bottom-detection system, we would close the position when a "has bottom" signal appears, regardless of whether the price hits $100k. It depends on the real-time market dynamics at that moment. The price might drop further to $95k or $93k, or it may not even reach $100k. Fixing a specific price level—whether it’s a resistance, support, trendline, or Fibonacci level—may not fully capture the overall real-time market context.
This is why sometimes the price hits the exact fixed zone, but other times it overshoots, undershoots, or a larger timeframe intervenes and breaks these fixed zones. That’s because price zones, trendlines, resistance, support, and Fibonacci levels are based on historical context.
In real-time, we are dealing with the present, which is vastly different from historical context. For example, differences in political leadership, monetary policies, wars, geopolitics, or capital inflows can all create disparities. This is why trendlines, resistance, support, Fibonacci levels, and chart patterns are not always accurate in the present or only work probabilistically.
Stay sharp, brothers!
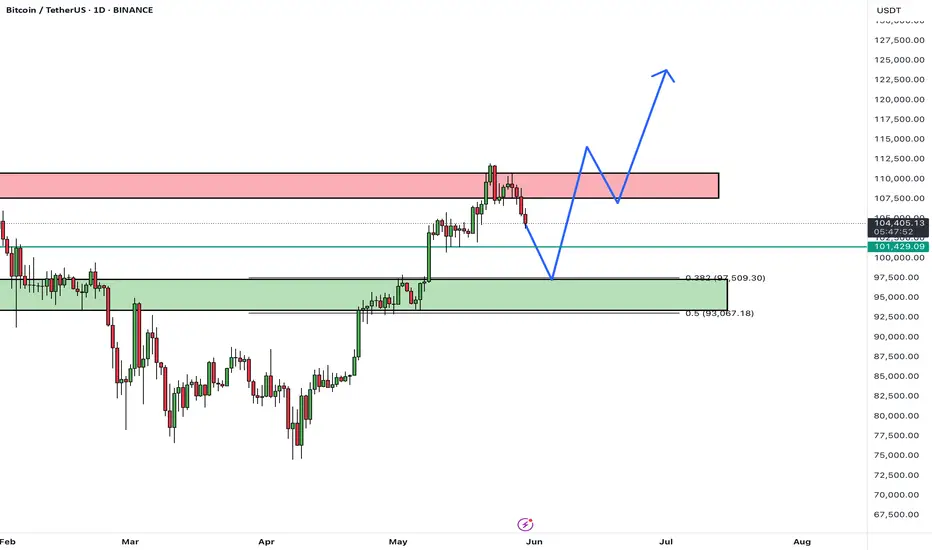
2 Scenarios for BTCNow that the cup and handle formation has been reached and the correction finished, I think we have 1 more leg up.
It's also possible that we fall from here, but I think another fakeout upwards is likely as bearish divergence forms on the month, but isn't quite there yet (RSI needs 1 more higher high to confirm bearish divergence)
Either way, my short targets are the 0.618 fibs. I am expecting the typical -70-75% crash by 2027 before the next cycle begins

4 hour 3:1 bear target madeScaling out at multiple targets increases the odds of taking some profit.
The 3:1 target got made already.
There’s a measured move that is in play - which is also near an intersecting line target.
The bearish Wolfewave 1-4 line is still also in play.

BTCUSDT – Ending Diagonal Nearing Completion? Critical Decision This structure appears to be developing within an ascending channel, potentially completing an ABC correction with a final impulsive move toward the upper trendline. The internal wave count indicates a possible completion of subwave (5) of C near the top.
However, bearish divergence in structure and the sharp nature of the previous impulse suggest caution. Two major outcomes are on the table:
Continuation Scenario: Price breaks above Wave 5, extending the rally in an overthrow move before reversing.
Reversal Scenario: Breakdown from the channel support (~107,000) could drag BTC down toward the broader trendline near 98,000–99,000.
This zone aligns with previous wave B support and could serve as a critical retest area.
Traders should monitor a break below the wave 4 pivot and channel midline as early signs of weakness. A rejection from the current top without higher highs confirms a potential end of the diagonal.

Current Bitcoin Analysis! What Can Investors Expect in the CominBitcoin is trying to find support at 103K levels. We are likely to see a move until our previous support is now in the green. As long as 103K is maintained, 105.8. - It will want to rise up to the 105K range.
If a short confirmation structure is formed when it reaches the specified green area, the short idea can be evaluated up to 100K levels. When it comes to the green area in the analysis, it should be monitored closely. If the price moves to the red zone, short confirmation structures can be evaluated.
If Bitcoin resumes its downward movement from the red zone, the bearish target will be the blue lines in the analysis.
Not Investment Advice.

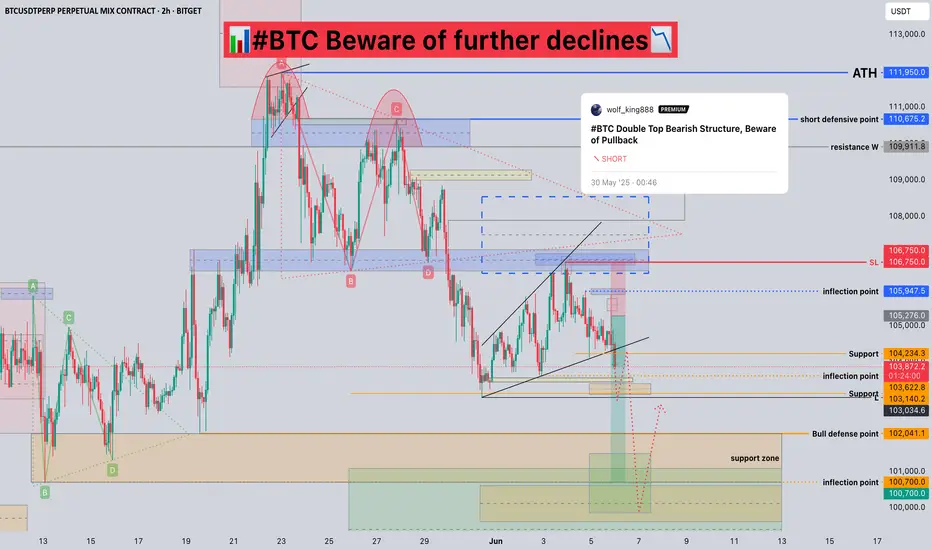
#BTC Beware of further declines📊#BTC Beware of further declines📉
🧠From a structural perspective, we have not been able to break through and stabilize at the resistance area near 106500. And the structure of the reversal of the bullish trend has been established, so the downside risk remains.
➡️From a graphical perspective, we have formed an extended wedge between the support line and the resistance area, and the price has now fallen below the lower edge of the wedge, so we will likely see further pullbacks.
➡️If the market really develops as expected, then the support area worth paying attention to is around 100700.
⚠️Note that if we rise again and successfully break through and stabilize at the resistance near 106750, then we will see more gains.
Let's see👀
🤜If you like my analysis, please like💖 and share💬 BITGET:BTCUSDT.P
#BTC Double Top Bearish Structure, Beware of Pullback📊#BTC Double Top Bearish Structure, Beware of Pullback📉
🧠From a structural perspective, we broke below the neckline of 106510, which means that the bearish double top pattern is established, so we need to be wary of the coming of a plunge.
➡️As I said in my last analysis, we stabilized and rebounded after testing the support near H1, but I was not satisfied because my order was swept after I moved up the SL, so we cancelled the risk and also meant that we might cancel the possible future profits.
➡️However, I still succeeded because I stuck to my trading plan and tried some short trades after the price rebounded near the blue resistance line. 50% of the profit has been locked in because I am worried that the market will jump back and forth between support and resistance, and there is a gap to be filled near 109200.
⚠️If we fail to hold the support near 106500 tomorrow, then we will see a plunge.
Let's see👀
🤜If you like my analysis, please like💖 and share💬 BITGET:BTCUSDT.P

BTC HTF HL Could Be InI can have all my opinions about how this low can't be the HTF HL but who am I to say this? I should keep it in the back of my mind but I shouldn't let it hinder me from entering new trades/investments.
I spent too much time speculating on how I think it should look instead of just keeping it simple and just think about how it looks in the moment. It cost me missing the up-move from ~85k-100k.
I think of trading vs investing, LTF trades vs HTF trend while I should just scrap the HTF trend as this causes me to go on a speculation trip and I lose track of what's in front of me in the moment.
-------------------------------
What I think is in front of me right now:
Let's start with that MS is king. This up-move is caused by the fact that price got above the structure of 29 March-5 April, without any significant PA. It just got above it and stayed above it and pushed out above it.
That's enough evidence to me that I shouldn't necessarily wait for a big SFP, on the 15min TF or 1D. Or that I shouldn't wait for a big 15min engulfing candle. This is just proof as price has pushed all the way back to 100k.
Then,
The blue box was the resistance and the level below it (95k spike) was the main level. The top of this level was maximal resistance. Here I expected (=speculated) that price would be capped and go back to 74k. I expected price to close above the level but that the new structure formed around the level would provide a short (like a SFP and then a MSB).
But this didn't happen. Price pushed above the resistance. So that's how it now is: there's no resistance. Just like in april when price got above the 29 March-5 April structure with main level of structure being the high of 4 April.
And then to add: in current structure price has closed above the main level of that structure on the 1D: the high of 12 May. This is good.
Also: there's no 15min SFP at the current highs and the MSB failed (price pushed back up).
Also: there's a clean level for the long SFP: 12 May low.
Conclusion: if price breaks down from here without going back to these highs, price could be capped at the long SFP-level of 100k. And given the (I think) fact that there's no resistance and MS is king, this is the right level to enter the long in spot BTC.
So that's what I'm going to do. Might enter the trade too (perps) if price indeed SFP's this level.
-----------------------------
If price doesn't hold the 100k level, I don't think price can drop further than the 74k low so that's the potential downside (I don't sell spot if there's no short setup) I keep in mind.

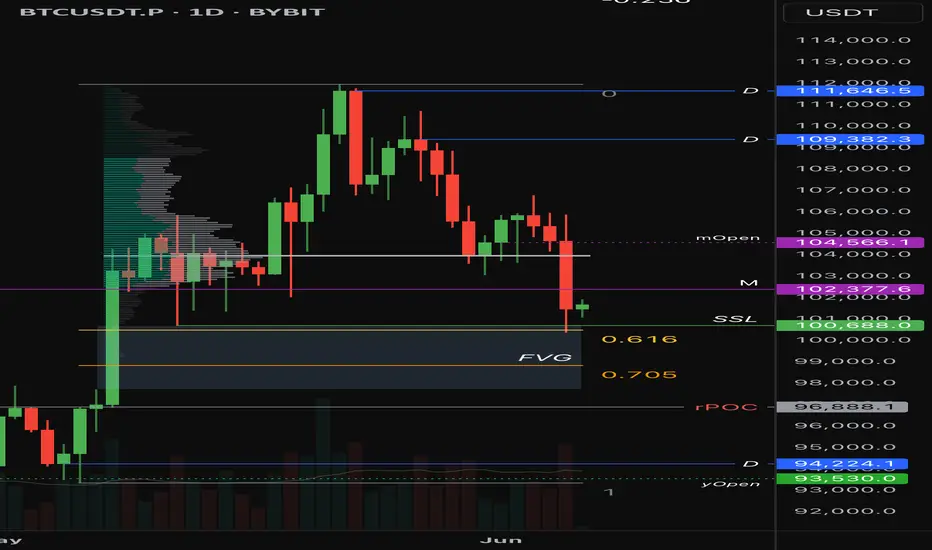
BTC next bull runBTC is expected to undergo a short-term retracement before reigniting its bullish momentum and advancing toward new highs
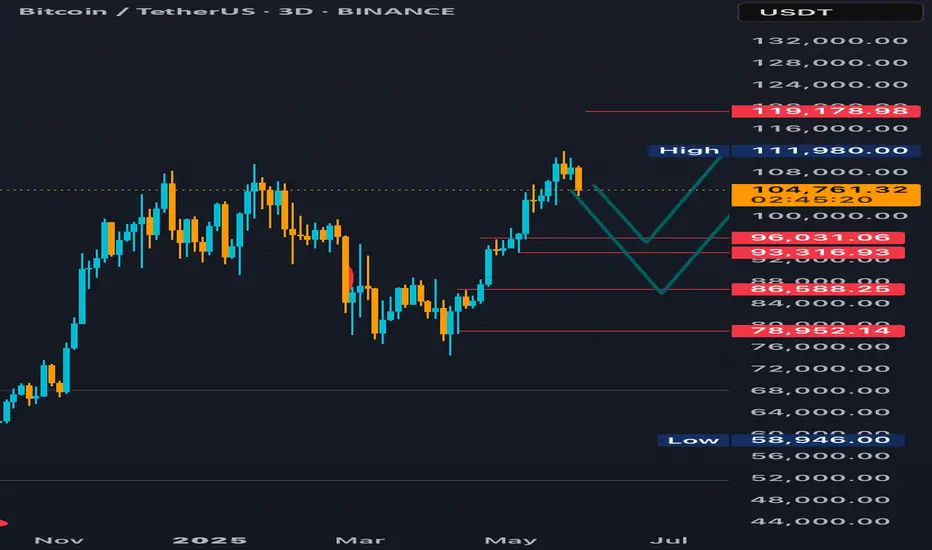
Bitcoin Wave Analysis – 5 June 2025
- Bitcoin broke support zone
- Likely to fall to support level 98,000.00
Bitcoin cryptocurrency recently broke the support zone located between the key support level 102150.00 (which reversed the price multiple times from the start of May) and the 50% Fibonacci correction of the upward impulse from last month.
The breakout of this support zone accelerated the active short-term ABC correction 2, which started earlier from the major multi-month resistance level 110,000.00.
Bitcoin cryptocurrency can be expected to fall to the next support level 98,000.00 (former strong resistance from February).

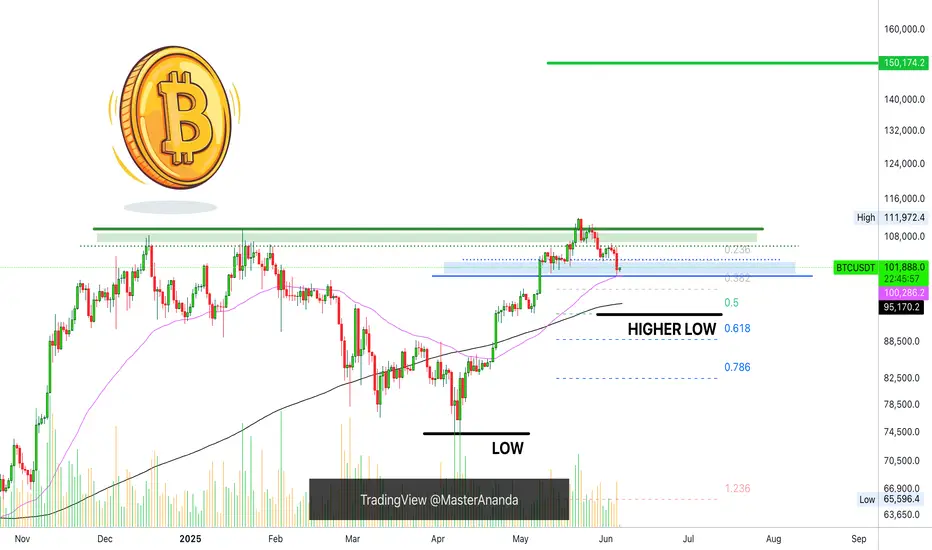
Bitcoin - Bearish double top or bullish cup and handle ?As CRYPTOCAP:BTC reached a new high, we got a clear double top setup unfolding.
The question is now how this will unfold ? Honest answer : We can't know as price can unfold in many different patterns from here.
For now , we have to respect the bearish double top setup and therefore remain bearish on this as long as price is below 109.600$ .
BUT seen the somewhat good general market context for now and the potential for a surge in bitcoin demand, we have to be open to the possibility to turn bullish here when possible.
A double top setup can easily turn into a cup and handle setup, that means we could see price consolidate some more before rising again. But for that to happen, we need price to hold some key support levels , which for now is the 20day EMA in green on my chart. IF the 20dEMA is broken, we can simply look for the 50dEMA in black as the next potential support zone.
Also, from an Elliott Wave perspective, it's quite simple, if price move above the 78.6% Fibonacci retracement level, although not always, more often than not we see price go up to the 127.2% and 138.2% levels around 120K here.
So, what can we do from here ?
For the bulls ? Simple, stay out and only look for setups on key support as mentioned above, for now you can use the 20dEMA for a small long entry with a very tight stop.
For bears ? Respect the short side as long as possible and use the support zones for profit taking and if support breaks look for new entries or to add to your positions if you want to be more aggressive.

Bitcoin is looking great so far!Once the potential Wave 2 correction is over, we can enter a potential Wave 3 on the daily timeframe, reaching at least 140k before the next "major" correction.

BTC bearish ideaBitcoin has been moving inside a downward channel and despite multiple attempts to break above, it still remained inside this channel, I believe this trend continues.
BTC - SetupWe narrowly missed triggering our short entry at $106K.
If you’re still looking for long entries — this could be your chance.
Now is likely a good time to go long on MARKETSCOM:BITCOIN , potentially targeting the ATH region and beyond, But we don’t have clear target regions yet — they will develop over time.

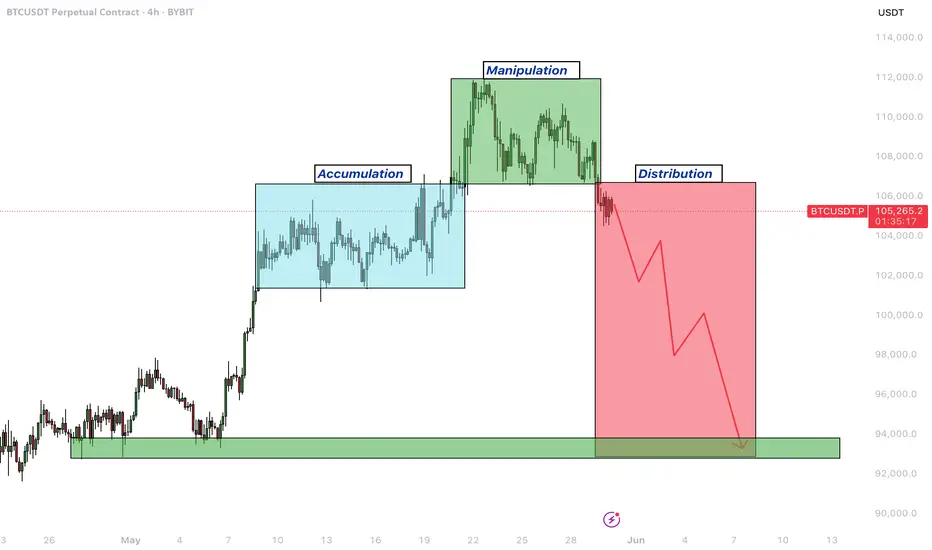
Bitcoin – Entering a distribution phase after a bull trap?Since the second week of May, Bitcoin (BTC) has exhibited a textbook accumulation phase, with a well-defined trading range forming just below the previous all-time high. Beginning around May 12, price action became increasingly compressed, marked by a series of higher lows and relatively flat resistance, indicating growing demand and waning selling pressure. This consolidation structure persisted for more than a week, suggesting that larger players were accumulating positions in anticipation of a breakout. Now it could be making the Power of 3. Accumulation, manipulation and distribution.
Accumulation, manipulation and distribution
Eventually, this coiled energy resolved to the upside. BTC broke through the upper boundary of the accumulation zone with increasing volume and momentum, triggering a sharp rally and leading to the formation of a new all-time high. At that point, market sentiment turned decidedly bullish, with breakout traders entering the market, expecting continuation. However, the price failed to sustain above the previous ATH for long. Despite the breakout’s initial strength, Bitcoin was unable to establish a solid foothold above the critical psychological and technical level, which has now proven to be a key inflection point.
Soon after setting a new high, BTC began to reverse, shedding gains and retracing back below the former resistance level, which had temporarily acted as support. The breakdown below the $106,000 mark, previously the ceiling of the accumulation range, signaled a notable shift in market structure. What was initially viewed as a healthy continuation pattern evolved into what now appears to be a classic bull trap. This type of failed breakout often leaves market participants vulnerable, as late buyers are caught in drawdowns and early longs may be incentivized to exit positions.
Given this context, the recent price action carries the hallmarks of a Power of 3, where market makers and institutions may be offloading positions to less informed participants. This phase is often mistaken for continued accumulation by retail traders due to its structural similarity; however, the key difference lies in the failure to maintain new highs and the emergence of lower highs on any attempted bounce. The rejection above the ATH and the subsequent breakdown below $106K has introduced significant overhead supply, which may act as resistance in the near term.
Target levels
As BTC continues to trade below this critical level, the likelihood of a further retracement grows. The market appears to be transitioning into a phase of redistribution or distribution proper, where price is likely to be capped on rallies and pressured lower over time. It is reasonable to expect that Bitcoin could revisit $100.000 to mid-$90,000s, an area that may serve as a magnet for liquidity and a potential staging ground for the next major move. This region could represent a "Last Point of Supply" (LPSY) within the Wyckoff framework, typically the final area where smart money distributes before initiating a more decisive markdown phase.
Nevertheless, this potential pullback should not be viewed solely as a sign of weakness. In many bull cycles, such corrections and shakeouts serve to flush out over-leveraged positions and reset sentiment, ultimately laying the groundwork for renewed upward momentum. Should BTC find stability and demand re-emerge in the $95K–$100K range, it could mark the beginning of a new re-accumulation phase, leading to a healthier and more sustainable advance.
Conclusion
In summary, the recent breakout above ATH followed by a sharp reversal and loss of key support paints a cautionary picture in the short term. Bitcoin may currently be navigating a distribution zone, with downside pressure likely to persist as the market digests recent gains. However, such corrections are typical in broader uptrends and often present opportunities for strategic entries once the next accumulation structure becomes clear. Patience and disciplined observation will be essential as the market defines its next directional bias.
Thanks for your support.
- Make sure to follow me so you don't miss out on the next analysis!
- Drop a like and leave a comment!