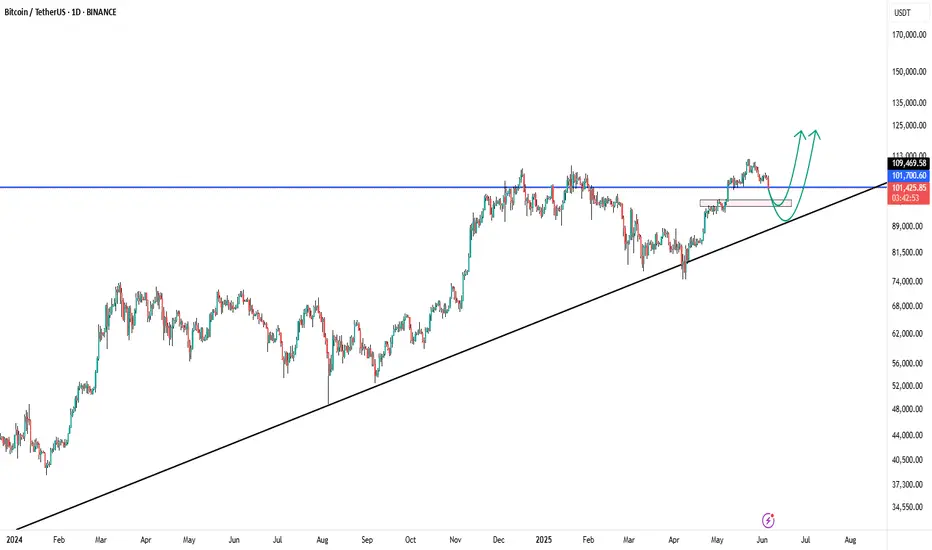
BITCOINBitcoin is approaching a critical confluence zone near $100,000, where two major supports intersect:
– A horizontal support around $100,000 (previous top-turned-support)
– A rising trendline drawn from the 2023 rally, currently aligning near $98,000 – $99,000
This zone is technically significant. A bounce from here could send BTC back toward the $129,000 resistance level
However, a daily candle close below this confluence (especially under $98,000) may trigger a deeper correction toward $90,000 or even $81,000
Watch price action closely—this region is not just support; it's a trend-defining battleground
BTCUSDT.3S trade ideas
BTC falling ... thanks orange swanBTC dumping through the volume gap. Oversold conditions will give you the best opportunities.
Full TA: Link in the BIO
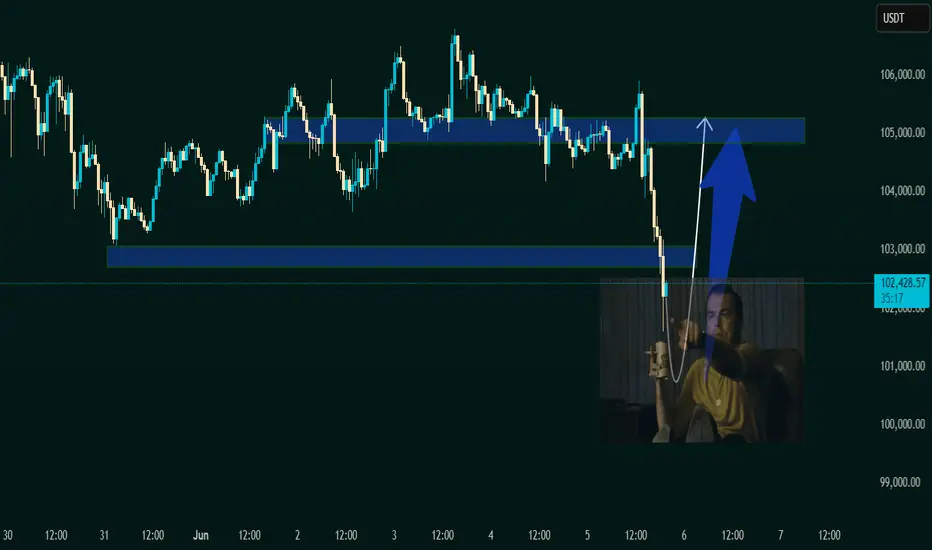
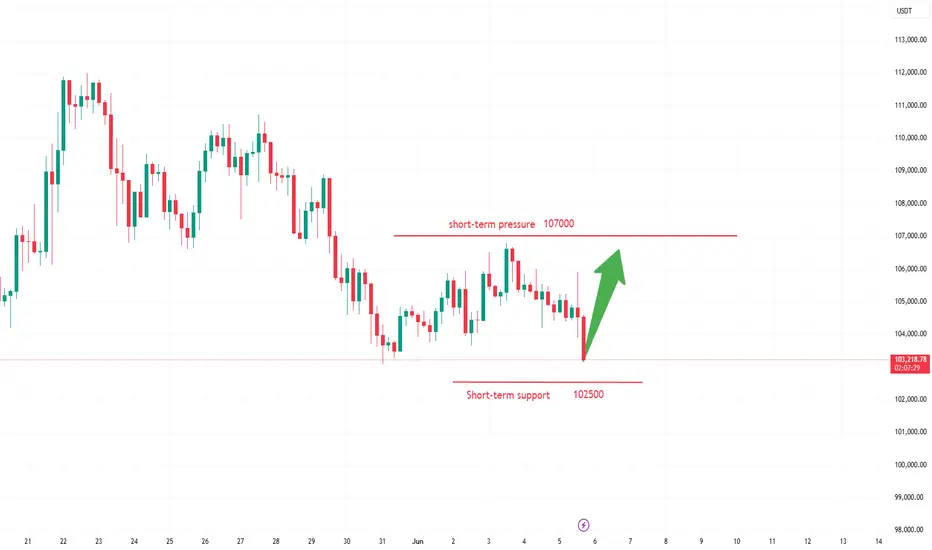
"Caught the Dip – Next Stop: Resistance Zone 1. Current Price Action:
The asset has bounced off the demand zone around 101,500 – 102,000 USDT.
It is now trading at 102,204.56 USDT, indicating early signs of the expected bullish move.
A white curved arrow suggests a rounded bottom pattern, often signaling a bullish reversal.
2. Demand Zone (Support):
Remains the same as the previous chart: 101,500 – 102,500 USDT.
Price reacted exactly at this zone and is starting to move upward.
3. Supply Zone (Target Area):
Clearly marked at 104,800 – 105,500 USDT.
This is where the expected bullish move could face resistance or where traders might look to take profit (TP).
4. Visual Reinforcement:
The large blue arrow indicates strong bullish momentum is anticipated.
The meme (Leonardo DiCaprio pointing) emphasizes that the reversal is happening as previously predicted — likely for motivational or engagement purposes in a VIP group.
---
🧠 Technical Sentiment:
Bullish Bias confirmed: Price bounced exactly from the demand zone.
Momentum Shift is underway, as indicated by the reversal pattern.
A potential "Buy Confirmation" is in play with room to ride up to the 105K resistance zone.
---
🎯 VIP Trade Setup Recap:
Parameter Value
Entry Zone 101,500 – 102,000 USDT
Current Price 102,204.56 USDT
Target (TP) 105,000 – 105,500 USDT
Stop Loss (SL) Below 101,000 USDT
Bias Bullish / Reversal
---
📌 Suggested Title:
"Reversal In Motion – Ride to 105K 🎯🚀"
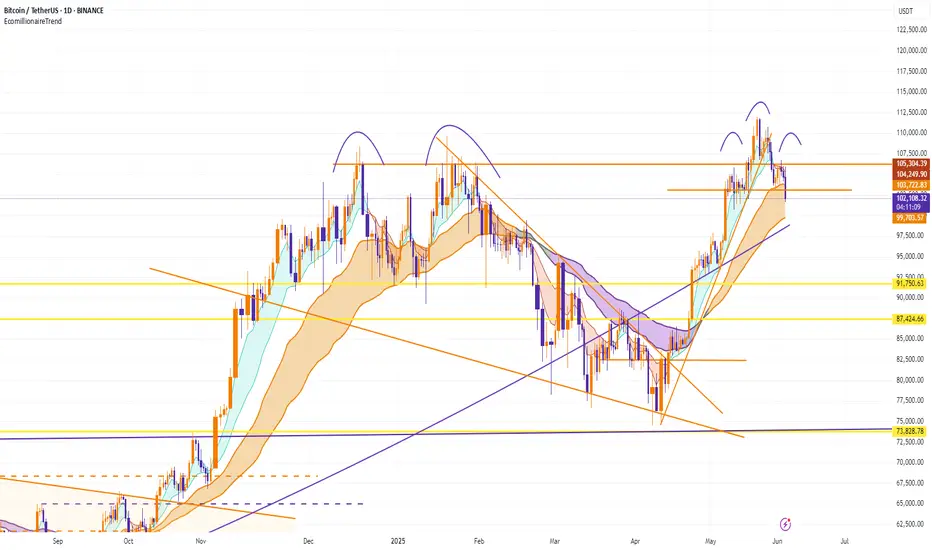
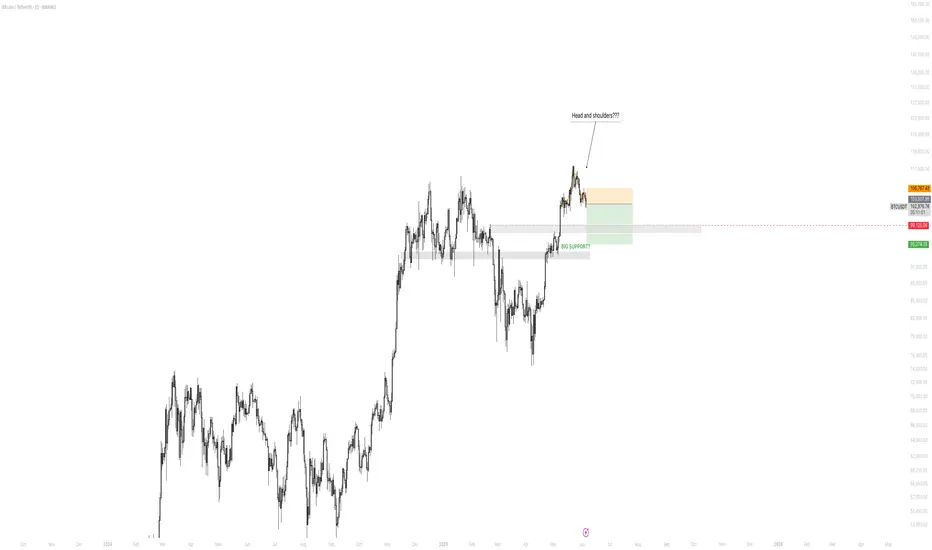
BTC PATo me it seems that the BTC chart is printing a traditional head and shoulders pattern, which would indicate probable lows at least in the short term.
Btc 99,999 Waiting/looking for a correction in june after a breakout, 99,7 or it could get nasty. Will watch for a break back above 99,7 to target 112k
BTC/USDTThe only re-entry I would consider as great in terms of risk reward is the region of 99-100k if market allows to visit. Orders are placed accordingly. In the meantime holding all positions since 77k re-entry.
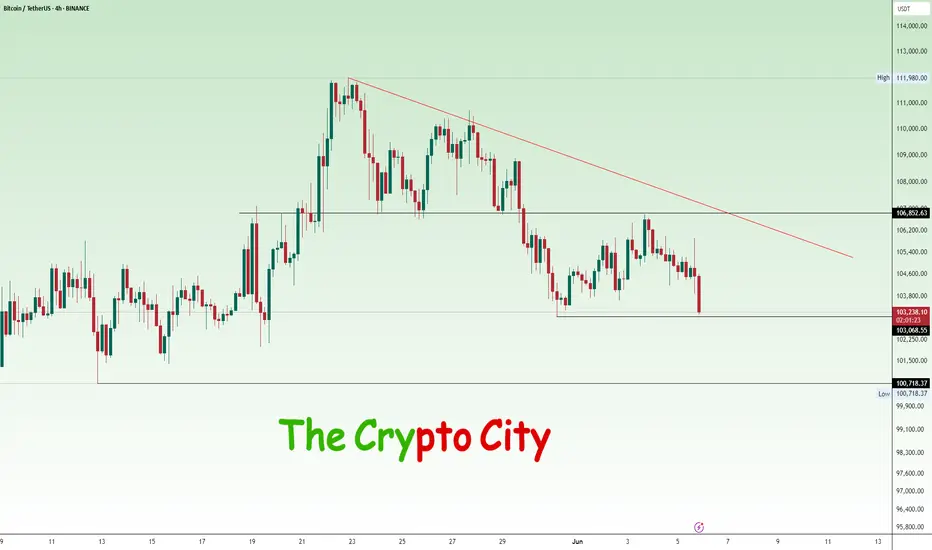
#BTC/USDT: Head & Shoulders Breakdown – $95K Incoming?Hey Traders!
If you’re finding value in this analysis, smash that 👍 and hit Follow for high-accuracy trade setups that actually deliver!
Bitcoin just broke below the neckline of a clear Head & Shoulders pattern on the 4H timeframe — a classic bearish signal.
As long as price stays below the neckline and fails to reclaim the $106.5K zone, we could be heading for a deeper correction toward the $95K–$98K support range.
Key Levels:
Breakdown Zone: ~$103.9K
Downside Target: $95K–$98K
Invalidation: Reclaim above $106.5K
Market is showing consistent weakness — small bounces are quickly sold off.
Let the pattern play out and manage your risk accordingly.
What do you think — short-term dip or deeper breakdown loading?
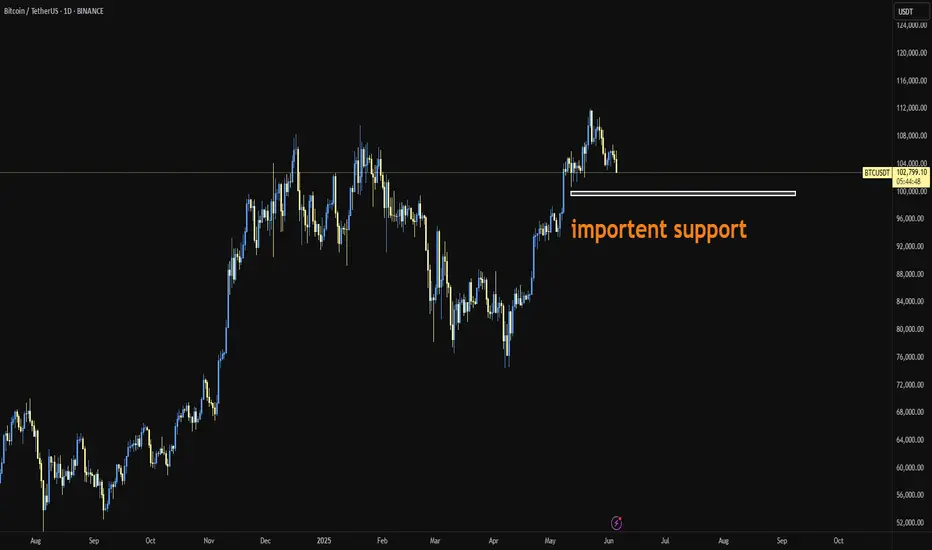
BTC USDTBitcoin is testing key support around $103K. A breakdown below this zone could open the door to sub-$100K levels. Watch closely!
Elliot Waves on the daily timeframeWave 5 should wrap up by tomorrow, and BTC should be set to hit new highs.

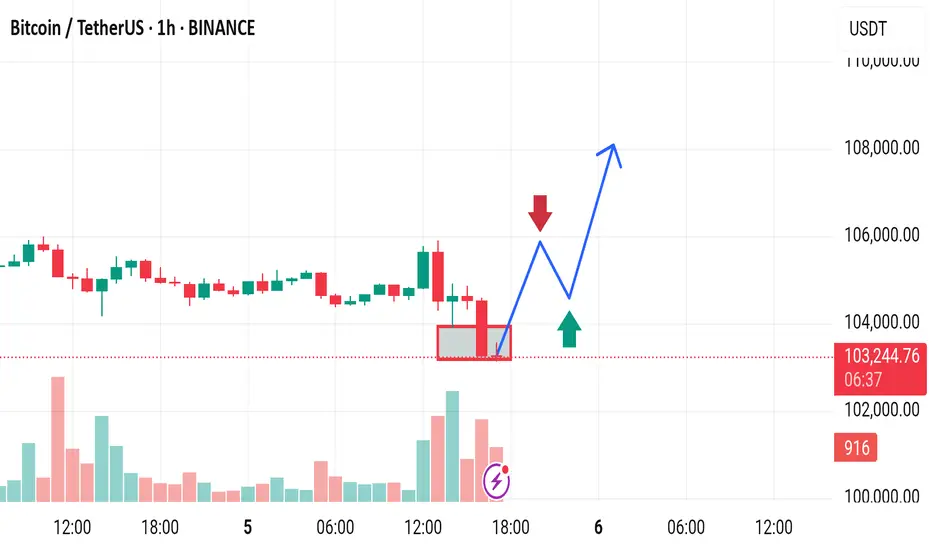
Market next move 🔍 Original Interpretation:
Support Zone: The red rectangle suggests a support level between ~102,800 and ~103,300.
Bullish Bias: The blue arrow anticipates a bounce from this zone, potentially forming a higher low before continuing upward.
Bearish Bias: The red arrow marks a potential resistance, predicting rejection and a move lower if the bullish breakout fails.
---
⚠️ Disruptive Analysis:
1. False Support Breakout Risk:
A false breakdown beneath the support zone could trigger panic selling before a rapid recovery (fakeout).
Traders might place stop-losses just below the box — a perfect target for market makers before price reverses.
2. Volume Deception:
Volume increased during the sell-off but did not show strong absorption by buyers (green volume wasn't dominant).
This suggests sellers still dominate and a continuation lower could occur before any bounce.
3. Lower Highs Formation:
The last few green candles failed to break the previous highs, indicating weaker buying strength.
Price may form a lower high, hinting at a short-term bearish trend.
4. Macro Trend Consideration:
If this is just a retracement within a larger downtrend, the bounce could be short-lived.
Broader market sentiment or macro news could push BTC toward 100,000 support or lower.
"A volatile pattern of seesawing between bulls and bears"The recent inflows into spot Bitcoin ETFs have slowed down, but institutions such as Standard Chartered still remain bullish on the long-term trend, with price targets potentially raised above $120,000. Meanwhile, institutions like Japanese listed company Metaplanet continue to increase their holdings of Bitcoin, demonstrating institutional recognition of Bitcoin's long-term value. However, it is worth noting that large wallets and old wallets showed synchronized selling in May, indicating some profit-taking pressure in the market. From the perspective of market sentiment indicators, the current market sentiment is rather complex, with both bulls and bears seeking direction and no strong unilateral tendency.
Humans need to breathe, and perfect trading is like breathing—maintaining flexibility without needing to trade every market swing. The secret to profitable trading lies in implementing simple rules: repeating simple tasks consistently and enforcing them strictly over the long term.
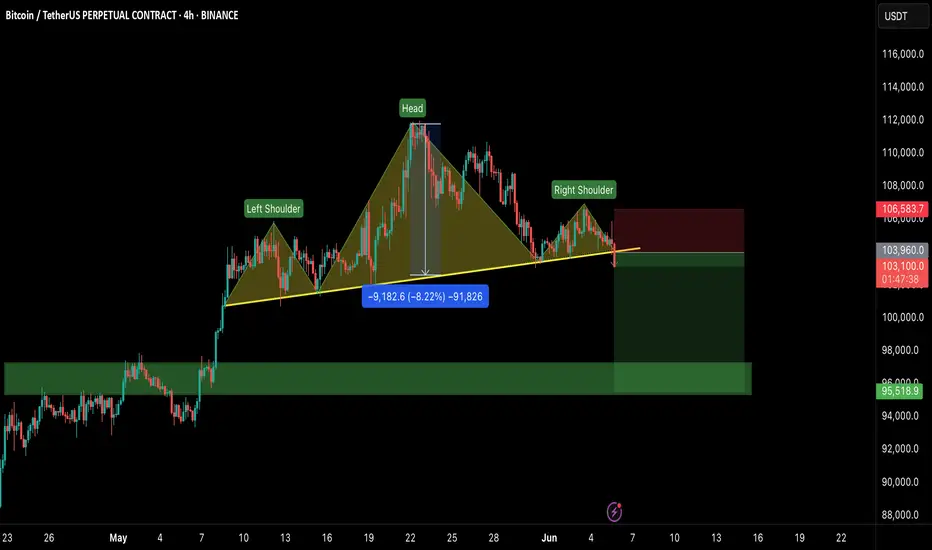
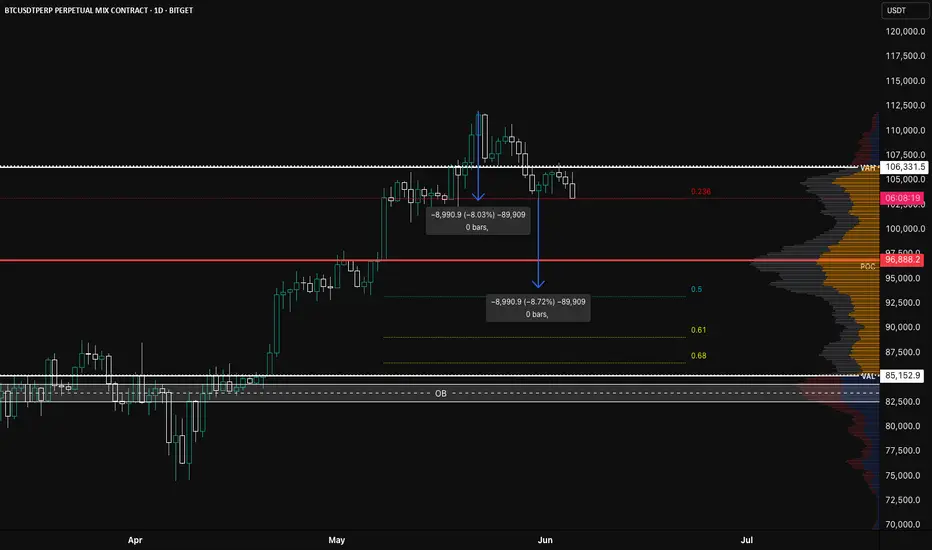
BTC/USDT.P Rejection Confirmed? Eyeing Breakdown Toward 50% FibBitcoin just lost two critical levels in rapid succession:
1️⃣ Value Area High ($106,331)
2️⃣ Previous Monthly High ($105,000)
We’re now closing candles back inside prior structure, showing signs of weakness and potential distribution at the highs.
📉 The Bearish Setup
Price is hovering above the 0.236 retracement. A break and daily close below this level could complete what looks to be the right shoulder of a developing head and shoulders pattern. The distance from head to neckline lines up with a projected move down toward the 50% Fibonacci level ($91,500) — which also aligns closely with the POC ($96,888) as an intermediate stop.
🎯 Targets:
• Neckline/Break Level: $102,800
• Mid-Target (POC): $96,888
• Main Target (0.5 Fib): $91,500
• Confluence zone lower: 0.618 to 0.68 (watch for reversals)
🧠 Context Notes:
• The current 2-leg rejection (~8% each) gives symmetry to the pattern
• High volume nodes around POC could act as reaction areas
• This short setup remains valid while price is closing below ~105k and failing to reclaim VAH
If this structure plays out, it’s a classic example of a failed breakout turning into a strong breakdown — the kind of move that catches late bulls off guard.
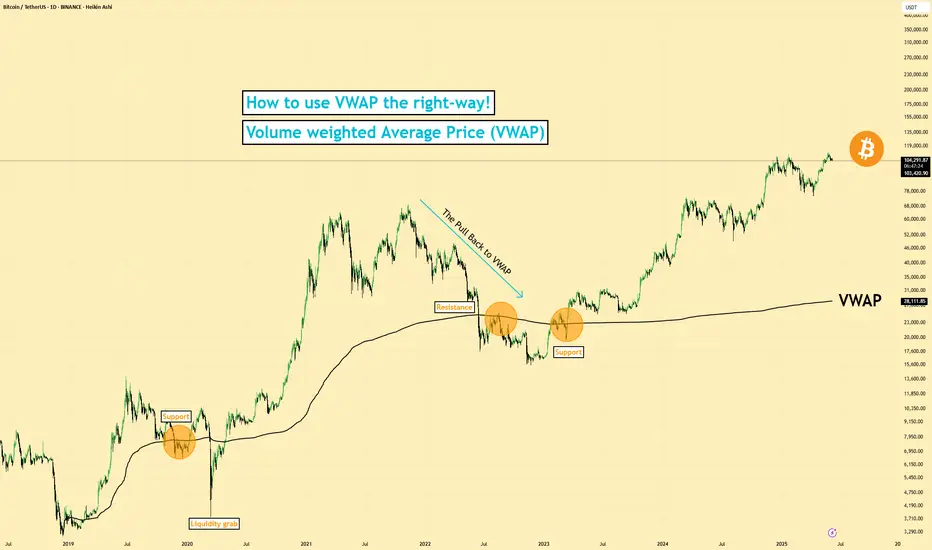
How to use VWAP the right-way on TradingView
1️⃣ What Is VWAP (Volume Weighted Average Price)?
VWAP stands for Volume Weighted Average Price. It's a tool that shows the average price an asset has traded at throughout the day, adjusted for volume. That means it gives more weight to prices with high trading volume.
✅ It helps traders and investors see if the current price is above or below the average price paid.
✅ It’s often used by institutional traders, such as mutual funds and pension funds, to enter and exit positions without causing major price moves.
VWAP = (Sum of Price * Volume) / Total Volume
2️⃣ Why VWAP Matters
I (Traders) often use VWAP as a dynamic support or resistance zone.
- Price below VWAP: considered undervalued by some 👉 may act as support
- Price above VWAP: considered overvalued 👉 may act as resistance
It acts like a magnet for price, especially in trending markets.
VWAP is also used as a benchmark for large players want to buy below VWAP or sell above it.
3️⃣ Anchored VWAP (AVWAP)
Anchored VWAP is a more advanced version of VWAP. Instead of starting at the market open, you anchor it to a specific candle (pivot high or low).
🔍 Why use it:
- Lets you analyze the average price from key market turning points
- Helps spot institutional interest near pivots
- More accurate for swing trading
When you anchor VWAP to a major high or low, it gives you clean zones where smart money might enter or exit.
4️⃣ How I Use Anchored VWAP
I personally anchor VWAP from:
- Major pivot highs/lows
- Breakout points
- Strong reversal candles
Then I watch how price interacts with it.
✅ Works well on 30m and 4H charts for intraday or swing setups
✅ Can be combined with fixed range volume profile for extra confluence
If you haven’t read my guide on fixed range volume profile, scroll below — it’s linked there.
5️⃣ Common Uses
✔️ Support and resistance zone in trending markets
✔️ Institutional entry/exit level benchmark
✔️ Reversion-to-mean setups
VWAP is used across timeframes. I use higher timeframes like 4H to spot trend zones, then zoom into 30m or 15m for entries.
Setting and more information
VWAP Explained by TradingView: tradingview.sweetlogin.com
Anchored VWAP Explained by TradingView: tradingview.sweetlogin.com
6️⃣ VWAP Limitations
⚠️ VWAP doesn’t work well in all cases:
- In sideways/choppy markets, it can lose value
- It is not an exact entry/exit signal, but rather a dynamic zone
- In FX markets, it’s unreliable due to lack of centralized volume data
Also, treat VWAP as a zone, not a line. Large players fill big orders in that area, expect false moves or liquidity grabs.
7️⃣ Mistakes to Avoid
❌ Entering blindly on VWAP touches
❌ Using VWAP without confirmation from price action or volume
❌ Assuming it always gives perfect levels
It works best when combined with other tools, such as market structure, support/resistance, and volume profile.
8️⃣ Final Thoughts
VWAP is a powerful tool to see where price is relative to volume-based value. Anchoring VWAP to key levels adds precision and insight.
Used properly, it helps:
- Spot where institutions might be active
- Confirm high-probability zones
- Improve entries/exits when paired with other tools
Examples are provided below to show how VWAP works in real-time setups. This guide is educational and for learning purposes only.
VWAP Zone and a Example trade CRYPTOCAP:BTC
Example Stock Market NASDAQ:AAPL
Example Resistance NASDAQ:MSTR
VWAP (Volume Weighted Average Price) helps traders see the average price weighted by volume. It's commonly used by institutions to identify good entry/exit zones. Anchored VWAP takes this further by starting from key points like pivot highs/lows for more accuracy. It's most useful in trending markets and works best when combined with tools like fixed range volume profile or support/resistance. While powerful, VWAP isn’t perfect it should be used as a dynamic zone, not a fixed level, and always with other confirmations.
Disclaimer: This is not financial advice. Always do your own research. This content may include enhancements made using AI.
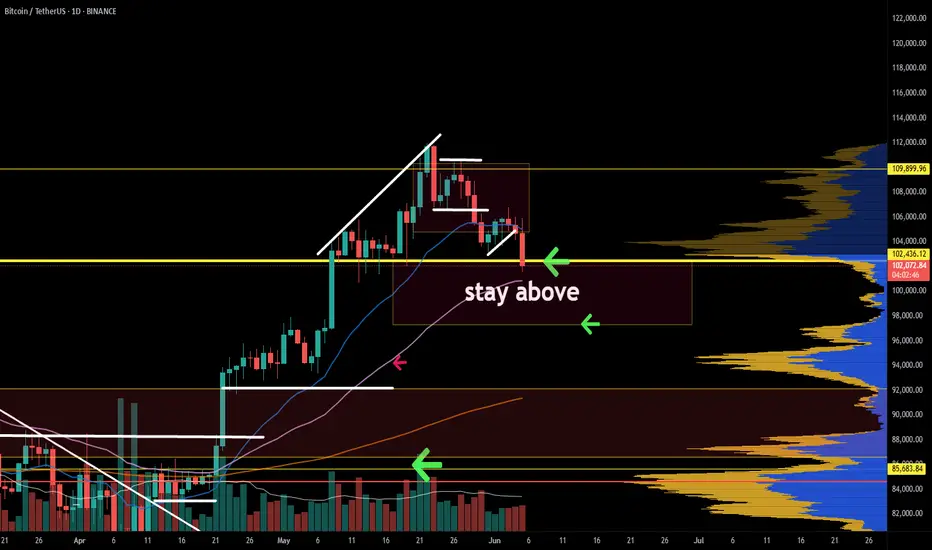
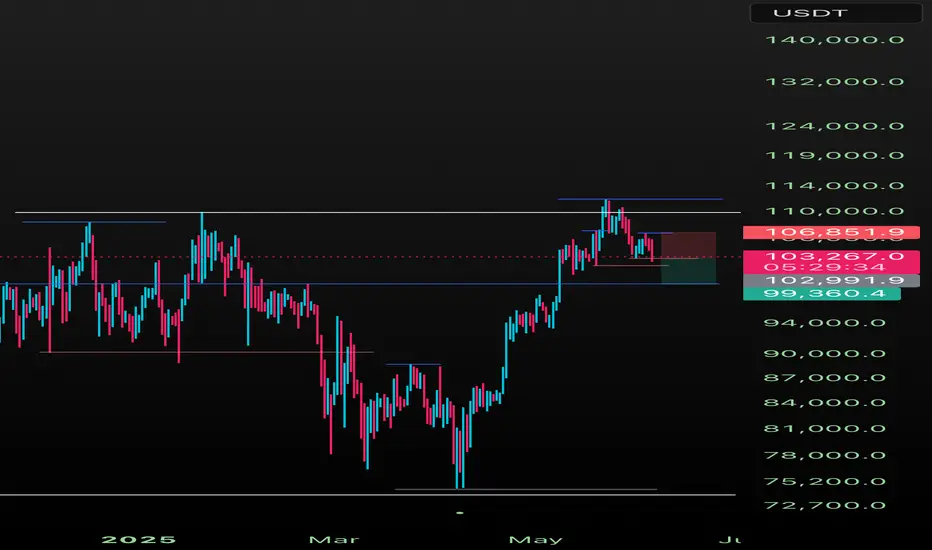
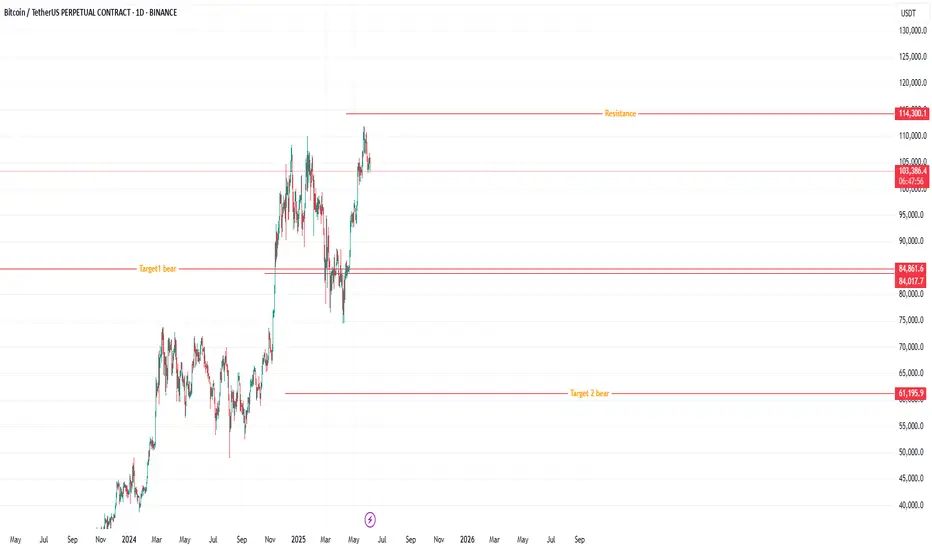
Btc daily chartBtc daily chart, key levels.
For a bullish scenario price needs to hold resistance as support
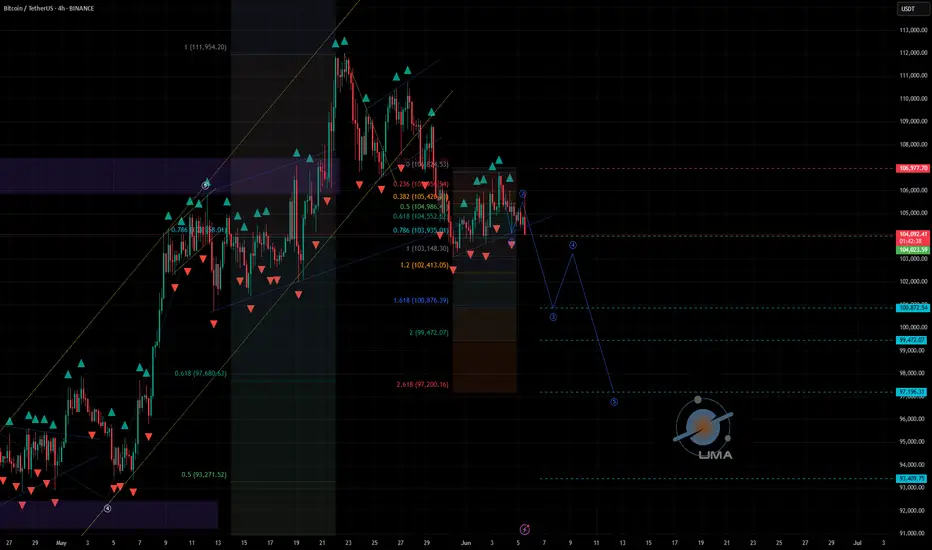
BTCUSD Analysis – Bearish Elliott Wave Structure UnfoldingAfter BTC recently made a high around 111,959, we observed a clear impulsive bearish move followed by minor pullbacks.
The current market price stands at 103,396, and based on the structure, it appears that BTC is unfolding a bearish Elliott Wave pattern. If this holds, we could be in the midst of Wave 3, which typically shows strong momentum and continuation.
Key downside levels to watch:
99,620
97,670 – This level also aligns with a bullish breaker on the 4H chart, making it a potential area of interest for buyers.
Strategy:
My current approach is to sell on pullback, targeting the formation of lower highs and aiming for a break below the recent lower lows.
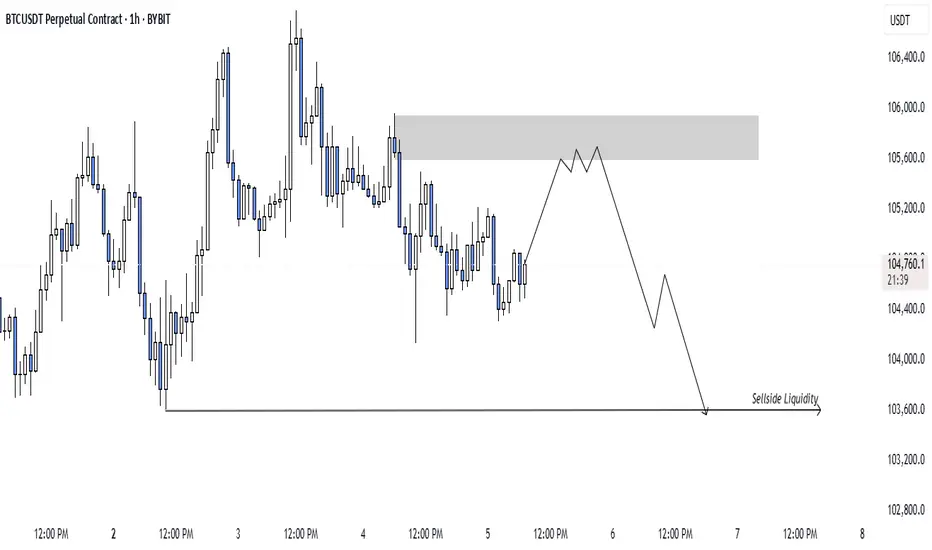
BTCUSDTHey traders
I can see sell setup BTCUSDT in 1hr time frame
wait for market to come here
Also use proper money management
Always wait for confirmation/strong setup for open a trade.
Thank you and Good Luck!
Happy trading.
The Collapse of the Bitcoin ExperimentFew are prepared for this scenario, yet it's the most probable one: Bitcoin is heading for a major crash in the coming years.
What was once a revolutionary idea has become a centralized shitcoin, failing nearly every purpose envisioned by its creator. Aside from gamblers and speculators, hardly anyone truly believes in Bitcoin anymore.
The experiment has failed — it's time to accept its fate.
This will be the biggest short trade in the history.
05 June, 2025
Doomsie

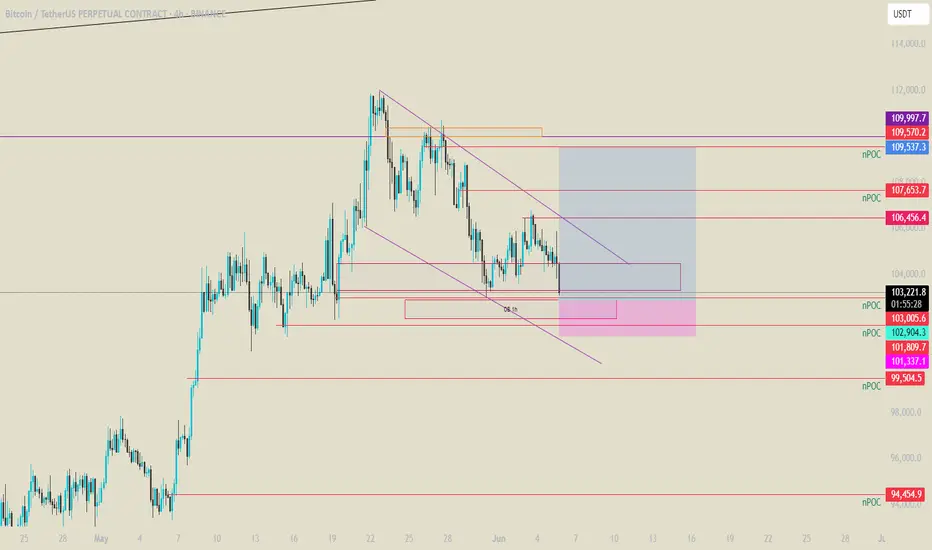
Bitcoin (BTC/USDT) Technical Analysis Bitcoin (BTC/USDT) Technical Analysis | Pressure Builds Below Trendline
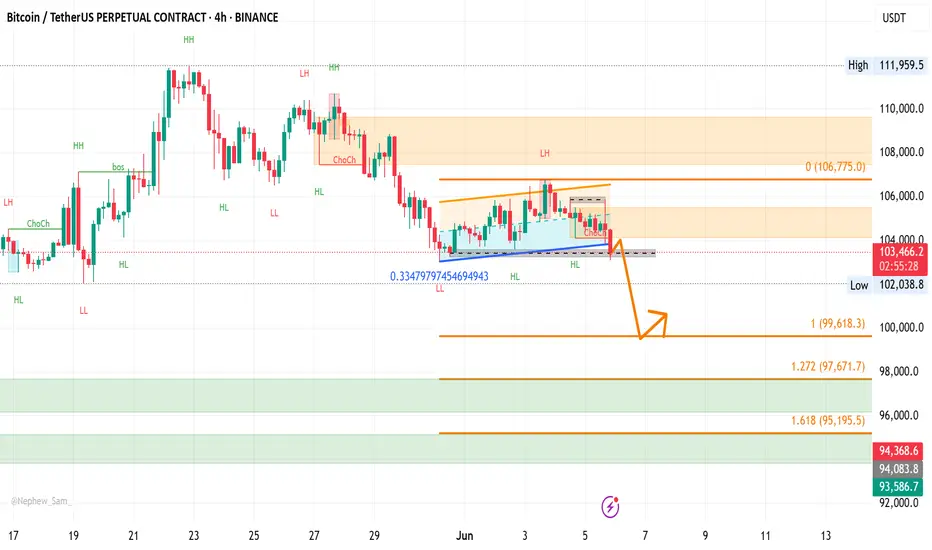
As outlined in the previous analysis, BTC dropped sharply after rejecting both a key horizontal resistance and the descending trendline (green). The price has now reached the orange support zone, and volatility is picking up.
🔻 Bearish Scenario: Breakdown Potential
As long as Bitcoin remains below the descending green trendline, the bearish bias stays intact. If the orange support breaks to the downside, watch for the next key levels:
$103,879 – short-term support
$103,286 – deeper support with price reaction potential
$102,600 – major demand zone
This could open the door to a broader correction.
🟢 Bullish Scenario: Breakout Attempts
On the flip side, if BTC breaks above the pink resistance zone, a short-term recovery may begin. Key upside levels to watch include:
The green descending trendline
$105,305 and $105,650 – important resistance clusters
A confirmed breakout could shift momentum back to the bulls.
📌 Summary
BTC is at a critical crossroad. A breakout or breakdown from current levels could define the next leg.
📊 Wait for candle confirmation and volume reaction before entering.
💥 If you found this breakdown helpful, smash that follow button for clean, real-time setups — no noise, just sharp trades.
📈 Let’s grow your trading game together!

BTC looking brittleBTC 1 hour chart just passed DOWN 50 and 200 SMAs. Probably nothing, or maybe something bigger is brewing given that it's a speculative asset with massive volatility.

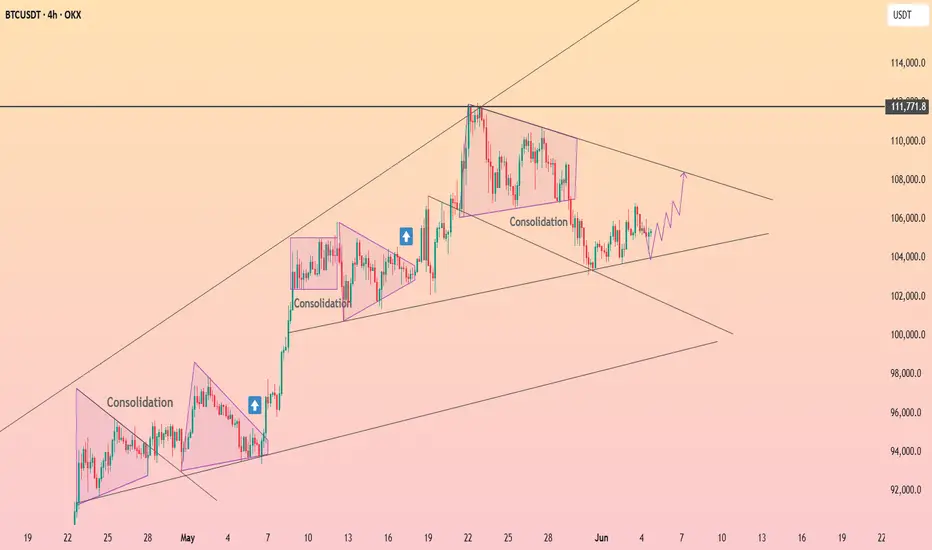
HolderStat┆BTCUSD pennant pauseCRYPTOCAP:BTC cools under 106 k inside a narrowing pennant pinned to its long-term rising rail. Successive ascending consolidation triangles hint at continuation, projecting a thrust toward the 111 k resistance shelf. Holding the pattern’s base keeps breakout odds tilted north.
BTCUSDT - UniverseMetta - Signal#BTCUSDT - UniverseMetta - Signal
H4 - Formation of a 3-wave structure + exit from the channel. It is better to reduce risks. Stop behind the maximum of the 1st wave.
Entry: 104023.59
TP: 100872.54 - 99472.07 - 97196.31 - 93409.75
Stop: 106977.70