BTC _ Ultra mega quick scalpsAs said , quick scalps at cmp sl 104,000 targets of smooth 106,100 and 106,750! Enjoy it
BTCUSDT.3S trade ideas
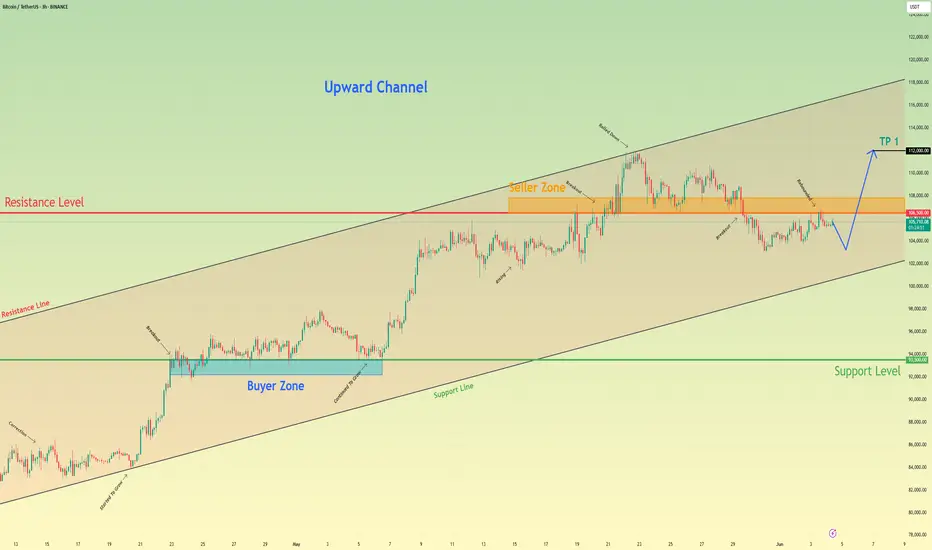
Bitcoin may break resistance level and continue to move upHello traders, I want share with you my opinion about Bitcoin. If we look at the chart, we can see how the price entered an upward channel and declined to the support line. Then it started to grow and soon reached the 93500 support level, after which it broke this level and then some time traded near. After this, the price rebounded and continued to move up inside an upward channel, where it later reached a resistance level, which coincided with the seller zone. When BTC reached this level, it broke it too and even rose to the resistance line of the channel, but soon it turned around and dropped to the seller zone. In this area, the price long time traded and later tried to grow, but failed and continued to decline. Soon, BTC broke the 106500 level and fell below the resistance level. But recently, price turned around and grew to this level again, and now trades very close. In my opinion, Bitcoin can decline a little and then break the resistance level one more time. After this movement, I expect that the price will continue to move up inside the upward channel, so I set my TP at 112000 points. Please share this idea with your friends and click Boost 🚀
Where Can Bitcoin Go? Part 7Title: Where Can Bitcoin Go? Part 7
Post:
🌍📊 Where Can Bitcoin Go? Part 7 🧭🔥
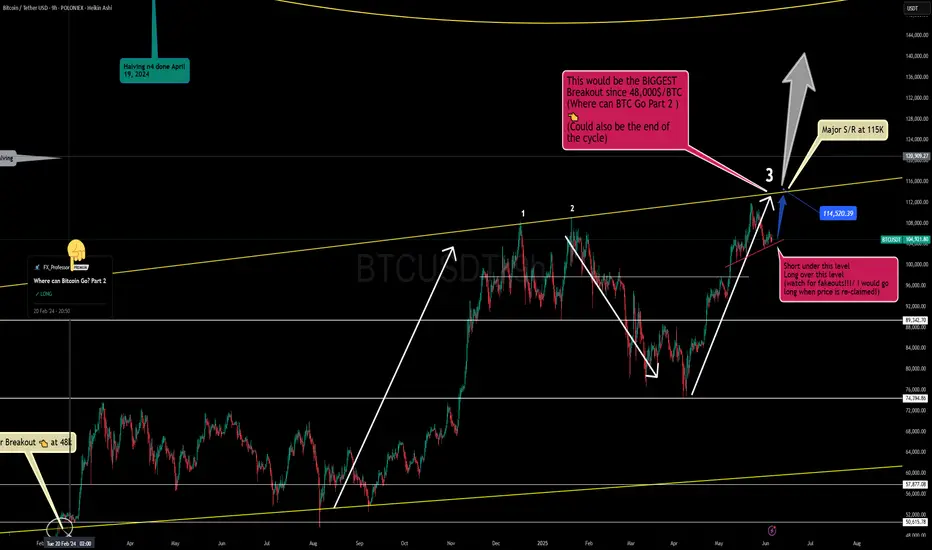
This is it — Part 7 of our ongoing macro Bitcoin analysis — and this one is rooted in the three all-time trendlines that I’ve used for years to map out Bitcoin’s biggest moments.
We are now heading north, potentially to do something historic : test the upper trendline resistance for the third time . 📈
When Bitcoin does this, it tends to either break out massively ... or signal the end of a cycle . That’s why this zone — 114.5K to 115K — is critical . A successful breakout here and $100K becomes history . It would unleash Bitcoin into a new phase of its long-term bullish evolution. 🦅
On the flip side: this might also mark the final resistance of the current cycle . Either way, it’s a zone where serious decisions will be made — and manipulation will likely spike. 👀
🔑 Key Levels:
114,520–115,000 : Breakout zone — reclaim this and we’re headed higher.
97,770 : Key support — fail to hold, and we reassess the bullish case.
🎥 Want to better understand the levels in play? Watch my latest video idea, where I draw comparisons between BTC now and the Brexit 2016 setup. This will help you see why I’m preparing for major volatility . 🚀📈 Bitcoin smells like 'Brexit to the NORTH Pole!' 💥🇬🇧
I’ll post the video link below once live — keep an eye out for it!
👇 Previous post: “Bitcoin smells like 'Brexit to the NORTH Pole!’”
One Love,
The FXPROFESSOR 💙
ps. Big breakout at 115k or end of cycle? I am hoping for the first!
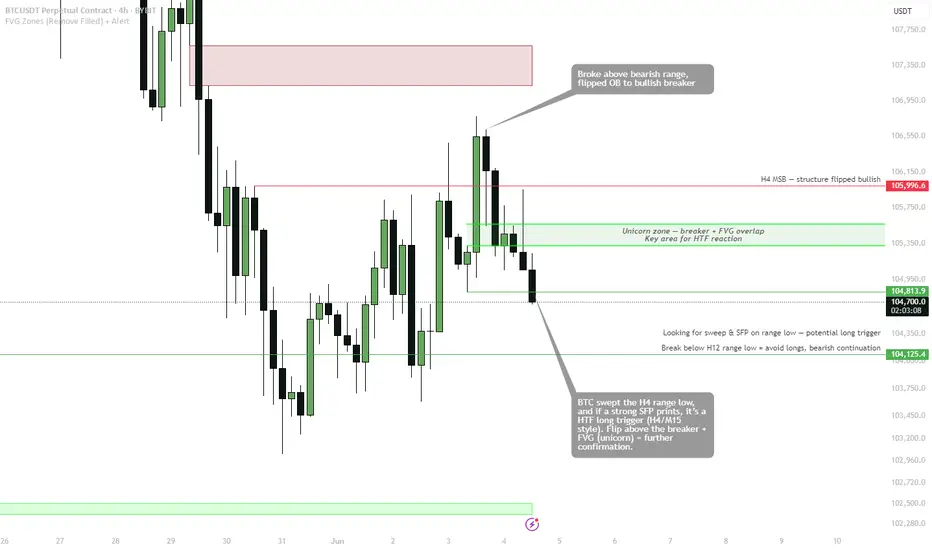
BTC - HTF confirmation pending...BINANCE:BTCUSDT
Sweeping H4/H12 range low — watching for SFP or strong bounce as a long trigger.
H4 structure broke bullish, flipped OB to breaker (unicorn overlap).
Long on sweep & SFP, target back to H4 MSB and range high.
Break below $104,400 — plan invalid, stay flat.
Wait for candle close, don’t front-run.
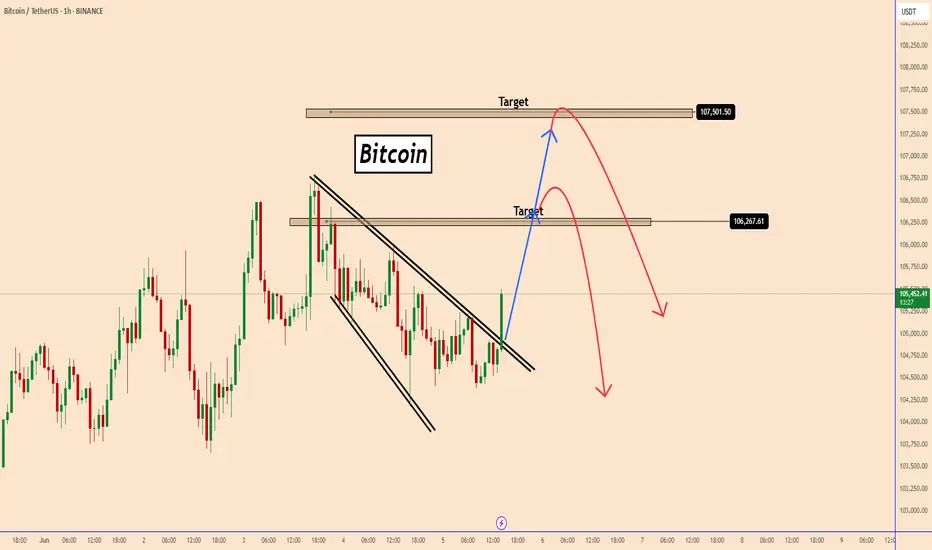
BTC: Short-Term Bullish Setup - Raising to 107.5k ?BTC: Short-Term Bullish Setup - Raising to 107.5k ?
On the 60-minute chart, Bitcoin has initiated a bullish movement, with a clear breakout and strong upward momentum.
BTC is expected to retest the top of the structure, where it may face resistance and potentially decline again. If the pattern unfolds as anticipated, Bitcoin could extend its bullish rally to 107.5K.
This movement appears to be influenced by several factors, though overall, market conditions have remained unchanged throughout the week.
Today’s price action reflects a technical shift rather than a fundamental development.
You may find more details in the chart!
Thank you and Good Luck!
❤️PS: Please support with a like or comment if you find this analysis useful for your trading day❤️
Bitcoin Long Setup – Chart Analysis (June 5, 2025)We are the SeoVereign Trading Team.
With sharp insight and precise analysis, we regularly share trading ideas on Bitcoin and other major assets—always guided by structure, sentiment, and momentum.
🔔 Follow us to never miss a market update.
--------------------------------------------------------------------------------------------------------
Bitcoin technical analysis is presented as follows.
The current wave structure, based on Elliott Wave Theory, appears to be in the final stage of the corrective pattern, specifically in WAVE Y. Notably, WAVE Y has extended to 1.618 times the length of WAVE W, which suggests a potential completion of a typical WXY corrective pattern. This can be interpreted as a strong reversal signal.
In addition, the 1.414 Butterfly pattern, one of the harmonic patterns I have been monitoring, has also completed in the same zone. As Butterfly patterns often indicate high reversal probability between the 1.272 and 1.618 levels, the precise formation at the 1.414 ratio adds further technical confirmation and reliability to this signal.
In summary, the convergence of these two technical factors strongly supports a bullish bias at the current level and increases confidence in a potential short-term price rise for Bitcoin. Therefore, this zone is considered a strategic point for entering a long position.

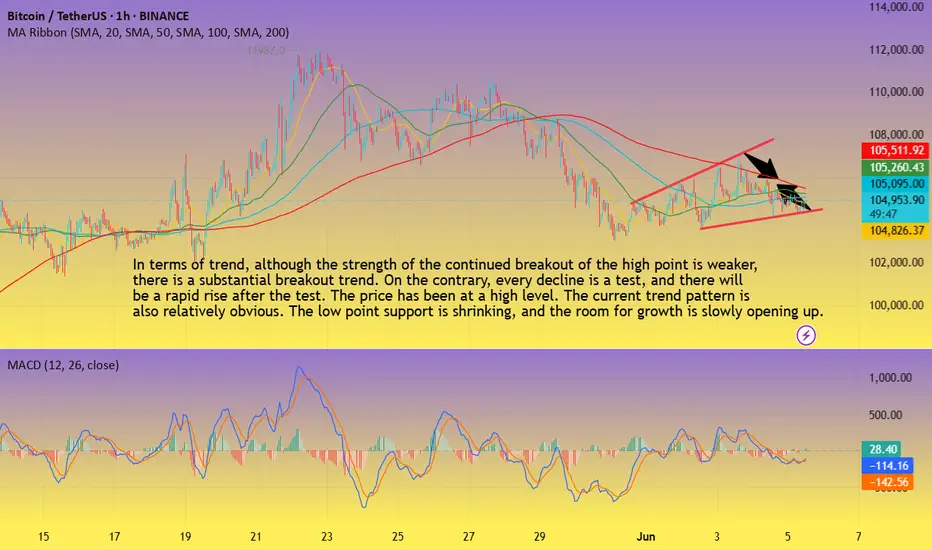
BTC-----Buy around 104800, target 106000 areaTechnical analysis of BTC contract on June 5:
Today, the large-cycle daily line level closed with a small positive line yesterday. The K-line pattern has continuous positive and negative lines, but if we look carefully, we will find that the price has been at a high level, and every retracement trend is testing support, and the rise is breaking the high, although it has not continued, so in this case, it is still very easy to pull up and break; the short-cycle hourly chart price is oscillating in a small range, and the upward channel is slowly opening in the trend pattern, and the support for the decline is moving up. This is relatively clear. The current K-line pattern is continuous positive, and the attached indicator is golden fork, so there is a high probability of rising during the day. Whether the European session can break the high is to focus on.
BTC short-term contract trading strategy:
The current price is more in the 1048000 area, the stop loss is in the 1043000 area, and the target is in the 106000 area;
Bitcoin's Roadmap: Price Structure, Fair Value & Market RhythmSince bottoming on November 21, 2022, Bitcoin has embarked on a remarkable bull run, rising +623.5% over 927 days and reaching a new all-time high (ATH) of ~112K.
When compared to the previous bull cycle, spanning 1061 days and producing a +2086% gain, this current rally shows signs of diminishing returns, a typical behaviour of maturing markets. Traders now face a critical question: has Bitcoin peaked for this cycle, or is another surge toward ~120K+ possible?
Historical Echoes: Elliott Wave Comparison
The 2018–2021 bull market formed a five-wave Elliott structure. That cycle ended with a -77.5% correction. The current cycle similarly traces out a completed five-wave advance from the $15.5K low, suggesting we may now be in a corrective phase.
Current hypothesis: Bitcoin is in Wave B of an ABC correction, with Wave C potentially targeting $64K–$70K.
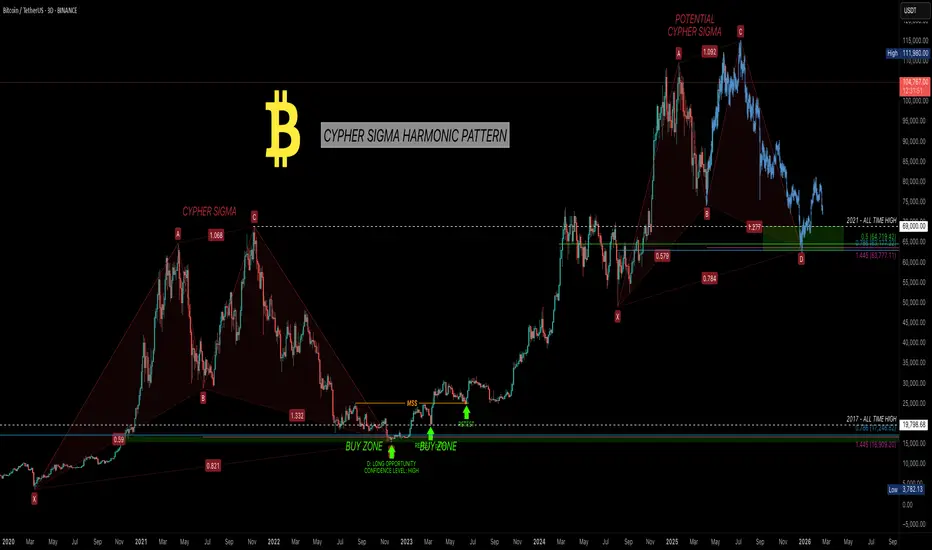
Harmonic Confirmation: Cypher Sigma Pattern
A refined harmonic formation, I call it the Cypher Sigma Harmonic Pattern (CSHP) and it has proven highly effective in volatile assets like Bitcoin. It differs from the classic Cypher by:
BC projection: 1.07–1.136 of XA (vs. 1.272–1.414)
CD retracement: 0.786–0.886 of XC
BD extension: 1.272–1.618 of BC (not present in traditional Cypher but often targets 1.272-2.0)
In 2022, this pattern predicted the bottom near $16K. Currently, another Cypher Sigma is potentially forming, pointing to a possible correction to ~$64K. This target aligns with historical level (the 2021 ATH zone) and represents a possible -40% pullback.
Multi-Layered Technical Confluence
Pitchfork Resistance: Bitcoin rejected the upper resistance (Fib 1.0–1.136 zone)
Pitchfork Golden Pocket Support: ~$64K matches the golden pocket and high-liquidity area
Fibonacci Circles: Rejection precisely at the 1.618–1.65 circle arc (~$112K)
Speed Fan 0.618: Key structural support intersects projected retracement zone
Previous 2021 ATH
Together, these tools strongly support the hypothesis of a macro top forming.
Fair Value Trend Model (FVTM) – New Indicator
As part of ongoing research into Bitcoin’s long-term valuation, I developed the Fair Value Trend Model—a logarithmic regression-based indicator tailored for Bitcoin. Here is an example on the monthly timeframe.
Key Features:
Computes a log-log regression: ln(Price) vs ln(Days since inception)
Yields a power-law growth curve: F(t) = C · ^b
Includes dynamic channel bands at user-defined percentage offsets
Projects the trend forward in time with linear extrapolation
I have just freshly published this indicator for free on TradingView. Visit my profile, add it to your chart, and explore how Bitcoin consistently revisits its fair value in bear markets before launching new macro waves.
Use Cases:
Identify overextensions above the fair value channel
Spot mean-reversion setups near the lower channel band
Gauge long-term trend continuation via slope and forecast
The indicator is best used on daily, weekly and monthly charts, and it supports both all-time and rolling-window modes.
Educational Insight:
The Fair Value Trend Model isn’t just a tool! It's a lens to view the long-term rhythm of the Bitcoin market. By understanding where the fair value lies, you gain the clarity to separate short-term volatility from long-term opportunity.
Every great trader starts with a desire to understand. If you're learning, experimenting, and observing patiently—you’re on the right path. Let this model be your guide through the noise. Trust the math, respect the cycles, and never stop refining your edge.
Study day and swing trading, improve your technical and psychological skills, and wait patiently for high-probability trade setups, whether short-, medium-, or long-term. Being patient is key.
Psychological Insight: Mastery Over Impulse
The greatest returns favour the patient. Traders who ignored the noise in 2022 and accumulated around $16K were rewarded exponentially. As Bitcoin potentially enters a correction, the same principle applies: monitor, learn, and prepare—not panic.
Top-tier traders execute based on structure, not emotion. This cycle will reward those who:
-> Study multi-timeframe confluences
Outlook: Bearish Retracement, Bullish Opportunity
While a push to $120K+ is possible, the confluence of Elliott Wave, harmonic patterns, and macro tools suggest a potential 40% retracement into ~$64K by end of 2025/early 2026. This aligns with historical patterns and may offer a great buying opportunity.
This cycle isn’t about catching the exact top—it’s about navigating it intelligently. Use tools that reflect structural value, not just reactive price action. Combine the Fair Value Trend Model with other tools to gain clarity. Most importantly: remain curious, remain disciplined.
Happy trading.
Thanks for reading =) stay sharp, stay patient, and keep evolving 🚀
_________________________________
If you found this helpful, leave a like and comment below! Got requests for the next technical analysis? Let me know.
VSA vs BTC: Into a Bearish Scenario or Not?Predicting the market requires skill.
Most traders fail at one crucial point: they don’t see the market as a living, breathing organism—a structure where one move leads to another, like cause and effect in motion.
That’s what we often call reading the psychology of the market. When you begin to grasp the fundamental principles behind that, you step into the realm of elite traders.
And yes—Volume Spread Analysis (VSA) is a powerful tool, but only if you know how to read it properly.
I’m not a certified trader or financial advisor, and I don’t give signals, entries, or exits. I’m simply a solo observer, sharing a slice of what true technical and fundamental analysis looks like.
And yes—it takes time. It takes skills. Now, if we want to even attempt predicting the future of price action, we must understand something: A chart is not a single truth. It’s a battlefield of conflicting signals.
Patterns, marks, levels—some suggest bullish continuation, others hint at sharp reversals. Confusion is inevitable if you don’t learn to distinguish which signs matter.
In our current BTC chart, we’re witnessing this contradiction unfold clearly:
• A bullish flag formation...
• Yet within it, the emerging completion of a Head & Shoulders pattern!
How arrogant can the market be! 😄
A moment to laugh—but also a moment to observe how cleverly the crowd is misled.
This is classic manipulation, wrapped in a textbook setup.
But what’s most telling isn’t the pattern on the surface—it’s the volume beneath the structure.
It’s always the quiet details that speak the loudest.
Before price shows its true face, volume often leaves footprints. In our case, those footprints were already leading toward a bearish path—long before the structure began to shape itself clearly.
So while retail eyes focused on the bullish flag, the underlying volume had already begun withdrawing support.
Not aggressively—no. Subtly, almost elegantly, in that familiar way institutions mask intention:
• Spikes that don’t hold
• Buying that doesn’t follow through
• And a steady fade in commitment as price climbs into weakness
It’s in those quiet inconsistencies where VSA earns its value.
It tells us: the move isn’t about what’s obvious.
It’s about what never fully materialized.
So yes, the pattern may still remain incomplete. The Head & Shoulders may yet fail to validate.
But for those who were watching volume first—not structure—the script was already being written.
✒️ From now on, professionally speaking, we must still wait:
• For the Head & Shoulders to confirm or dissolve. So eyes targeted at the swing low level near 107k
• And for volume to either legitimize or invalidate the entire setup
Only then does the chart grant us permission to speak in certainties.
🐾 But so far…
• The clues have favored the bears.
• Sell opportunities appeared early and often—for those who know what to look for.
• Bullish spikes in volume? They were met with silence.
• Momentum fizzled under a macro backdrop of fading demand.
If you were in the right mindset, and aligned even the lower timeframes to basic structural zones,
you already saw the path ahead wasn’t being carved by the bulls.
Let them finish the patterns.
Let the candles paint the story.
But for those trained in volume, the ink has already dried.
And if you're still reading, maybe you already sense it—
real insight doesn’t shout, and it never floats in abundance.
Value has never been about noise. It’s about what’s rare, quiet, and overlooked by the crowd.
Just like in the markets—the true signals aren’t loud, and they’re never free in the economic sense.
Just as price rises where supply thins, the same applies here:
what’s scarce... holds weight.
PS For last A little exercise, something to grasp on. Have you noticed how Volume & RSI behaves in lower time frames? 4Hour or 1Hour for example. Can you identify how volume confirms a bearish move. Do you discover the correct correlation and combined use between VSA & RSI. Remember my previous insight
See you next time!

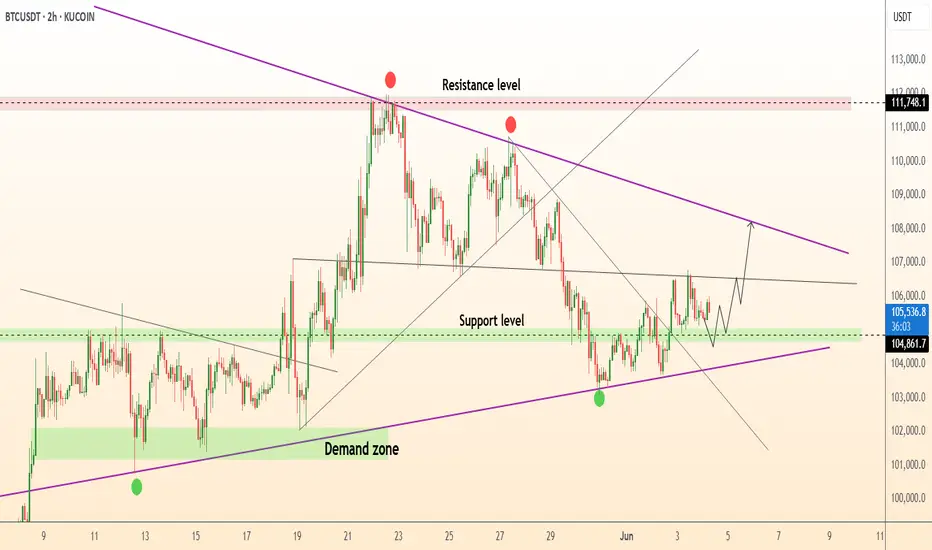
DeGRAM | BTCUSD retesting the $105k📊 Technical Analysis
● Triple bounce at 104.8 k-105 k and the violet trend-line created fresh higher-lows while keeping price above the May demand block.
● A two-week falling trend-line has just been cleared and retested, unlocking the next pivot at 108 k; flag depth from 105 k projects to the 111.7 k supply/upper channel rail.
💡 Fundamental Analysis
● FXStreet highlights US job openings at a 3-yr low, pressuring yields, while CoinShares tracks another $450 m spot-ETF inflow and exchange balances at a 4-yr trough, signalling a tightening float.
✨ Summary
Buy 104.8-106 k; clearance of 107 k aims for 111 k, stretch 115 k. Long thesis void on a 2 h close < 103 k.
-------------------
Share your opinion in the comments and support the idea with a like. Thanks for your support!
BTC SHORT BTC SHORT
ENTRY : 106534.9
PROFIT : 104234.4
STOP : 107221.9
ALL trading ideas have entry point + stop loss + take profit + Risk level.
hello Traders, here is the full analysis for this pair, let me know in the comment section below if you have any questions, the entry will be taken only if all rules of the strategies will be satisfied. I suggest you keep this pair on your watchlist and see if the rules of your strategy are satisfied. Please also refer to the Important Risk Notice linked below.
Disclaimer
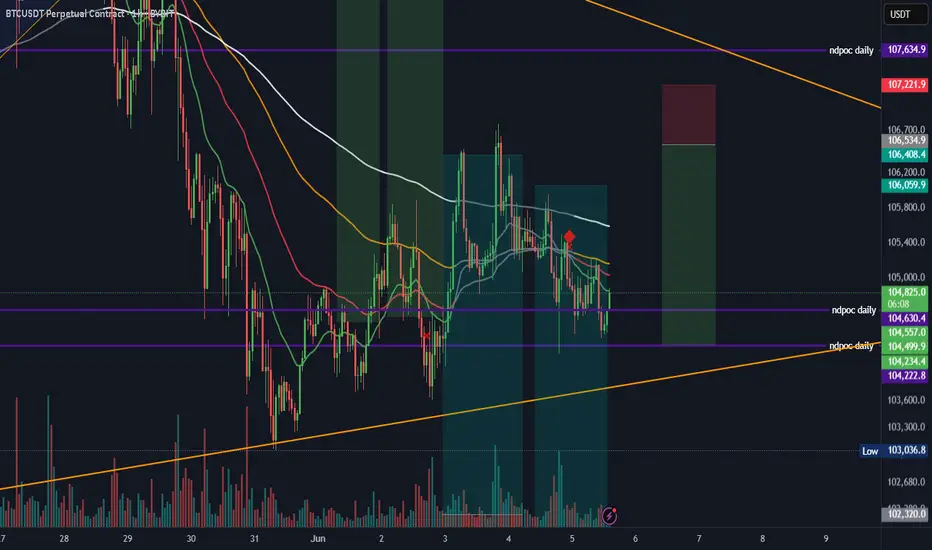
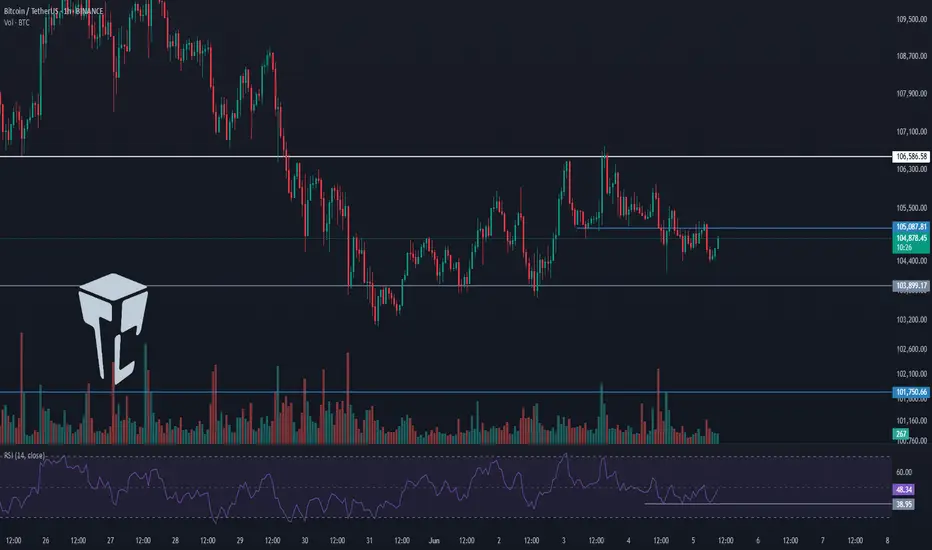
TradeCityPro | Bitcoin Daily Analysis #108👋 Welcome to TradeCity Pro!
Let’s dive into the analysis of Bitcoin and key crypto indices. As usual, in this analysis, I’ll review the futures session triggers for New York.
⏳ 1-Hour Timeframe
As you can see in the 1-hour timeframe, yesterday the 105087 trigger was activated, and now after a pullback to that level, the price is heading toward the 103899 support.
💥 If you entered a short position based on the 105087 trigger, you can hold it until 103899. If you haven’t opened a position yet, you can consider today’s triggers.
🔽 The first short trigger for today is the 103899 level. A break below this level can start a major bearish move. Personally, I’ll enter a short if this level breaks.
⚡️ Breaking below 38.95 on the RSI will give us a suitable momentum confirmation. If selling volume increases, the probability of a bearish move will rise.
📈 For long positions, our first trigger is the same 105087 level. If a higher low is formed compared to 103899 and this level breaks, it will provide a good long opportunity.
💫 The main long trigger is 106586. If this level is broken, the uptrend can resume and price could move toward higher resistance levels.
👑 BTC.D Analysis
Looking at Bitcoin Dominance, a range box has formed between 63.93 and 64.23.
✨ A break above 64.23 confirms bullish continuation, while a break below 63.93 confirms a bearish trend in dominance.
📅 Total2 Analysis
Moving to Total2, yesterday it closed below 1.17, and now after a pullback, it's heading toward 1.16.
✅ If 1.16 breaks, a short position can be opened. If the downward move turns out to be fake, a break above 1.18 gives us a long trigger.
📅 USDT.D Analysis
Looking at Tether Dominance, yesterday it confirmed above 4.70 and is now moving toward 4.79. A break of 4.79 could signal a continuation of the upward move.
📊 If it closes back below 4.70, the price could move toward 4.64. A break below 4.64 would signal a bearish trend in USDT dominance.
❌ Disclaimer ❌
Trading futures is highly risky and dangerous. If you're not an expert, these triggers may not be suitable for you. You should first learn risk and capital management. You can also use the educational content from this channel.
Finally, these triggers reflect my personal opinions on price action, and the market may move completely against this analysis. So, do your own research before opening any position.
BTC Long: Entry in 104.7-105.1k on PDL Sweep & OB ActionHey everyone! 🚀
BTC is signaling bullish intent:
Clear order flow from the 78.6% Fib level.
HTF structure continues its uptrend 📈.
This points to a potential trend-following LONG opportunity.
🎯 Entry Zone to Watch: 104,783 – 105,127
Confirmation Checklist for Long Entry:
1️⃣ Mitigation of the 4H Order Block .
2️⃣ Liquidity sweep below PDL (Previous Day's Low) into the OB.
3️⃣ Confirmation on the lower timeframe
👀 I’m now waiting to see the price reaction to this Order Block if price reaches it. Stay tuned!
Trade safe and manage your risk!

BTC:Trendline Test in Play Wait for Breakdown Before Shorting📉 Bitcoin 4H Chart: Trendline Test in Play — Wait for Breakdown Before Shorting
On the 4-hour timeframe, Bitcoin is currently testing a key orange trendline, which has so far acted as a bullish continuation support. Every time the price has touched this trendline, it has bounced back up — making it critical to wait for confirmation before opening any short positions.
---
🔻 Short Setup:
⛔ Don’t short early. Wait for the trendline to be clearly broken
📍 Entry Trigger: Short below $103,822.8 after trendline breakdown
📌 This level acts as a technical trigger confirming bearish continuation
---
🟢 Long Setup Remains Valid:
📍 Entry Trigger: Break and close above $106,491
---
🧠 Why Patience Matters:
The orange trendline is a continuation trendline, and historically, BTC has bounced upward each time it's tested. Premature shorts may result in being caught in a reversal. Wait for a confirmed close below the trendline + $103,822.8 before entering.

BULLRUN OVER - BITCOINBitcoin back to mid 97K according to my analysis. Always do your own research. I do not know anything. But I compensate my low succes rate with runners. Hopefully this is one.

This head and shoulder structure may push price to 95kThis head and shoulder pattern may push price to 95k. At 95k we have weekly moving average bands and they will act as support. But as recent history suggest it will be a very choppy downward move.

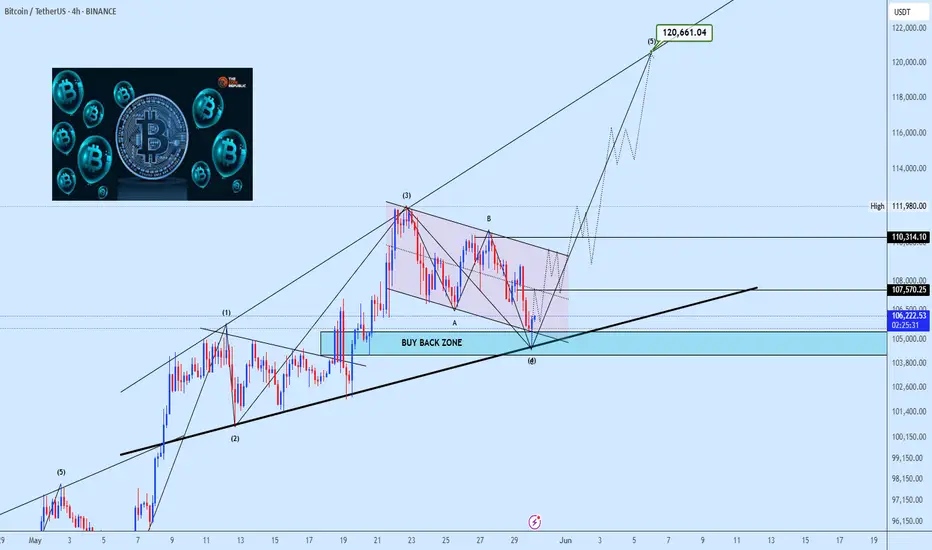
BTCUSDT Technical InsightThe Buy Back Zone is currently serving as a strong demand area and should be closely monitored for informed decision making. This zone has acted firmly as support, providing a solid base for the completion of the wave (4) correction, which concluded precisely at the lower boundary of the descending channel.
We now anticipate the development of a breakout structure within the descending channel (a corrective flag), suggesting the initiation of wave (5) with an upside projection toward $120,661.
A decisive breakout and successful retest above $107,570 will validate bullish momentum and pave the way for continuation towards $110,314, and eventually the $120K zone, aligning with the full extension of the broader impulse wave.
At this stage, patience is key. Allow price action to confirm strength above resistance before committing to aggressive positioning. The bullish market structure remains intact as long as the Buy Back Zone continues to hold.
Feel free to share your thoughts, are you tracking this wave count with us?
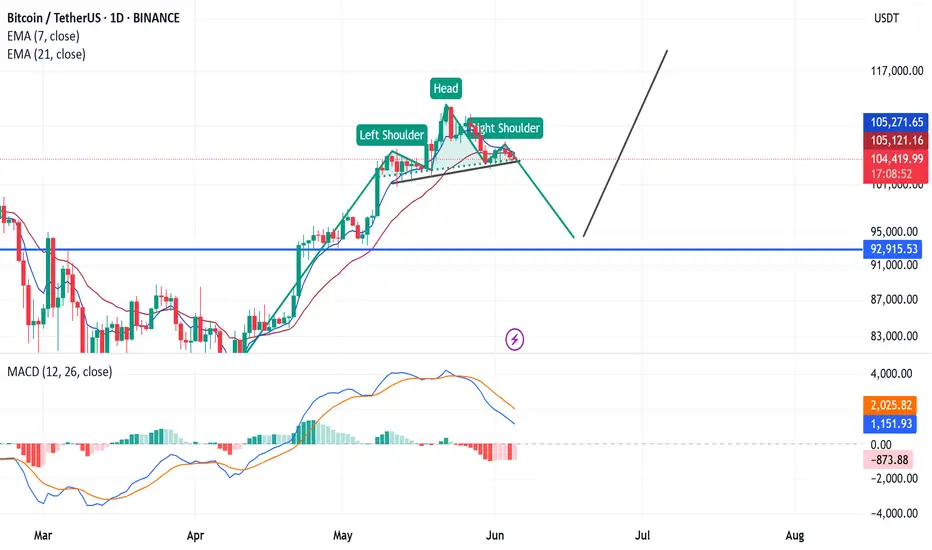
BTC Short🔍 Chart Pattern: Head and Shoulders
Left Shoulder: Formed with a moderate high and volume increase.
Head: Highest peak, clearly above the shoulders.
Right Shoulder: Lower than the head, approximately at the same level as the left shoulder.
Neckline: Slight upward sloping support line connecting the two troughs — currently being tested.
⛔ This is a classic bearish reversal pattern. If price breaks below the neckline, a strong downtrend could follow.
📉 Indicators:
EMA 7 & EMA 21:
Price is currently below both EMA7 and EMA21, indicating short-term and medium-term weakness.
EMA7 crossing below EMA21 = Bearish signal.
MACD:
MACD line is dropping significantly, showing momentum loss.
A bearish crossover (MACD line below signal line) may confirm further downside.
📌 Possible Scenarios:
Bearish Breakout: If price breaks the neckline, BTC could drop toward the major support zone around 92,915 USDT (blue horizontal line).
Bullish Rebound: If price bounces from the neckline, a recovery move may happen — watch for price to reclaim the EMAs and form a higher high.
📊 Summary:
Pattern: Head & Shoulders – signals a potential trend reversal.
Current trend: Bearish (price below EMAs, MACD weakening).
Key support zone: 92,915 USDT.
Strategy: Wait for confirmation of neckline break for potential short entry. Otherwise, a strong bounce could justify a buy trade with tight risk control.
P/s: By ChatGPT
BTC LONG $105800BTC Long Setup 🚀
Ideal entry at key support zone.
Tight SL to manage risk.
TP set for a strong risk/reward ratio (1:2).
Institutional volume and whale activity confirming the move.
Let’s ride this uptrend! 🔥

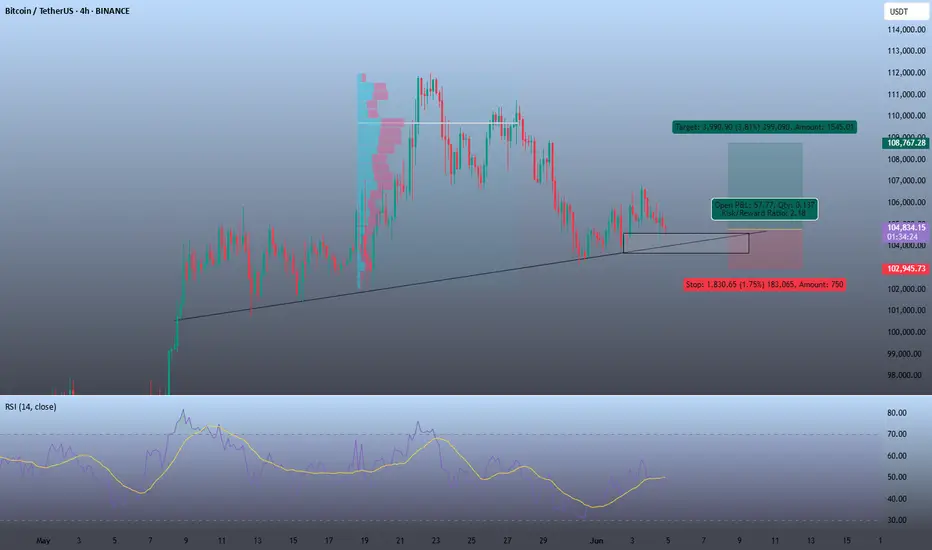
BUY OPPORTUNITYTrade Signal: BTC/USDT
Entry Price: $104,776
Stop Loss (SL): $102,945
Take Profit (TP): $108,767
Timeframe: 4H
Technical Indicators
RSI (Relative Strength Index) at 48, turning upward:
RSI near 50 is neutral, but a rising RSI from below 50 suggests increasing buying momentum. It indicates the bears are weakening and bulls are gaining strength.
The current price is stabilizing at a historically strong support zone, which has acted as a floor in previous price action. This increases the likelihood of a bounce.
Volume increasing:
A rise in trading volume often confirms the strength of price moves. Increasing volume near support suggests strong buyer interest.
Fundamental Outlook
Upcoming fundamental data (unemployment claims) is expected tomorrow.
Historically, positive employment data tends to increase market confidence and can provide bullish momentum for BTC as investors react to overall economic health.
The market appears positioned to react favorably if the data meets or exceeds expectations, potentially accelerating the move toward resistance.
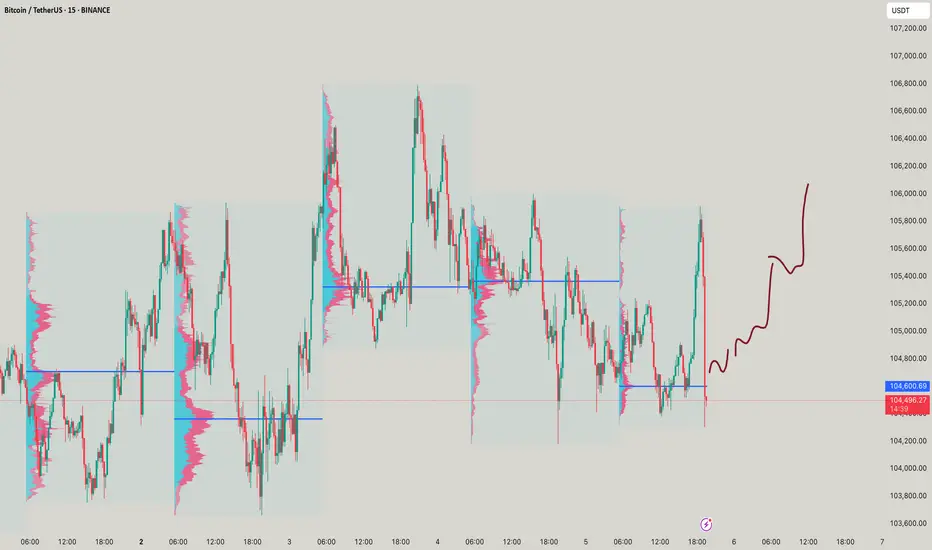
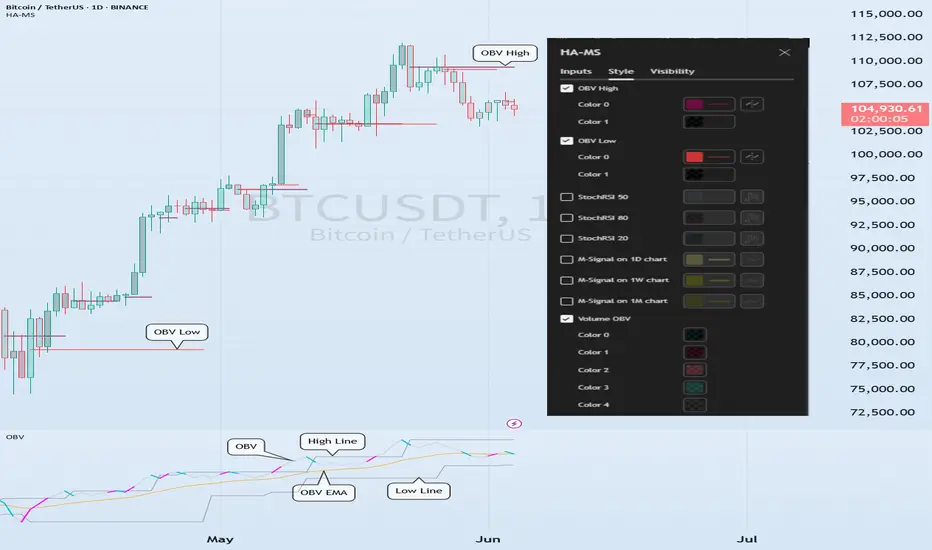
An example of a new way to interpret the OBV indicator
Hello, traders.
If you "follow", you can always get new information quickly.
Have a nice day today.
-------------------------------------
I think the reason why there are difficulties in using auxiliary indicators and why they say not to use indicators is because they do not properly reflect the price flow.
Therefore, I think many people use indicators added to the price part because they reflect the price flow.
However, I think auxiliary indicators are not used that much.
Among them, indicators related to trading volume are ambiguous to use and interpret.
To compensate for this, the OBV indicator has been modified and added.
-
The ambiguous part in interpreting the OBV indicator is that the price flow is not reflected.
Therefore, even if it performs its role well as an auxiliary indicator, it can be difficult to interpret.
To compensate for this, the High Line and Low Line of the OBV auxiliary indicator have been made to be displayed in the price section.
That is, High Line = OBV High, Low Line = OBV Low
-
Then, let's interpret the OBV at the current price position.
The OBV of the auxiliary indicator is currently located near the OBV EMA.
That is, the current OBV is located within the Low Line ~ High Line section.
However, if you look at the OBV High and OBV Low indicators displayed in the price section, you can see that it has fallen below the OBV Low indicator.
In other words, you can see that the price has fallen below the Low Line of the OBV indicator.
You can see that the OBV position of the auxiliary indicator and the OBV position displayed in the price section are different.
Therefore, in order to normally interpret the OBV of the auxiliary indicator, the price must have risen above the OBV Low indicator in the price section.
If not, you should consider that the interpretation of the OBV of the auxiliary indicator may be incorrect information.
In other words, if it fails to rise above the OBV Low indicator, you should interpret it as a high possibility of eventually falling and think about a countermeasure for that.
Since time frame charts below the 1D chart show too fast volatility, it is recommended to use it on a 1D chart or larger if possible.
-
It is not good to analyze a chart with just one indicator.
Therefore, you should comprehensively evaluate by adding different indicators or indicators that you understand.
The indicators that I use are mainly StochRSI indicator, OBV indicator, and MACD indicator.
I use these indicators to create and use M-Signal indicator, StochRSI(20, 50, 80) indicator, and OBV(High, Low) indicator.
DOM(60, -60) indicator is an indicator that comprehensively evaluates DMI, OBV, and Momentum indicators to display high and low points.
And, there are HA-Low, HA-High indicators, which are my basic trading strategy indicators that I created for trading on Heikin-Ashi charts.
Among these indicators, the most important indicators are HA-Low, HA-High indicators.
The remaining indicators are auxiliary indicators that are necessary when creating trading strategies or detailed response strategies from HA-Low, HA-High indicators.
-
Thank you for reading to the end.
I hope you have a successful trade.
--------------------------------------------------
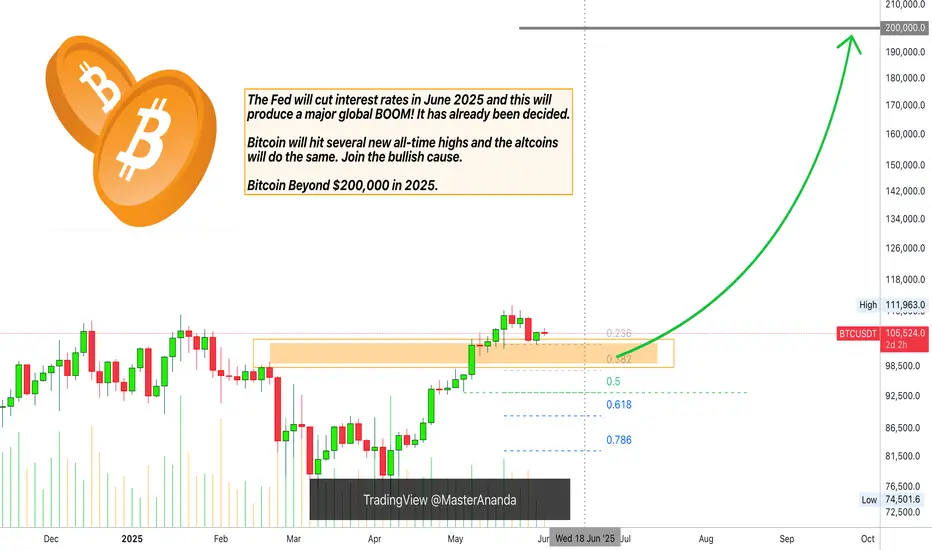
Bitcoin & The FED June 2025 (Beyond $200,000 New All-Time High)Before a major bullish event, the market tends to go sideways or into a retrace. Since the event is bullish, prices grow. Preceding the event the market gives out everything that isn't what will happen after the event, like a detox.
Now, Bitcoin is a very strange monster, kind of like a virus but in the good sense of the word. It changes, mutates, evolves, upgrades outdated decaying systems. So it isn't likely to crash just because the market is about to turn ultra-bullish. It is the other way around, since everybody already knows, nobody is willing to sell. In reality, everybody is buying like there is no tomorrow.
So Bitcoin can go sideways or into retrace until the Fed announces that it is cutting whatever interest, you know these things. So when they do their thing, the market will be ultra-bullish and that's when Bitcoin will produce its bullish continuation. Right now there is a period of consolidation which is being used by the whales as accumulation.
Remember when I was saying you will look like a genius for buying below 80K?
It is the same situation all over again. When Bitcoin is trading at $150,000 or $200,000, you will look like a genius for buying below $110,000. That's the way it is.
So, slightly bearish before the event. There can be a market flush but these are going to be limited because Bitcoins can be lost forever. It is a fight between whales. So if some whales decide to manipulate the market trying to cause some panic, other whales will be happy to buy everything at the lows and prices recover.
This means that Bitcoin will be consolidating until the announcement, after the announcement; "We will cut rates certain numbers of points..." Then all heaven will break loose. It will be money-up good news.
Do what you do, just be good, know that Bitcoin and Crypto will grow there is no way to stop this wave we are all going up. Those that were hating are going to be hated by their own selves because nobody will know who they are. We are going to be party-rocking like a rockstar because not only Bitcoin but we are going on a global bull market. You can bet on it. And if you do, you will be glad you did and you will be extremely happy with the result.
There is no way to stop Bitcoin.
There is no way to stop this wave.
The entire Cryptocurrency market will do awesome in late 2025. Are you prepared?
Thank you for reading.
Namaste.
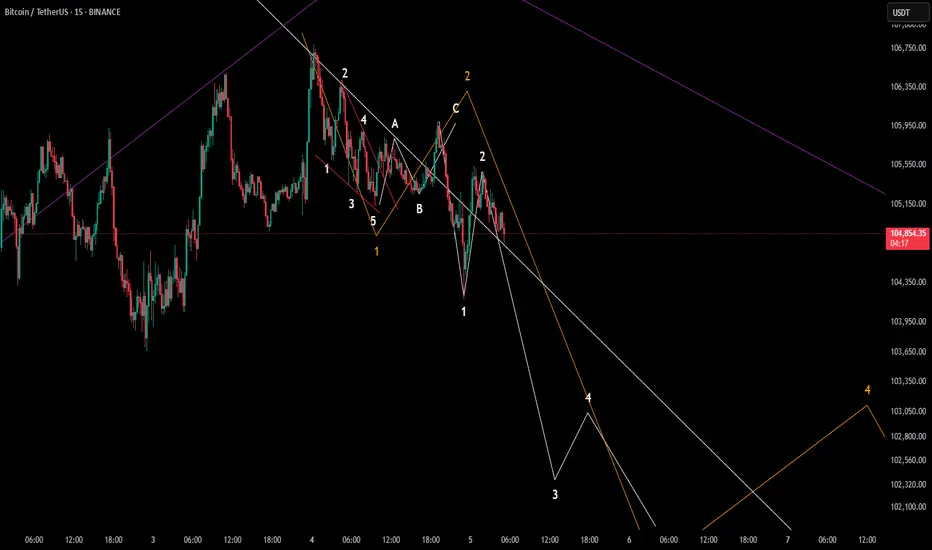
BTC PredictionWXY
It's unfolding exactly as I mentioned before.
Wave X has been completed,
and now the downward Y wave has begun.
First, a 5-wave decline will take place as the initial move.
It's short time!