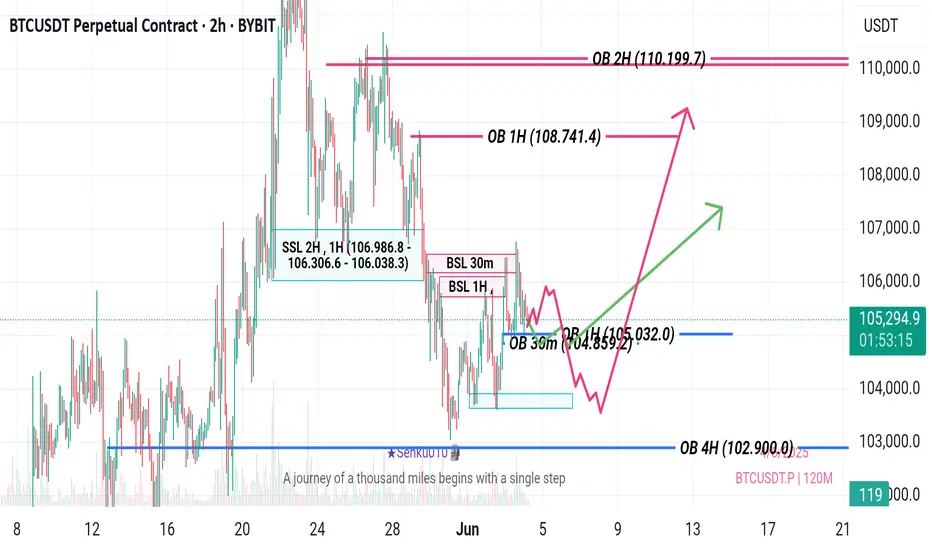
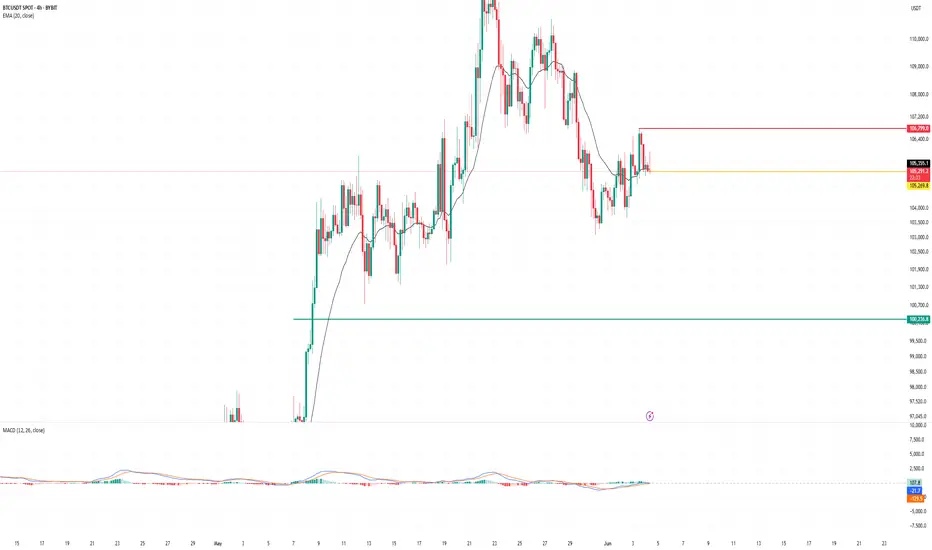
BTC-----Sell around 105200, target 104500 areaTechnical analysis of BTC contract on June 4:
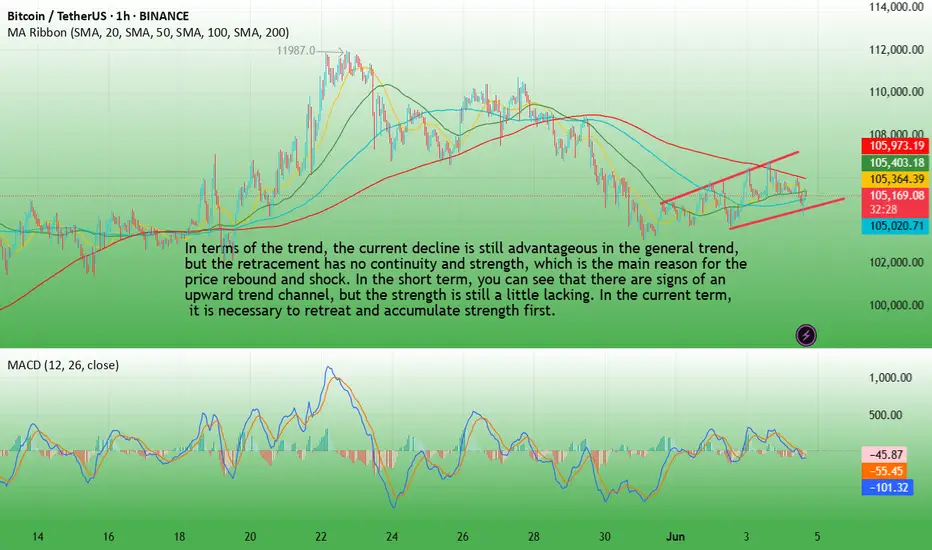
Today, the large-cycle daily level closed with a small negative line yesterday, the K-line pattern was a single negative with continuous positive, the price was consolidating at a high level, and the attached indicator was dead cross running. The general trend of falling is still advantageous, and attention should be paid to the strength and continuation of the falling trend; the short-cycle hourly chart retreated under pressure yesterday morning, and the US market supported the rebound and broke the high point of the previous day, but the time was wrong, so the continuation was not seen in the early morning. It was under pressure again in the morning. The current price is at a low level, and the attached indicator is dead cross running. The four-hour chart is obviously suppressed, so there is probably still a need to continue the decline during the day.
BTC short-term contract trading strategy:
Sell at the current price of 105200, stop loss at 106000, and target the 104500 area;
BTCUSDT.3S trade ideas
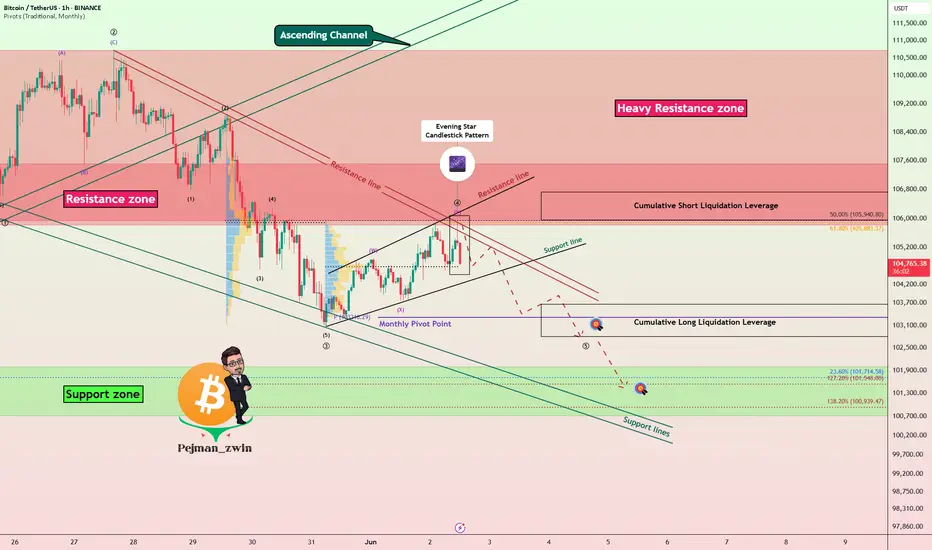
Bitcoin’s Rally Fades Below Resistances — Bearish Wave Setup!Bitcoin ( BINANCE:BTCUSDT ) started to fall as I expected in the previous idea , but failed to break the Heavy Resistance zone($110,000-$105,820) .
Bitcoin is trading near the Resistance zone($107,520-$105,940) , Cumulative Short Liquidation Leverage($106,720-$105,948) , and the Resistance lines .
From the perspective of Elliott Wave theory , Bitcoin appears to have completed a main wave 4 near the Resistance lines. The structure of the main wave 4 was a Double Three Correction(WXY) . One of the signs of the completion of the main wave 4 could be the Evening Star Candlestick Pattern .
I expect Bitcoin to decline to at least Cumulative Long Liquidation Leverage($103,666-$102,800) AFTER breaking the Support line , and the next target is the Support zone($102,000-$107,120) .
Note: Rising tensions between Russia and Ukraine could help drive down Bitcoin.
Note: If Bitcoin touches $107,600, we can expect more pumps.
Please respect each other's ideas and express them politely if you agree or disagree.
Bitcoin Analyze (BTCUSDT), 1-hour time frame.
Be sure to follow the updated ideas.
Do not forget to put a Stop loss for your positions (For every position you want to open).
Please follow your strategy and updates; this is just my Idea, and I will gladly see your ideas in this post.
Please do not forget the ✅' like '✅ button 🙏😊 & Share it with your friends; thanks, and Trade safe.
Will $BTC drop back to 91k??BINANCE:BTCUSDT seems to be running out of steam after its bullish rally last month. A decent retracement is needed to enable gain some momentum for further bullish move.
Having broken out of the bullish trendline and also a minor support zone, BINANCE:BTCUSDT has retested this zone, hence making it a resistance zone. It is expected to drop to 99k zone as the first target and if it does not hold, then a drop to 91k zone should be expected.
Kindly support this analysis to enable it reach to other people, and do comment your thoughts.

What is order block, workWhat strategi is corect?
Interesting idea.
What is order block?
How stock market is work?
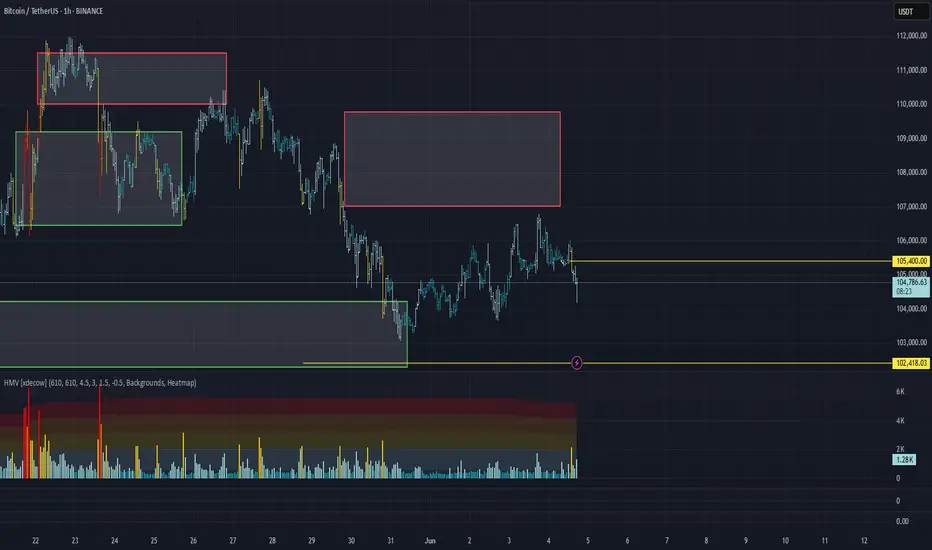
BTC/USDT Analysis: Rotation Continues
Hello everyone! This is the daily analysis from a trader-analyst at CryptoRobotics.
Yesterday, Bitcoin continued rotating within the newly formed range, showing a slight upward bias.
Today, however, the direction has shifted, and the price has started moving toward the lower boundary of the range. At the moment, price anomalies have appeared around the $105,400 level. If we see a reaction during a test of this level, an intraday short could be considered.
Selling zones:
$105,400 (local absorption of sell pressure),
$107,000–$109,800 (accumulated volumes)
Buying zones:
~$100,000 (initiating volumes),
$98,000–$97,200 (local support),
$93,000 level,
$91,500–$90,000 (strong buying imbalance)
This publication is not financial advice.
Possible Bear MoveCurrently monitoring its bearish trend and identifying additional potential zones for shorting opportunities.
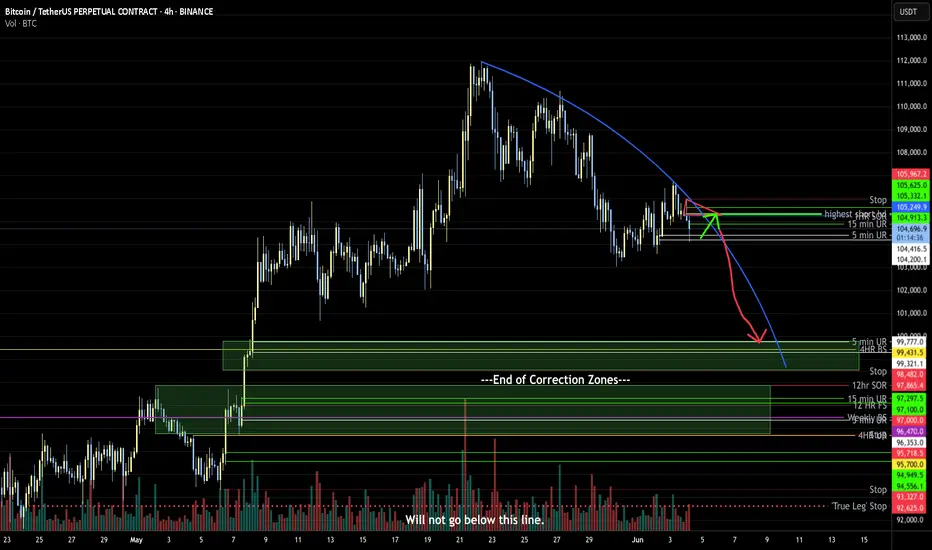
Bitcoin Overall: One More leg down -> Correction finishedIt's likely that BTC will find a short off of the indicated range and move lower to one of the indicated ranges, at which point the correction will have ended and another move to new ATH can begin.
BTC update - June 04 2025Following the previous analysis on BTC, we saw Bitcoin as it crossed below the blue trendline and dumped towards lower levels.
BTC has spent the past couple of days retesting the broken level of 106,700 and now it seems the retest is complete and BTC is ready to continue its move towards lower levels.
Once again it is advised to look for Short setups across the market.

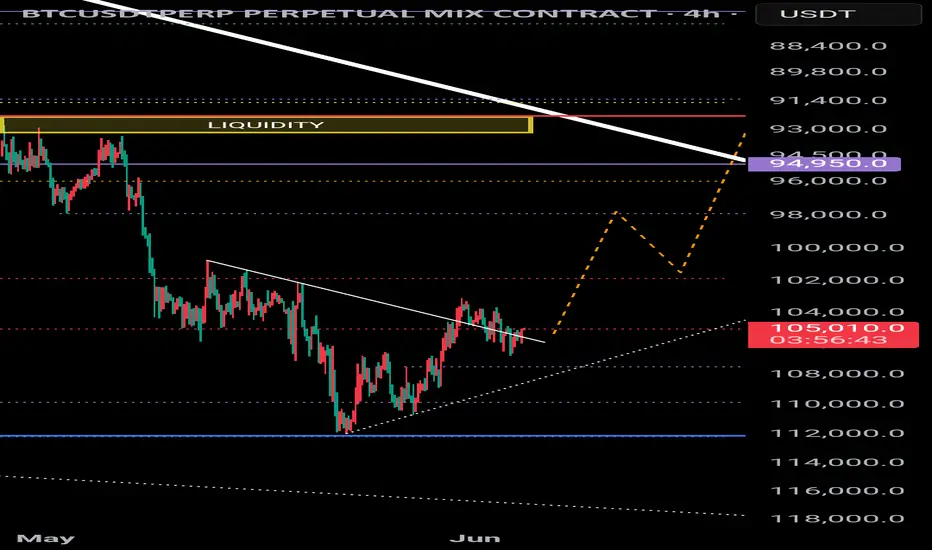
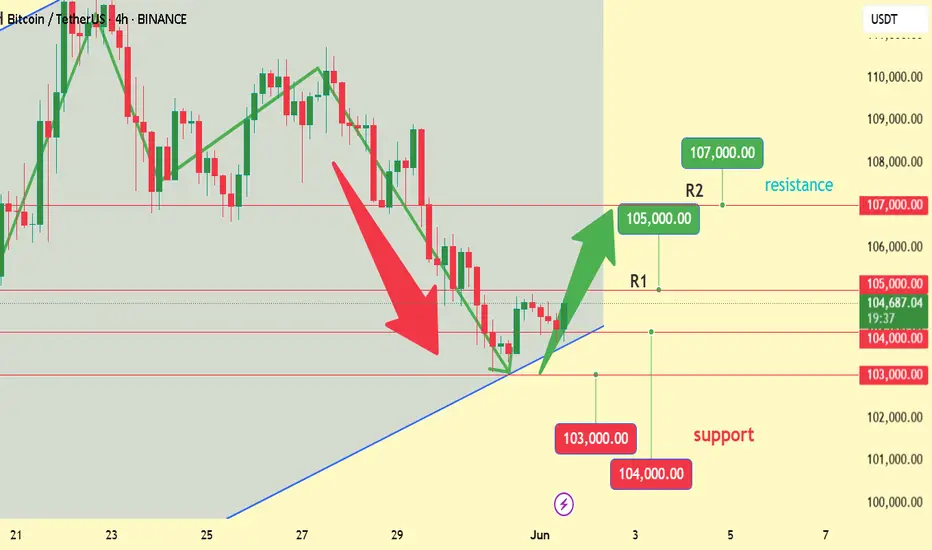
A pullback to launch the price upward The Bitcoin market structure is bullish on the daily timeframe, but the price action needs to pull back to the basic structure levels. Nothing new—just repeating the same pattern, as I mentioned in the chart.

A Pull back to launch the price upward The Bitcoin market structure is bullish on the daily timeframe, but the price action needs to pull back to the basic structure levels. Nothing new—just repeating the same pattern, as I mentioned in the chart.

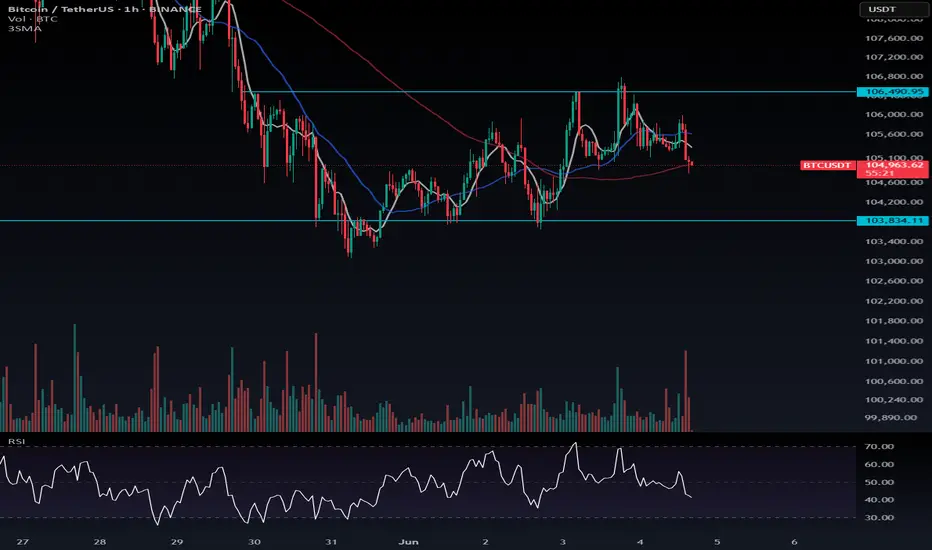
Bitcoin 1H Update: Sell Pressure vs Buyer Momentum 📈 Bitcoin 1H Update: Sell Pressure vs Buyer Momentum — Key Long/Short Triggers + Altcoin Watchlist
In the 1-hour timeframe, Bitcoin (BTC) is currently experiencing strong sell pressure. However, if sellers fail to push the price lower, bulls may regain control, opening the door for an upward move.
---
🟢 Long Setup:
Trigger: Break and candle close above $106,491
Early Entry Option: If price shows strong bullish momentum with rising volume, early longs can be considered even before $106,491
RSI Confirmation: If RSI closes above 59 on the 4H chart, it further validates bullish bias
---
🔻 Short Setup:
Trigger: Break below $103,834
---
📊 Momentum Clues:
Watch volume increase on upward moves as a momentum confirmation
If volume rises during push-ups and RSI aligns, that’s a strong buy signal
---
💡 Altcoin Watchlist for Longs:
If you're considering altcoin longs instead of BTC:
✅ CRYPTOCAP:ETH — Showing structural strength
✅ CRYPTOCAP:CAKE — Worth watching for breakout setups
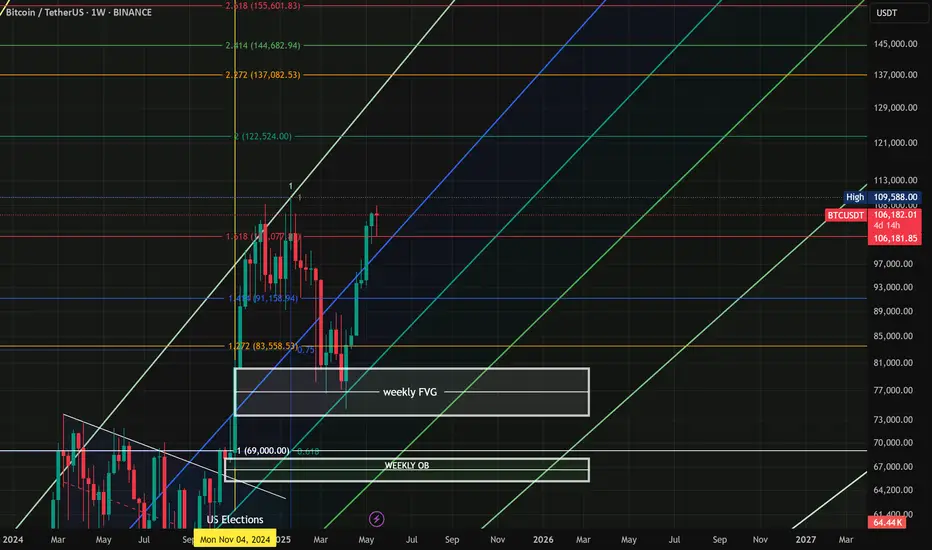
another move downwards?bitcoin is showing signs of trend exhaustion.
volume is going down and I believe there's going to be a major dump either from these levels or at the most 125k . I'm actively looking for selling opportunities from now on
the last target for this move is probably the 70 to 64k order block
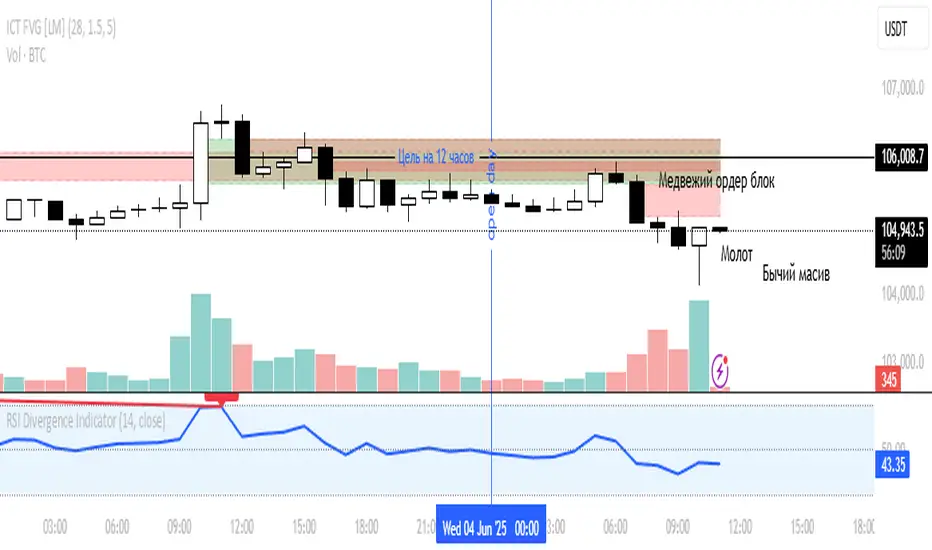
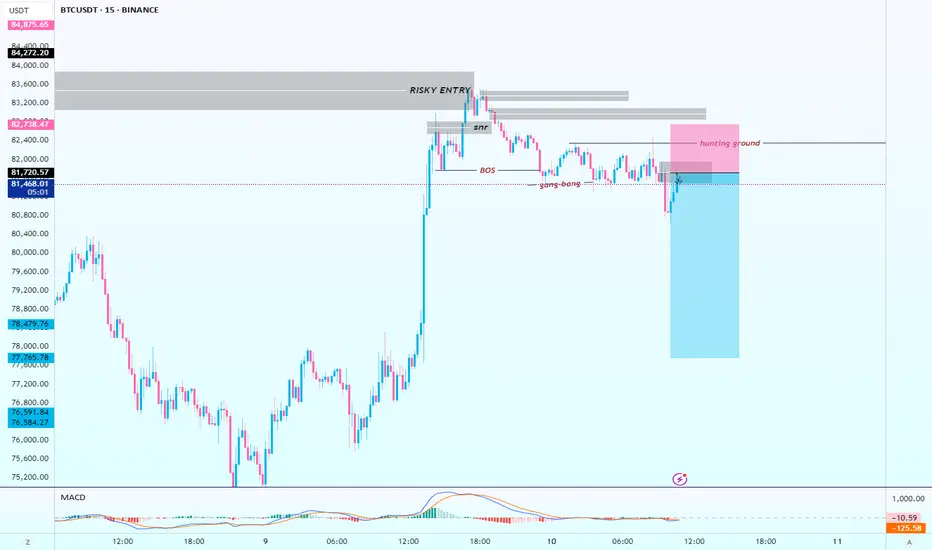
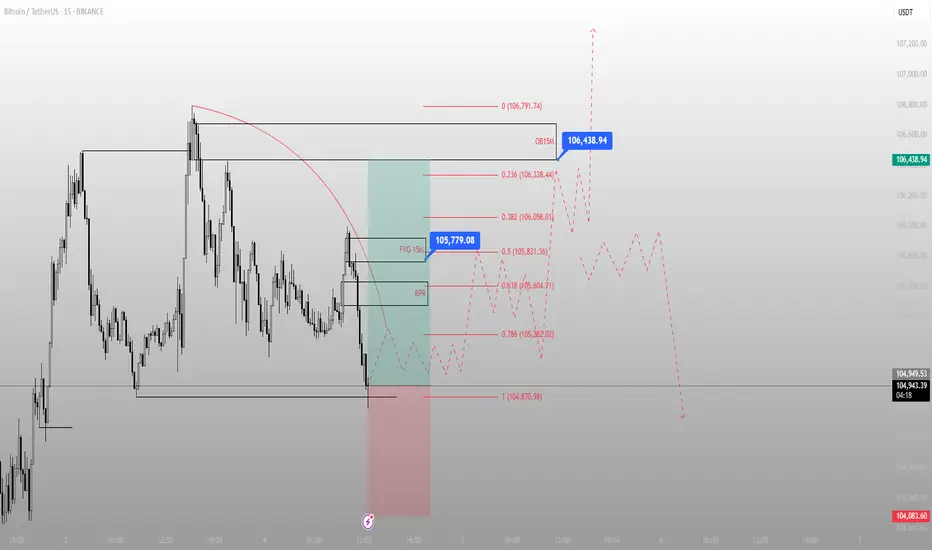
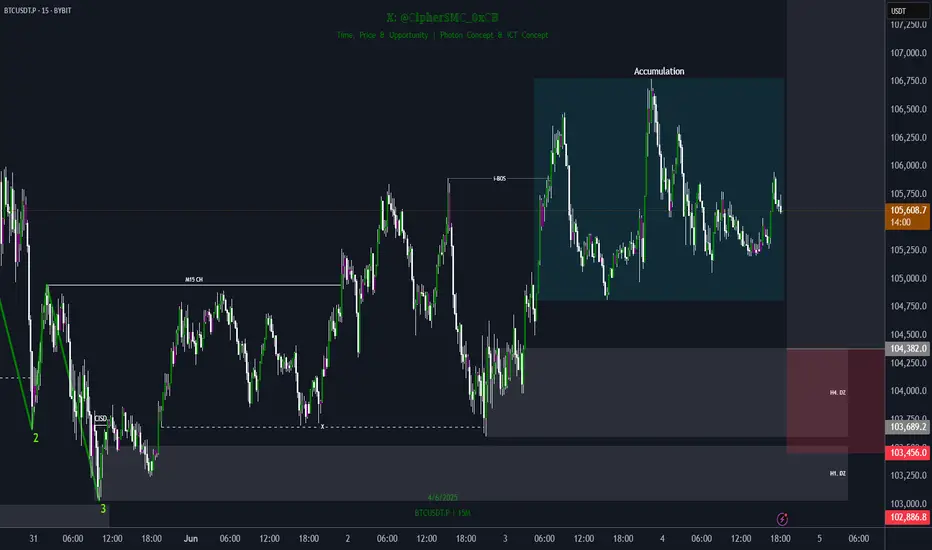
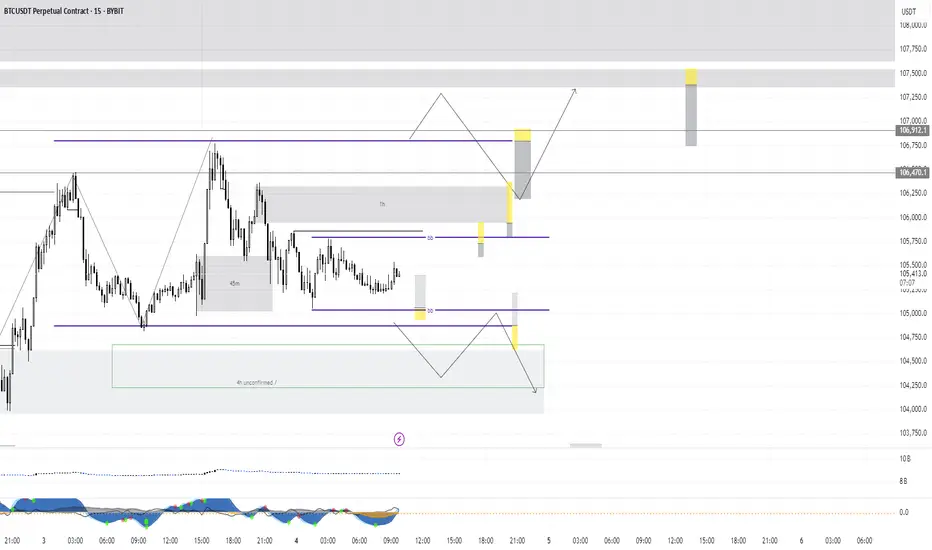
Price tapped the low — but didn’t break structure. That’s all I BTC delivered a clean sweep into the 15M low, filled the imbalance, and now it’s reclaiming. If you’re still wondering whether it’s valid — you’re not reading structure. You’re chasing candles.
Here’s the setup:
Price swept a key low at 104,870.98, tapping into a precision FVG
That move also kissed the edge of a lower BPR — institutional order flow at work
Now we’re rotating back toward the 15M OB near 106,438.94, with the first real reaction zone at 105,779.08
Above that, fib confluence and the OB offer a decision point: either distribute from 106.4 or break higher into premium inefficiency zones.
If price stalls at 0.5 (105,831) and rejects hard, I’ll expect a revisit to the low. If we blow through with displacement — we’re heading higher.
Execution bias:
Longs are valid as long as price holds above 104,870
TP1: 105,779
TP2: 106,438
Failure to reclaim FVG = scenario invalid, stand down
This isn’t a “setup.” It’s a replay of logic. The market does this every day — if you know how to listen.
More trades like this? No noise, just precision — check the profile description.
BTC - targeting 98k4H TF
*chart inverted
Observing a trendline break - next leg down would be 98k (-6% retracement)
TradeCityPro | Bitcoin Daily Analysis #107👋 Welcome to TradeCity Pro!
Let’s dive into Bitcoin and key crypto indices. As usual, in this analysis I’ll walk you through the triggers for the New York futures session.
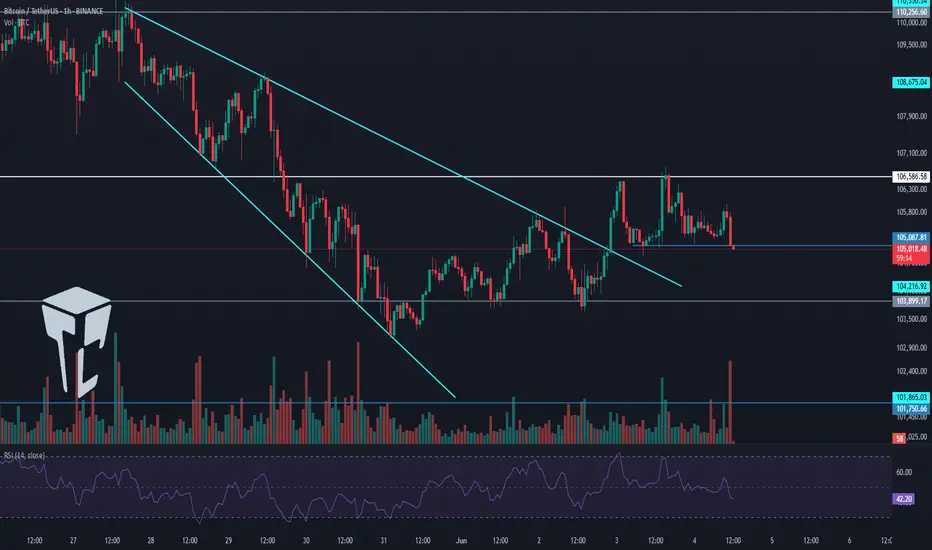
⏳ 1-Hour Timeframe
As you can see in the 1-hour timeframe, yesterday the price made another upward move and formed its resistance at the 106586 level and a bottom at 105087.
📈 For a long position, considering the uptrend in higher timeframes such as the daily and weekly, we can enter upon a breakout of 106586. A bounce of the RSI from the 50 level can act as a good confirmation for the position.
📊 Buying volume is currently increasing, but the price is still sitting on the support bottom and hasn’t moved upward yet. If this volume inflow continues, a breakout of 106586 would be a strong confirmation for a long position.
🔽 For a short position, the first trigger is the breakdown of the 105087 bottom. If this level is broken, we can enter a short. The main short trigger is at 103899.
💥 Conditions are currently favorable for a short position, and the current candle has strong bearish momentum. So, if 105087 breaks, a short position would be appropriate.
👑 BTC.D Analysis
Let’s look at Bitcoin Dominance. After a pullback to the 64.23 level, the next bearish leg continued to 63.93. If 63.93 breaks, the downtrend is likely to continue and the price could fall to 63.50.
✅ If 63.93 holds, dominance may start moving back up toward 64.67.
📅 Total2 Analysis
Now let’s check out Total2. This index is still below the 1.18 level, and breaking this level would confirm a bullish move.
✨ A new bottom has also formed at 1.17. If this level breaks, we can look for a short position.
📅 USDT.D Analysis
Now to Tether Dominance. This index has formed a box between 4.64 and 4.70.
🔔 A breakout above 4.70 could initiate a bullish move in dominance, while a breakdown below 4.64 could trigger a bearish move.
❌ Disclaimer ❌
Trading futures is highly risky and dangerous. If you're not an expert, these triggers may not be suitable for you. You should first learn risk and capital management. You can also use the educational content from this channel.
Finally, these triggers reflect my personal opinions on price action, and the market may move completely against this analysis. So, do your own research before opening any position.
BTC Long Trade Setup Idea #2BTC has been in accumulation mode since yesterday. If you missed the first long setup, here’s the second trade setup opportunity.
Trade Setup Idea:
- Entry Range: 103,850.6 - 104,382.0
- Stop Loss (SL): 103,456.0
- Target Levels: 111,9K, 116K, 121K, 127K, 131K, 140K
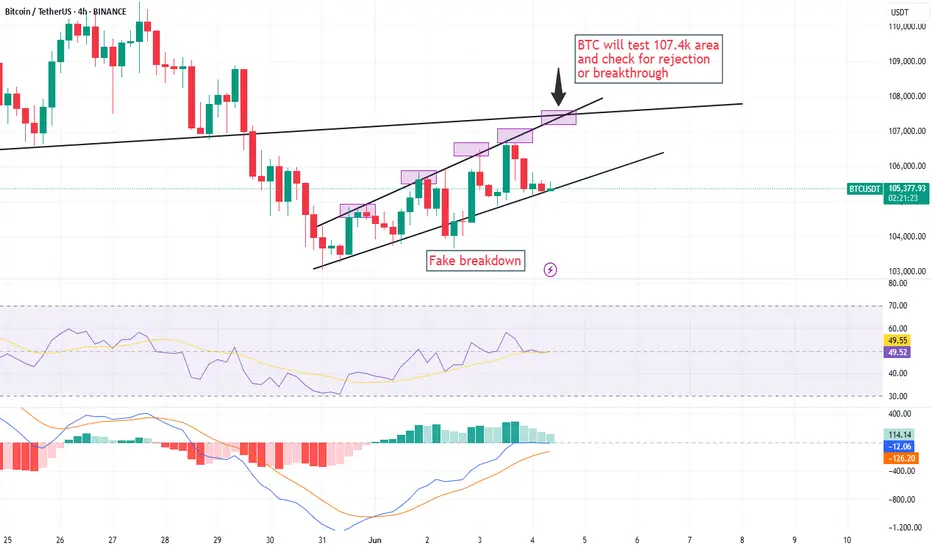
BTC at CROSS ROADS### 📌 **BTC/USDT – Crucial 4H Price Action Ahead!** 📌
BTC is currently navigating within an *ascending channel* pattern on the **4-hour timeframe**. Recently, we experienced a brief *fake breakdown*, quickly reversed by bullish momentum. BTC is now approaching the critical resistance level near **\$107.4k**.
### 🚩 **Key Levels:**
* **Resistance:** \$107.4k (critical test)
* **Immediate Support:** \$105k
### 📊 **Technical Indicators:**
* **RSI:** *Neutral (\~50)* – Direction undecided, waiting for a clear move.
* **MACD:** *Momentum weakening* – Indicates traders should remain cautious.
### 🔮 **Potential Scenarios:**
* **✅ Bullish:** A breakout above **\$107.4k** would likely open the gates to higher targets around **\$109k–\$110k**.
* **❌ Bearish:** A rejection at **\$107.4k** could trigger a move back toward support near **\$105k**, with potential further downside.
### 📢 **Summary & Trading Tips:**
Watch closely for BTC’s reaction around **\$107.4k**. Confirm breakouts with additional signals from RSI and MACD to mitigate risk. **Trade carefully!**
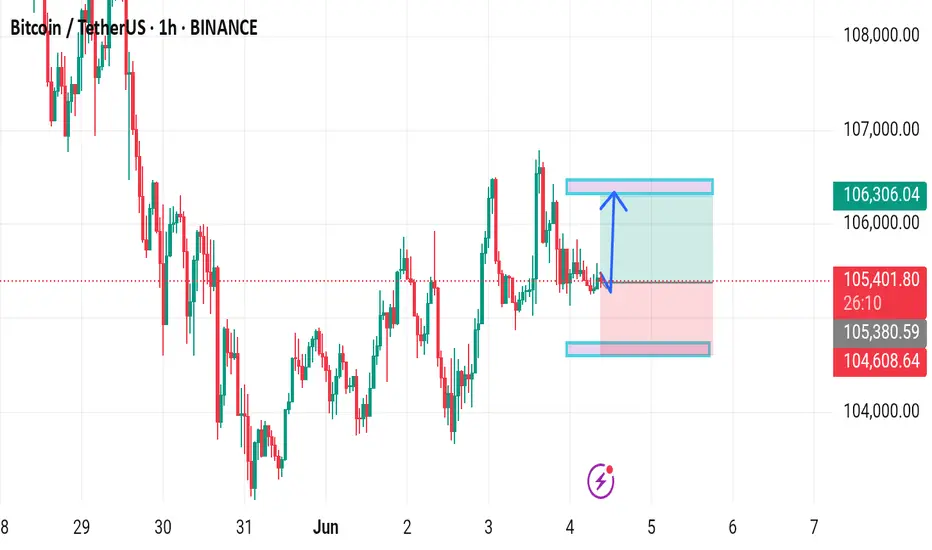
BTCUSD Entre point 105300 target 106300 stop loss 104500Let's break it down:
- Entry Point: 105,300
- Target: 106,300 (1,000-point gain)
- Stop Loss: 104,500 (800-point risk)
You're expecting BTCUSD to rise from 105,300 to 106,300. Risk-reward ratio looks decent!
Potential reward: 1,000 points
Potential risk: 800 points
Let's see how it plays out! What's driving this bullish trend?
BTC Bitcoin Warning: No Clear Setup — Don’t Get Trapped!🚨 BTC Market Outlook: Analysis & Key Warning for Traders 🧠💡
Currently keeping a close eye on Bitcoin (BTC) 🔍. Previously, we saw strong bullish momentum propelling price upward 📈. However, that momentum is now under pressure — especially when you zoom into the 4-hour timeframe. We've seen a clear break in market structure, with lower highs and lower lows forming 🔻.
Right now, there’s no clean trade setup on the table. Price has pulled back, and we’re at a key inflection point — either we see a bullish breakout, or further downside could unfold 📉.
This video is more of a technical warning ⚠️ for traders feeling the urge to jump in early. The current structure is risky, and taking impulsive trades here could do more harm than good.
In the video, I also cover how to identify the highest-probability setups — particularly when price consolidates in a range and then breaks out in the direction of the prevailing trend. These continuation setups offer far better odds than guessing mid-range.
📌 Be patient. Let the setup come to you. Don’t force trades when conditions are unclear.
💬 If you’ve watched the analysis or have thoughts on BTC’s next move, comment below — I’d love to hear your view.
❗️Disclaimer: This is not financial advice. Everything shared is for educational purposes only. Always do your own analysis and trade responsibly. Risk management is key.

Trade of the dayQuick update — there won’t be a live class today or tomorrow. Our next session will be this Friday, so mark your calendars.
In the meantime, we’re already up 14x on the week — an incredible run. That said, now is the time to double down on discipline, not risk. 🚫💥
For every trade idea you consider, wait for confirmation before entering. Let the setup come to you — no forcing trades. Great trading is about patience, precision, and process.
As always:
✅ Use proper risk management
✅ De-risk your positions as early as possible
✅ Stay focused on learning and refining your edge
Every trade is a lesson. Whether you win or lose, review your decisions and grow from them. The market rewards the consistent and the calculated.
Catch you all Friday.
Today's BTC trading strategy, I hope it will be helpful to youBitcoin has seen a particularly strong rally recently, even breaking through the $110,000 mark, but has pulled back slightly in recent days. Given the current situation, the correction after the previous rapid rise is normal. However, from a long-term perspective, there are still many bullish factors. For example, with economic instability in many parts of the world, countries have been printing large amounts of money to stimulate their economies. As the supply of money grows, assets with a fixed quantity like Bitcoin become more valuable, leading to increased buying demand and upward price momentum. Additionally, more and more powerful institutional investors are taking an interest in Bitcoin. Financial giants like BlackRock are investing large sums of capital, and the influx of substantial funds can also drive Bitcoin's price higher.
From a technical perspective, although the price has declined slightly in recent days, it remains above the 20-day moving average (approximately $102,500) on the daily chart, indicating that the medium-term upward trend has not been disrupted. Another indicator, the RSI, is currently around 50—a neutral level—with an upward movement signaling renewed bullish momentum. Furthermore, the Bollinger Bands have begun to narrow, with the upper band at $106,000 and the lower band at $102,000. The price fluctuating within this range suggests that a significant breakout may be imminent.
Today's BTC trading strategy, I hope it will be helpful to you
BTCUSDT BUY@103000~104000
SL:101000
TP:105000~107000
BTC Bias consistently points to a dominant and well-established bullish market structure.
strong bullish bias. While short-term reactions might occur after significant liquidity sweeps, the underlying institutional order flow supports further upward momentum