BTCThe range marked by the formation of a confirmation candle is suitable for entering a short trade.
BTCUSDT.3S trade ideas

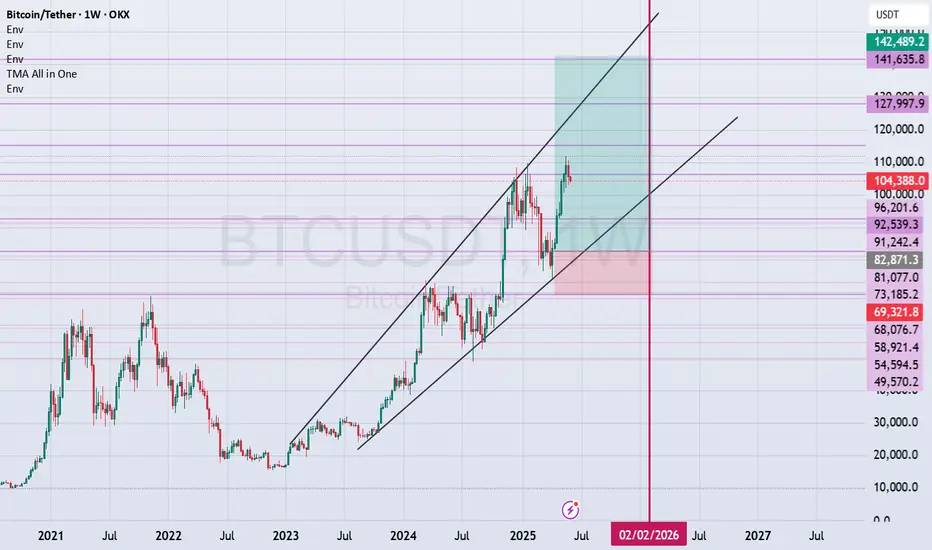
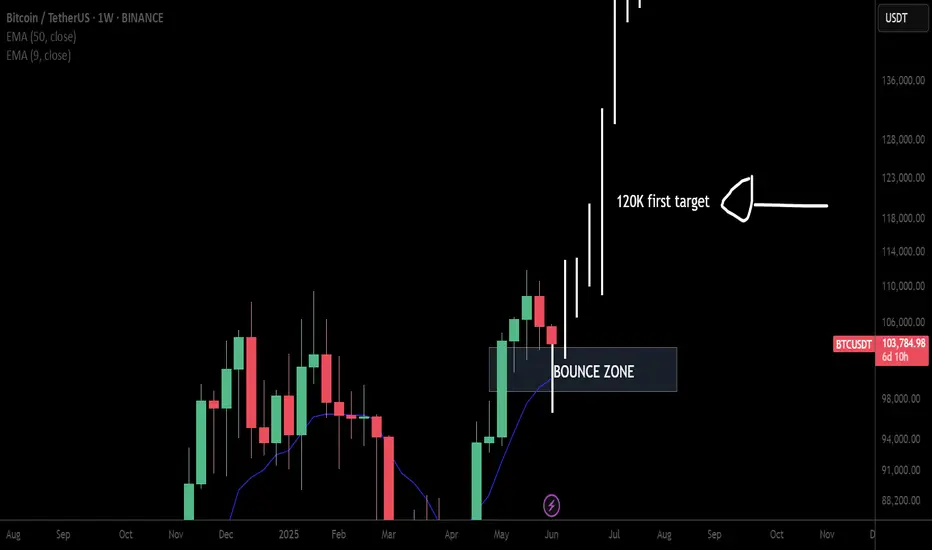
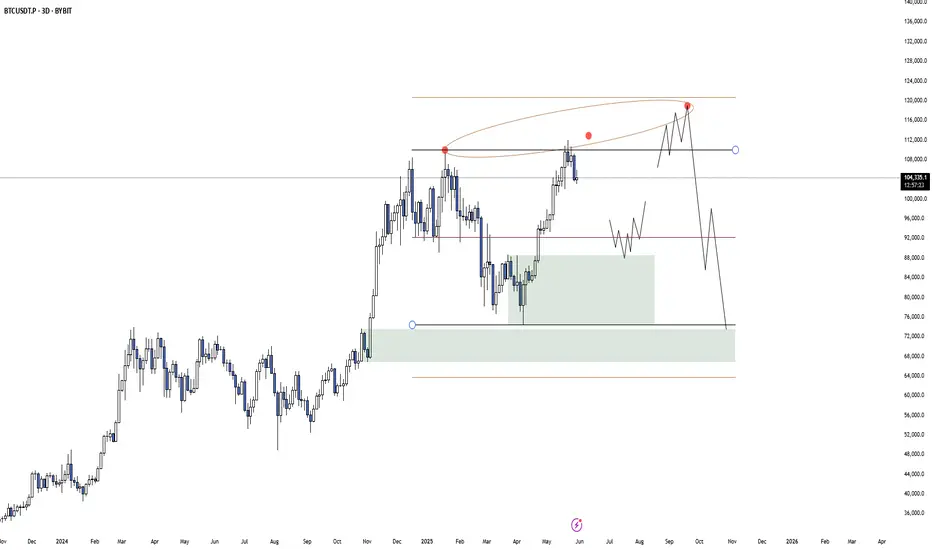
LONG BTCUSDT WEEKLY This is an overview of Bitcoin's movement for the beginning of next year on the weekly timeframe..."
BTC 4H Setup – OB Rejection or Launchpad? Bitcoin is currently ranging below a 4H Order Block (OB) and forming a potential higher low. With price holding above the key 0.618 fib zone (104.1k), this could act as a springboard for continuation — or a trap.
Key Levels:
Support: 104.1k–103.6k (fib cluster & mid-volume node)
Immediate Resistance: 105.1k (OB 4H)
Breakout Target: 107.1k
Fail-safe: 103.0k
Scenarios:
🟩 Bullish Path:
Hold 104k zone
Reclaim 105.1k OB = confirmation
Push toward 107.1k & higher liquidity sweep
🟥 Bearish Path:
Rejection from OB + break below 104k
Eyes on 103.0k as next bounce zone
Plan:
Long scalp above 104.2k if volume sustains
TP1: 105.1k (retest OB)
TP2: 107.1k
SL: Below 103.6k (tight invalidation)
📌 “OB rejection or flip? Market’s next impulse hinges on this 104k–105k squeeze.”

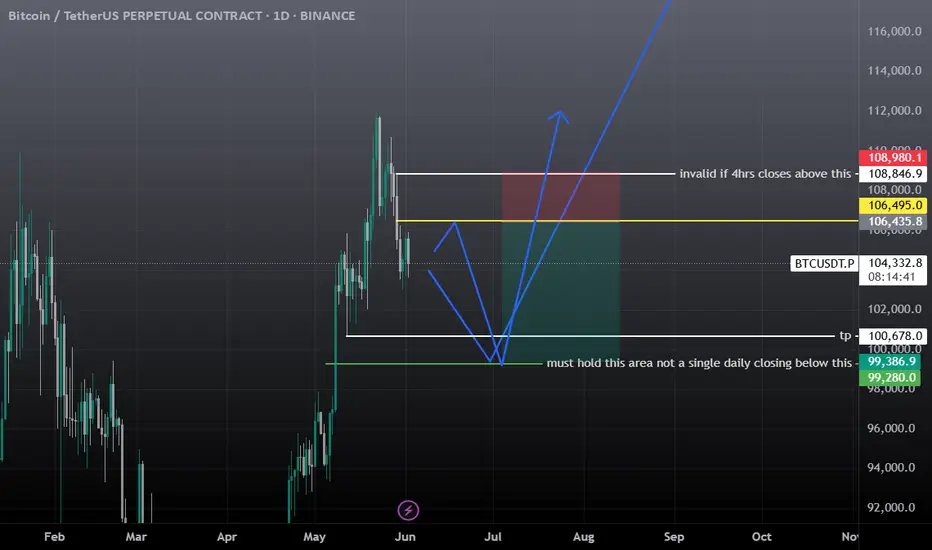
BTC Analysisfor here no trade zone, short from mentioned zone and keep the sl tight, I would prefer long from the 100k zone, if we get daily closing below the mentioned zone then will long from 92-90k area, target still remains the same 112k-120k
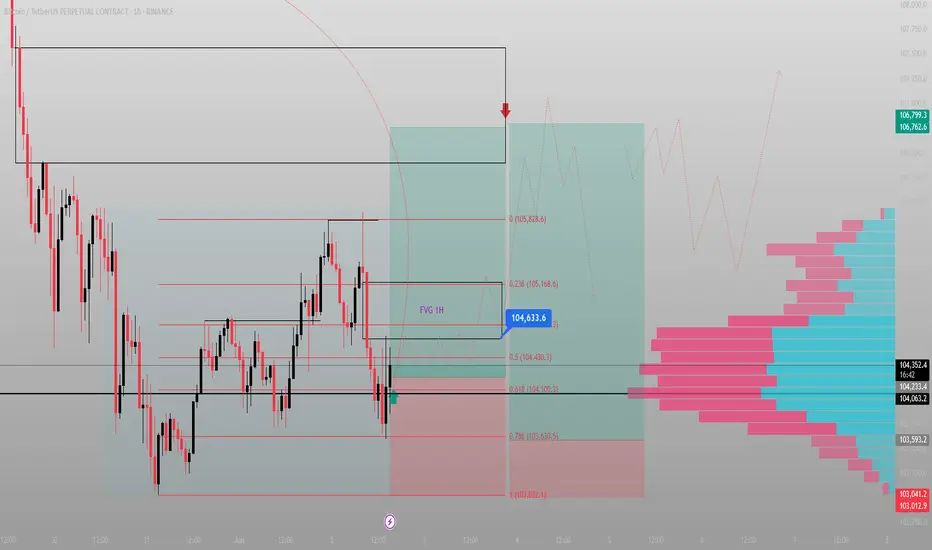
FVG re-entry or fail – this level decides the tone.Bitcoin tapped the 0.618 fib at ~$104,100 and front-ran the 1H demand zone. Now it's hovering at a decision point just beneath the 1H Fair Value Gap.
What to watch:
→ Price is pressing into FVG (104.4k–104.7k), aiming for acceptance.
→ Value area high sits at 104,275 – acting as pivot.
→ Break + hold above 104.7k? Clean path to 105.8k.
Plan:
Entry: 104.1k–104.3k
SL: below 103.6k
TP1: 104.9k
TP2: 105.8k (liquidity sweep)
Invalidation: Rejection from 104.7k = probable retest of 103k
Narrative flip potential:
Buyers are defending the mid-range + FVG. Breakout would shift market structure bullish on the lower timeframes.
"Acceptance above the gap = momentum reclaim."
$BTC not finished yetHey!
I'm still me, just a quick rebranding honoring my father.
CRYPTOCAP:BTC cycle is far from over. Not saying we bottomed yet. I think prices bewteen 96 - 102k could be reached on the upcoming days.
Althought this bearish momentum, we should encounter a goooood support level which would lead us to a great short absortion. If price holds those levels this week (maybe next too) there is a high chance we will see a new leg above the ATH level.
Im long here. Stay tuned
BTCUSDT 50k Here in the market, only take a sell trade. The weekly market has negative divergence so you can keep your 50,000 short position.
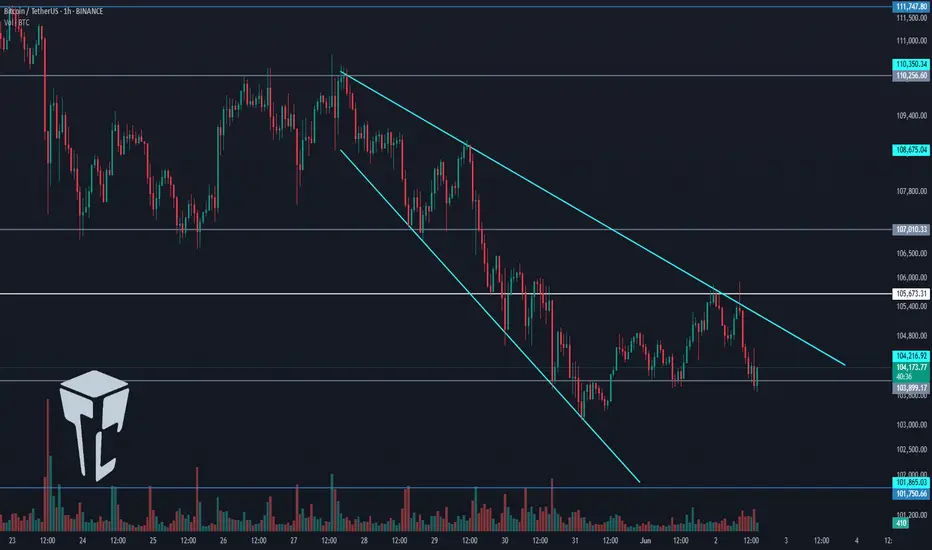
TradeCityPro | Bitcoin Daily Analysis #105👋 Welcome to TradeCity Pro!
Let’s dive into Bitcoin and key crypto indices. As usual, in this analysis, I’ll walk you through the triggers for the New York futures session.
⏳ 1-Hour Timeframe
On the 1-hour chart, as you can see, Bitcoin’s correction phase began after the breakdown of the 107010 level. Currently, after pulling back to the 105673 area, it seems ready to begin its next corrective leg.
✔️ One of the reasons Bitcoin has moved downward over the past few days is the escalation of war between Ukraine and Russia. As the conflict intensified, risk assets like Bitcoin dropped while safe-haven assets like gold surged.
🔍 Currently, price action is forming an expanding triangle and is trending downward. It was recently rejected from the triangle’s top and is now sitting on a key support at 103899.
💥 If 103899 breaks, a short position targeting 101750 could be triggered. Selling volume has increased significantly, confirming bearish momentum, so opening a short upon a break of 103899 appears logical. However, keep in mind that the primary market trend remains bullish, and there is a high probability that any short may hit stop-loss.
📈 For a long position, the first trigger would be a breakout above the triangle. In this case, breaking 105673 could justify entry. Key overhead resistances are located at 107010 and 110256.
👑 BTC.D Analysis
Looking at Bitcoin dominance, the metric continued its upward move to reach 64.67 and has since been rejected from that level.
⚡️ If the bullish move continues, the breakout above 64.67 would act as a bullish trigger. On the other hand, a breakdown below 64.29 would confirm a bearish shift.
📅 Total2 Analysis
Total2 is currently ranging between 1.13 and 1.16. A breakout from either side could serve as a trigger for a directional position.
📊 If 1.13 breaks, a short position could be considered. Conversely, breaking above 1.16 would signal a potential long.
📅 USDT.D Analysis
After breaking above 4.70, USDT dominance has been ranging between 4.70 and 4.79. It’s now heading back toward the 4.79 resistance.
🧩 If 4.79 is broken, the next bullish leg in dominance may begin. A drop back below 4.70 would bring the dominance back into its previous range and could lead to further downside toward 4.49.
❌ Disclaimer ❌
Trading futures is highly risky and dangerous. If you're not an expert, these triggers may not be suitable for you. You should first learn risk and capital management. You can also use the educational content from this channel.
Finally, these triggers reflect my personal opinions on price action, and the market may move completely against this analysis. So, do your own research before opening any position.
BTCUSD SELL NOW TO 100K!!!!!!BTCUSD took out the POC level and also a strong SSL and also formed a bearish flag am looking forward to see price revisit 100k level for liquidity sweep or grab
WHATS YOUR VIEW ON THIS.............?
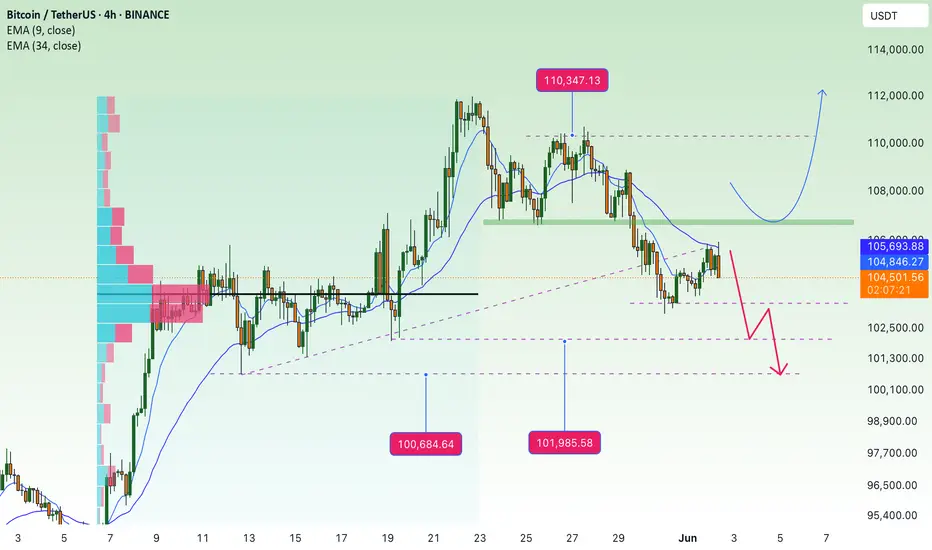
btc 4h chart Resistance Levels:
~104,570.96: This red line is currently acting as immediate resistance. The price has interacted with this level multiple times.
~107,000 - 107,800: The middle green shaded area (labeled "Fvg" which might stand for Fair Value Gap, often acting as S/R).
~109,500 - 110,500: The upper green shaded area.
~112,004.43: The yellow horizontal line, marking a previous significant high.
Support Levels:
~103,000 - 103,800: The lower green shaded area.
If the price breaks below the current level, the next potential support could be around the lows seen near 102,000 (though not explicitly marked with a line/box, it's a visible swing low area).

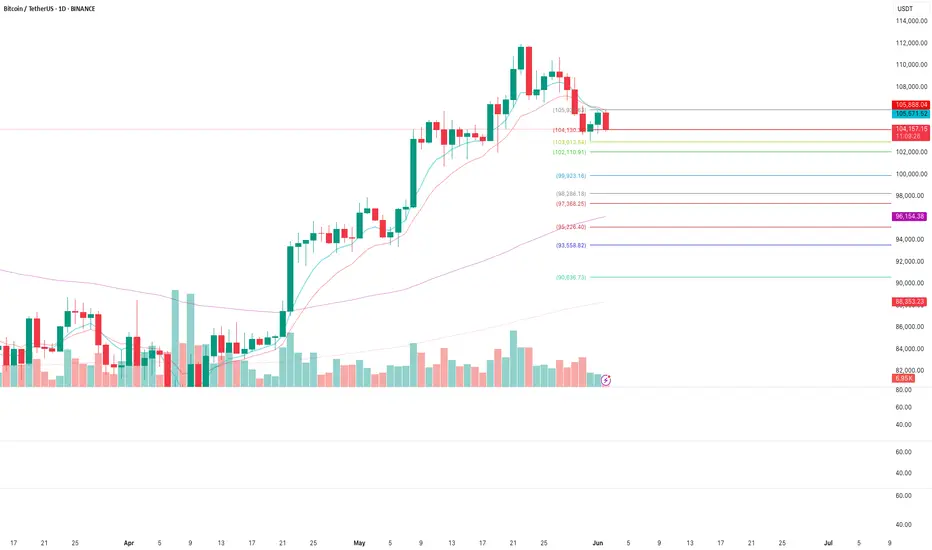
Short time, target 102.110Following daily chart.
I got a short signal from my power indicator.
TP1 102.110
TP2 99.923
SL close above 105.900 daily candle close.
Thoughts?
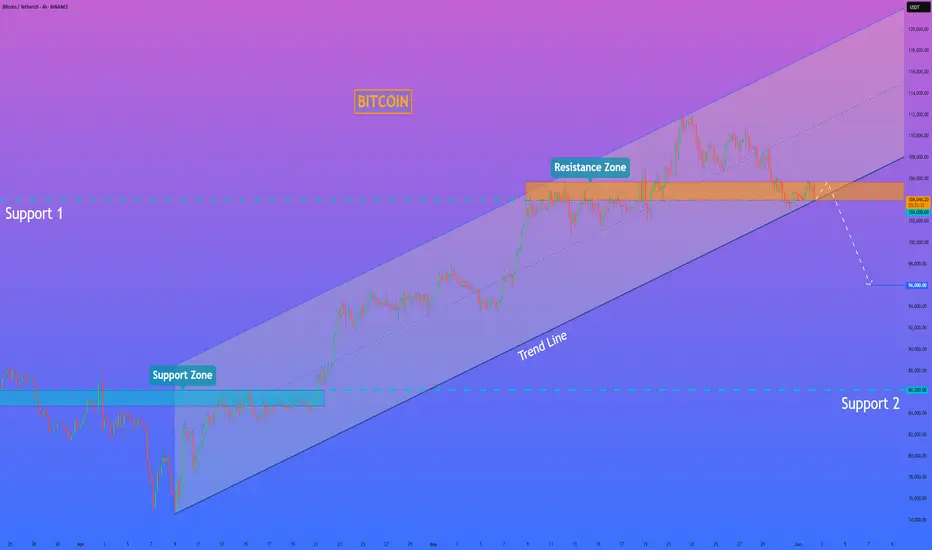
HelenP. I Bitcoin can exit break trend line and continue to fallHi folks today I'm prepared for you Bitcoin analytics. After looking at the chart, we can see how the price declined and broke support 2, which coincided with the support zone. Then the price rose to the support zone but turned around and dropped to the trend line. After this movement, BTC started to grow inside an upward channel, where it soon rose to support 2, which soon broke it and continued to move up. In the channel, price rose to support 1 and some time traded near this level. Later, BTC broke it and rose to the resistance line of the channel and turned around, and dropped to support 1. And at the moment, it traded inside the resistance zone, which coincided with the support level. So, I expect that BTCUSDT will break the support level, which coincides with the trend line, and continue to decline, thereby exiting from upward channel. That's why I set my goal at 96000 points. If you like my analytics you may support me with your like/comment ❤️
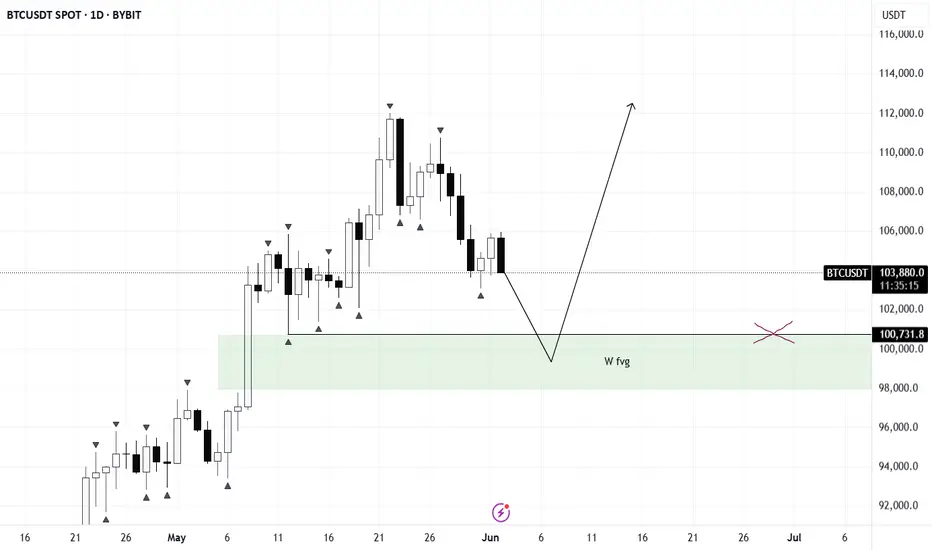
BTC/USDT🔔 New Month Kicks Off — Caution with Futures
I wouldn’t rush into aggressive futures trading right now.
Key long zones to watch:
• Liquidity sweep near 100,700
• Entry into the weekly FVG zone
That’s where I’ll be monitoring closely for potential position building.
🧠 The logic is simple:
For a solid entry point, the market needs to define the monthly and weekly lows.
This reduces the risk of getting chopped in volatility and offers a cleaner market structure.
☀️ Seasonal Context:
Summer is here — market dynamics shift.
Don’t expect explosive volatility; a prolonged sideways phase is on the table.
📉 If BTC sweeps the lows from current levels — we can consider a continuation of the long setup.
Otherwise, it’s best to wait for confirmation before entering.
BTC: Both Scenarios Explained - Still BearishBTC: Both Scenarios Explained - Still Bearish
From our previous analysis, BTC fell by almost 2.7%.
Today the price stood again at 106K showing a slight upward momentum, but as we can see, everything disappeared.
The price created and corrected ABC with the current data and if this correction has already passed, it should fall further today. Otherwise, it may continue to rise and test 106K again.
You may watch the analysis for Further Details!
Thank you!
Previous analysis:

BTC: Overall trend is up, but short term in (4hr tf) BTC: Overall trend is up, but short term in (4hr tf) looks like a relief bounce within a bigger downtrend correction.
key zone to observe :
106k -107k - looking to short
target zone: 100k - 97k

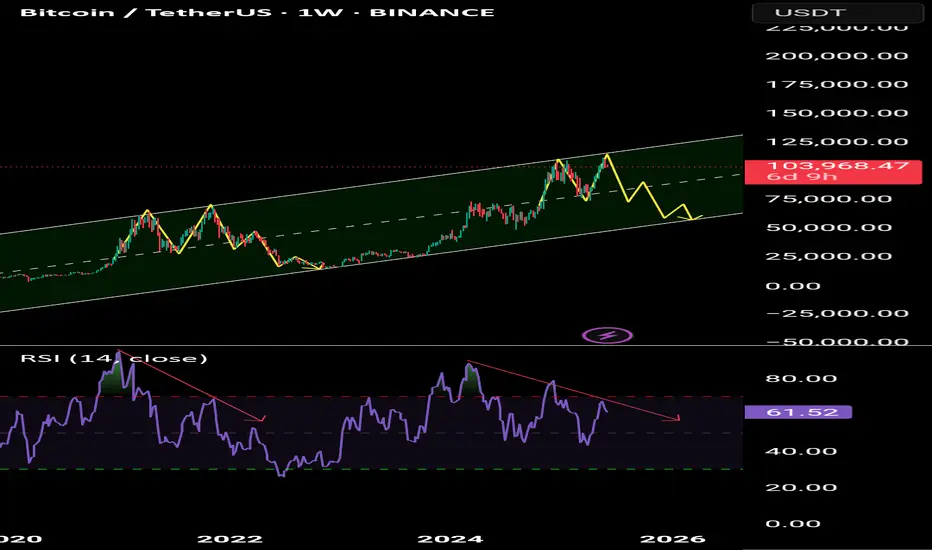
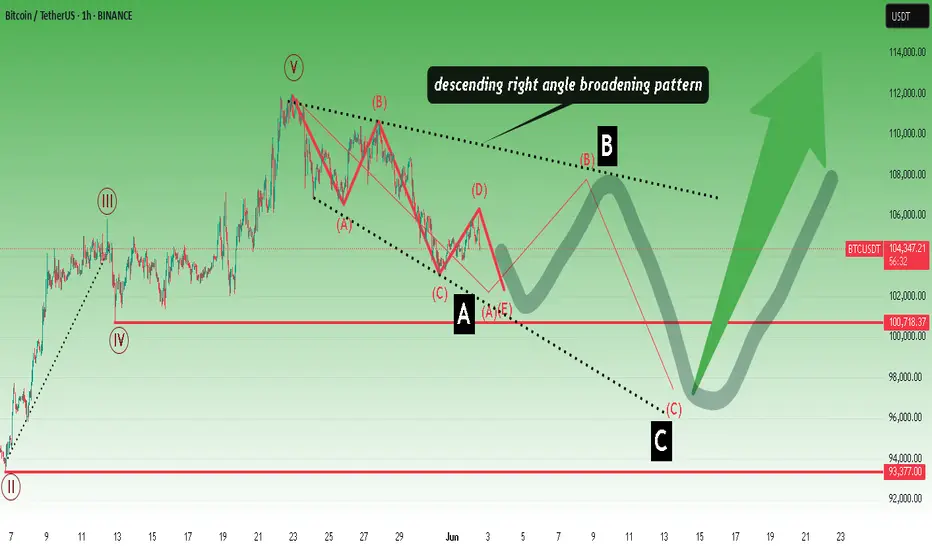
Descending right angle broadening pattern.Descending right angle broadening pattern and ABC correction waves after 5.wave.
* The purpose of my graphic drawings is purely educational.
* What i write here is not an investment advice. Please do your own research before investing in any asset.
* Never take my personal opinions as investment advice, you may lose your money.
HTF BTC Distribution ScenarioIt's not my preferred scenario, but until BTC closes weekly candles above 121k this is on the table. This would take months to play out so i just wait and react accordingly.
BTC/USDT – Retest in Play After Breakdown!Bitcoin broke below its 4H ascending trendline and is now showing signs of a retest at the broken trendline zone.
It tried to break the immediate resistance of $105,100 but couldn't sustain it.
📉 Breakdown confirmed
Key Levels:
Resistance: $105,968 | $108,941
Support: $101,539 | $97,205
Bearish Target remains near $97K if rejection holds
Watch how the price reacts here — rejection could lead to further downside. A break back above $105K may invalidate the move.
#Bitcoin #BTCUSDT #CryptoTrading #TechnicalAnalysis #TrendlineBreak #Retest #BearishSetup #PriceAction

BTC/USDT 4-Hour Technical Analysis – June 2, 2025The current BTC/USDT setup on the 4-hour timeframe continues to reflect a bearish structure, characterized by consistent lower highs and lower lows, indicating sustained downward momentum.
The chart identifies a Sell Stop entry at $102,886.86, strategically placed just below a recent support level. This allows the short position to activate only if price confirms further bearish continuation.
The trade plan is defined as follows:
Sell Stop: $102,886.86
Stop Loss (SL): $106,060.00 – placed above the recent swing high for risk protection
Take Profit 1 (TP1): $100,146.42 – the first support zone where a bounce could occur
Take Profit 2 (TP2): $98,451.67 – targeting a deeper extension in the prevailing downtrend
The RSI Divergence Indicator shows a reading of 42.53, still above oversold territory but trending downward. Additionally, a prior bearish divergence is marked on the RSI, reinforcing downside expectations.
The overall analysis points to a continuation of the downtrend, with the market expected to break below key support if selling pressure persists. This trade setup offers a favorable risk-reward ratio, provided price action confirms the entry trigger.
Let me know if you'd like this idea

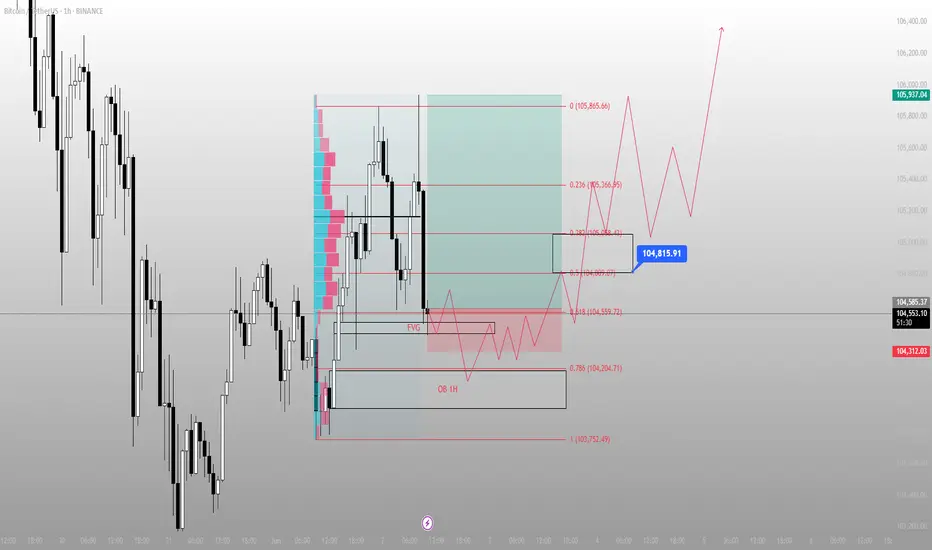
BTC didn’t dump — it tapped.BTC reached into the 1H FVG and wicked just above the OB at 104,204 — delivering premium liquidity and then reversing.
Most are staring at red candles, but the real story is the reaction zone:
Price tagged the 0.618 level (104,559) with precision and reversed with displacement.
Now what?
We're mid-delivery. If BTC can reclaim 104,800–105,000 (mid OB/FVG confluence), a strong move into 105,865 is likely — potentially sweeping for external liquidity near 106k.
Execution Plan:
Entry: 104,600–104,700 range
SL: 104,200 or beneath 103,752 swing
TP1: 105,365
TP2: 106,000+
Key invalidation: clean break below 104,200 with volume
Bias: Bullish while above 104,200
Why: Fair Value Gap fill + OB + 0.618 convergence + responsive wick
This wasn’t a sell-off.
This was a setup.
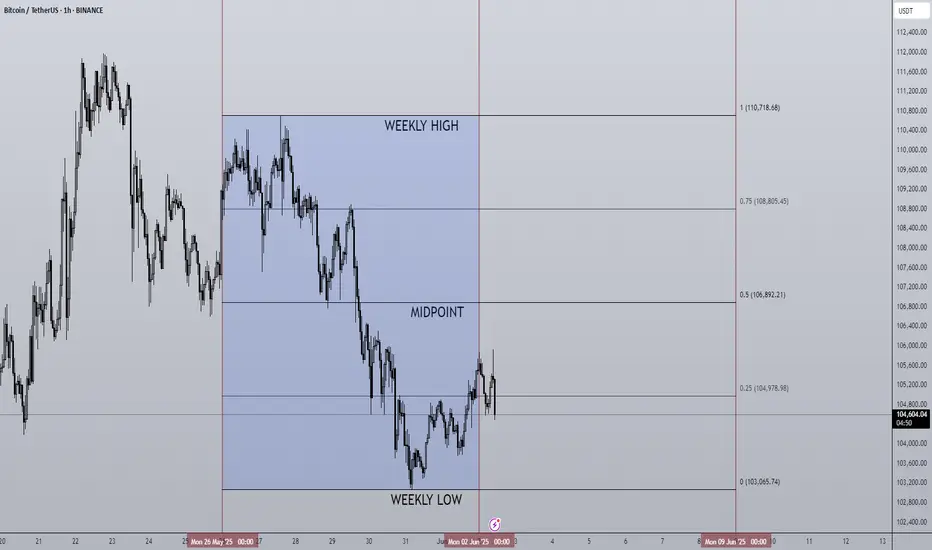
02/06/25 Weekly OutlookLast weeks high: $110,718.68
Last weeks low: $103,065.74
Midpoint: $106,892.21
As we approach the middle of the year, Bitcoin is back above $100,000 despite pulling back from a new ATH of $112,000. In the month of MAY BlackRocks ETF had record inflows of over $6B propelling prices 11% higher.
Last week we saw as the month closed and with that it's natural to have a window dressing period that usually leads to de-risking slightly. BTC stayed within the previous weeks range and maintains the pattern of:
Chop/consolidation --> expansion to the upside --> chop/consolidation...
However in this case the consolidation week had a much larger range than in the past which is a sign to me that the rally is exhausted for now. It's because of this I feel we may see a weekly low break for the first time in a month and get a more meaningful pullback than we've seen since early April. My target would be around the $97,000 area.
The case for the bulls is still a convincing one despite some red flags. Record ETF inflows continue to pour, M2 money supply continues to grow and a general shift to risk-on assets is clear. However these are longer term factors and just for this weeks outlook the momentum is with the bears briefly.
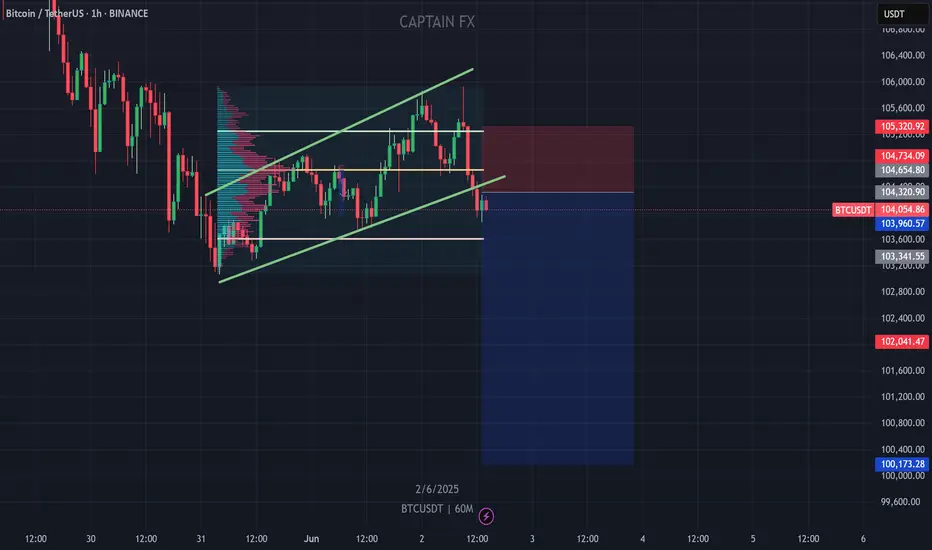
BTC short term correction: zone 100k💎 BTC PLAN UPDATE (June 2)
NOTABLE NEWS ABOUT BTC:
Meta shareholders have decisively voted down a proposal to explore adding Bitcoin to the company’s balance sheet, signaling limited appetite for crypto exposure at the tech giant.
According to a regulatory filing dated May 28, the “Bitcoin treasury assessment” proposal garnered just 3.92 million votes in favor — representing a mere 0.08% of total shares — while nearly 5 billion votes against it.
Given that CEO Mark Zuckerberg holds 61% of Meta's voting power, as disclosed in an April filing, it is likely he played a pivotal role in rejecting the measure.
TECHNICAL ANALYSIS PERSPECTIVE
Bitcoin closed below the daily support level of $106,406 on Thursday and fell another 1.50% the following day. However, prices saw a slight recovery over the weekend. As of Monday's writing, BTC is trading below $105,500.
Assuming BTC faces resistance around the $106,406 daily level and continues correcting, it could extend the decline to retest the psychologically important $100,000 mark.
The Relative Strength Index (RSI) on the daily chart is at 53, trending down toward the neutral level of 50, indicating weakening bullish momentum. The Moving Average Convergence Divergence (MACD) also showed a bearish crossover last week. The increasing red histogram bars below the baseline further signal a potential correction ahead.
At this point, whether you are new or experienced, it’s advised to spend more time practicing and enhancing your knowledge of technical analysis. Consider exploring educational posts on the channel (…) to strengthen your foundation and avoid losses during this period.
==> This is a trend-based analysis for reference only. Wishing all investors successful trades!
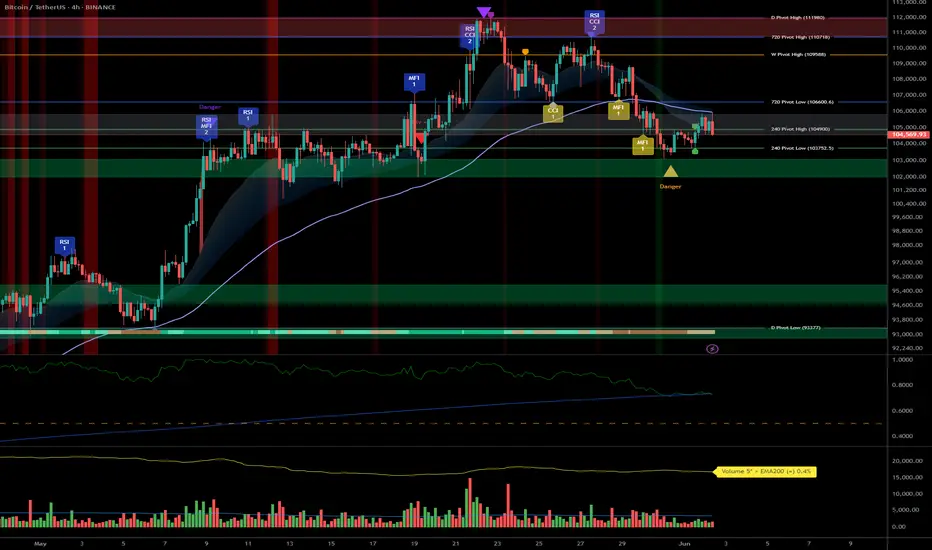
BTCUSDT: Strong Risk-On Signal, Optimal Swing Above 103k__________________________________________________________________________________
Strategic Summary
__________________________________________________________________________________
Global bias : Dominant bullish structure, confirmed sector momentum, “risk-on” technical setting.
Opportunities : Favored swing entries above supports (103703.7–107019.9), breakout plays at 104865/106537.
Risk zones : Technical invalidation below 103703.7 or rapid ISPD DIV deterioration (red/orange zone + extreme selling volumes).
Macro catalysts : Rate, inflation/PCE, job numbers publication (48–72h) – to monitor closely for volatility pivots.
Action plan : Tight stops below supports, partial profit-taking on resistances, reduce exposure before key macro events, re-enter post-announcement on confirmed direction.
__________________________________________________________________________________
Fundamental & Macro Analysis
__________________________________________________________________________________
Favorable macro momentum (BTC, ETH, equity indices, institutional trust). Bull-cycle confirmation via technical triggers (bullish cross, MACD divergence).
Risks : Major token unlocks coming (3.3B+), on-chain euphoria (extreme profit/loss, exchange dominance >33%). Dynamic risk management crucial – swing stop-loss < 103703.7 is imperative.
Events to watch : US rates, inflation/PCE, payroll data – periods of heightened volatility expected, necessitating exposure adjustment.
Swing trade plan : Defensive entries on key supports, reduction pre-announcement, gradual profit-taking below 106537, then 109952.8/111949.
Risk/reward : Optimal for swing trades near supports, tactical management required for breakout chasing.
__________________________________________________________________________________
Multi-Timeframe Analysis
__________________________________________________________________________________
1D (Daily) : Bullish structure intact, key supports (107019.9, 81075.6). Risk On / Risk Off Indicator remains “Strong Buy”. No excess in volumes or behavior – buyers’ climate.
12H – 6H : Solid momentum above 103703.7–106537. Risk On / Risk Off Indicator still “Strong Buy”, ISPD DIV neutral, standard volumes.
4H – 2H – 1H : Pivot range (103703.7/104865/106537), buyer momentum, swing/scalp strategies favored. Supports to watch: 103703.7 (main stop trigger).
30min – 15min : Tight range (103703.7/104865), Risk On / Risk Off Indicator “Buy” (slightly weaker on 15min). Tactical scalping on bounce or pivot breakouts – risk zone if range breaks sharply.
Summary : Sectoral outperformance on all timeframes via the Risk On / Risk Off Indicator, ISPD DIV neutral, normal volumes. Key pivots: 103703.7 (support) and 104865/106537 (resistances) frame all action. Swing trading optimality as long as these levels hold.
__________________________________________________________________________________
Conclusion
__________________________________________________________________________________
BTCUSDT market remains bullish on all timeframes, supported by strong sector momentum (Risk On / Risk Off Indicator), steady volume and behavioral stability (neutral ISPD DIV). Preference remains for long strategies on support, with increased vigilance around macro windows (events, unlocks). Strict stop discipline and active profit-taking are key on extension moves.
__________________________________________________________________________________