BTC Long Trade Setup IdeaTrade Setup Idea:
- Entry: 103,243.4 - 103,689.2
- Stop Loss (SL): 102,886.8
- Target Levels: 111.9K 116K, 121K, 127K, 131K, 140K
BTCUSDT.3S trade ideas

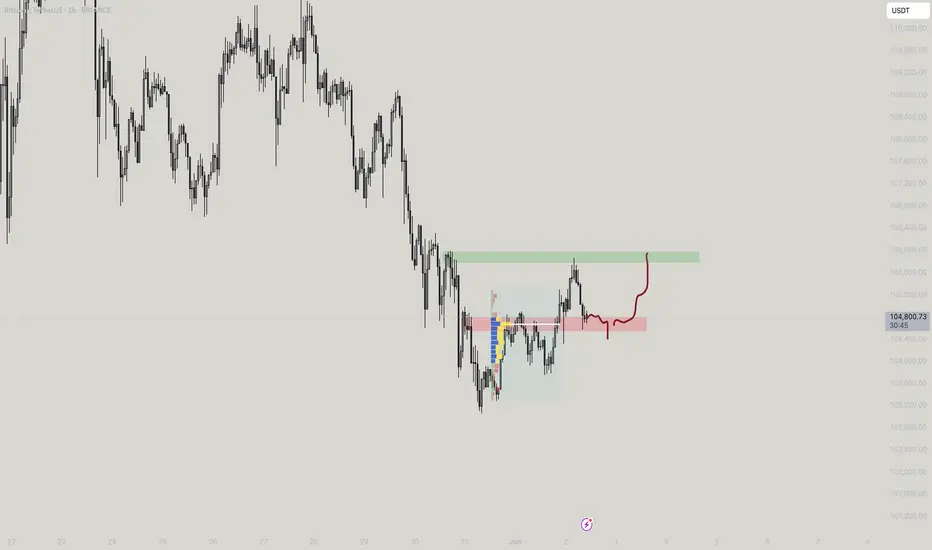
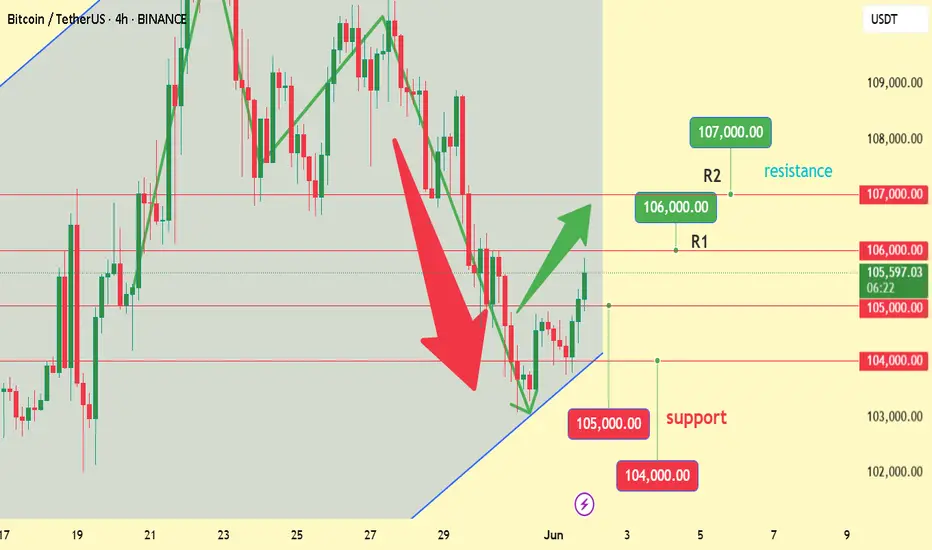
BTC — Choppy Range Until BreakoutPrice is caught between key levels:
• Support: $101.8k (4H demand)
• Resistance: $106.6k–107.1k (4H supply zone)
Current structure suggests range-bound price action with low conviction for directional trades until one of these levels is broken.
Plan:
🔁 Range: $101.8k–$106.6k
• Expect multiple drives and fakeouts
• Ideal zone for scalping only, take profits fast
• Avoid breakout anticipation — let the level break first
🚀 Breakout Scenario:
• Flip of $106.6k opens the path to new ATHs
• Break and hold above → long trigger to $110k+
📉 Breakdown Scenario:
• Loss of $101.8k leads to $100k–$98k zone
• Break below $100k = deeper market flush possible
📌 No big move expected until range resolves. Patience and precision are key.

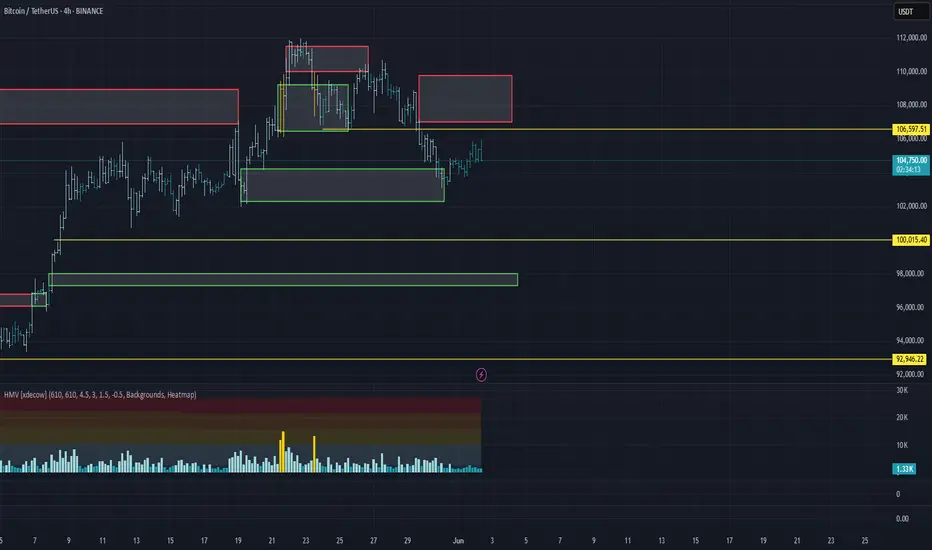
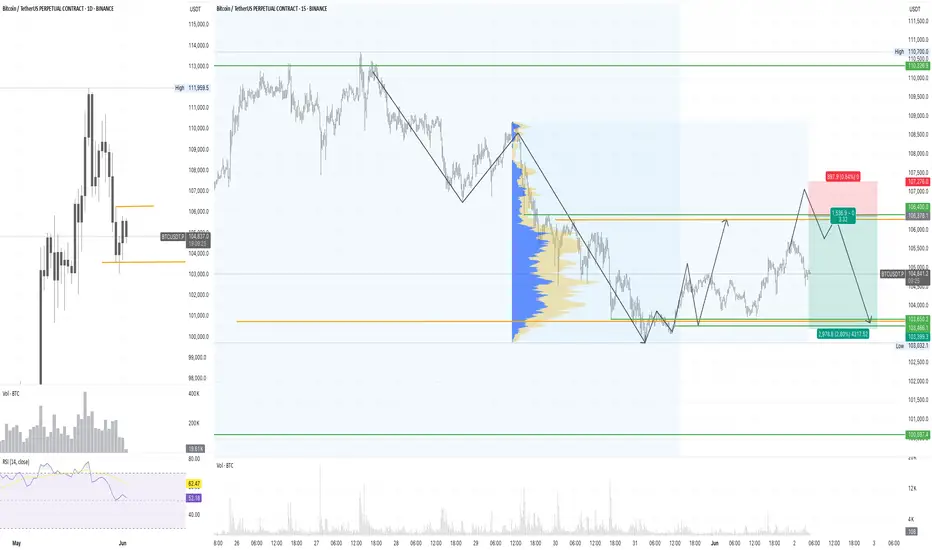
Market Overview
WHAT HAPPENED?
Despite the prevailing bullish trend, bitcoin failed to gain a foothold at the lower end of the sideways range. Instead, there was a breakdown downwards, which led to a shift of the accumulated volume in the short direction.
After that, the support zone of $104,200 – $102,300 (accumulated volumes) was tested, which was followed by the first positive reaction from buyers.
WHAT WILL HAPPEN: OR NOT?
It’s too early to talk about a full-fledged reversal and a resumption of the bullish trend. The resumption looks weak, both in terms of volume and momentum.
In the near future, we should expect a repeat test of the formed minimum. In the absence of a buyer's reaction, a rollback to the next area of interest is possible. An alternative scenario is the formation of a new sidewall between key levels:
– $104,200 – $102,300 (current accumulation zone),
– $107,000 – $109,800 (potential upper limit).
Sell zone:
$107,000–$109,800 (accumulated volume)
Buy zones:
$104,200–$102,300 (accumulated volume)
~$100,000 (initiating volume)
$98,000–$97,200 (local support)
Level at $93,000
$91,500–$90,000 (strong buying imbalance)
IMPORTANT DATES
The following macroeconomic events are expected this week:
• Monday, June 2, 13:45 (UTC) — the publication of the index of business activity in the US manufacturing sector for May;
• Monday, June 2, 14:00 (UTC) — publication of the ISM index of business activity in the US manufacturing sector for May;
• Monday, June 2, 17:00 (UTC) — speech by Fed Chairman Jerome Powell;
• Tuesday, June 3, 09:00 (UTC) — publication of the consumer price index for May and in comparison with May 2024 in the Eurozone;
• Tuesday, June 3, 14:00 (UTC) — publication of the number of open vacancies in the labor market (JOLTS) USA for April;
• Wednesday, June 4, 12:15 (UTC) — publication of changes in the number of people employed in the US non—agricultural sector for May from ADP;
• Wednesday, June 4, 13:45 (UTC) - publication of the index of business activity in the service sector (PMI) USA for May, as well as Canada's interest rate decisions;
• Wednesday, June 4, 14:00 (UTC) — publication of the US non—manufacturing purchasing managers' index for May from ISM;
• Thursday, June 5, 12:15 (UTC) - publication of the deposit rate, as well as interest rate decisions in the Eurozone;
• Thursday, June 5, 12:30 (UTC) — publication of the number of initial applications for unemployment benefits in the United States;
• Thursday, June 5, 12:45 (UTC) — press conference of the European Central Bank;
• Friday, June 6, 12:30 (UTC) — publication of the average hourly wage, changes in the number of people employed in the non-agricultural sector and the unemployment rate in the United States in May.
*This post is not a financial recommendation. Make decisions based on your own experience.
#analytics
BTC/USDT 4-hour chartBTC/USDT 4-Hour Technical Analysis – June 2, 2025
The current BTC/USDT chart shows a clear downtrend pattern on the 4-hour timeframe. Price action has been forming lower highs and lower lows, indicating sustained bearish momentum. This is further supported by the RSI Divergence Indicator, which is showing bearish signals, confirming potential further downside.
A sell stop entry is marked at $105,795, suggesting a short position to be triggered only if the market continues downward and breaks support.
The trade setup includes:
Stop Loss (SL): $108,807 – just above recent highs to protect against unexpected reversals.
Take Profit 1 (TP1): $102,813 – aligning with a previous minor support zone.
Take Profit 2 (TP2): $99,985 – targeting a deeper move in the current bearish wave.
The RSI is hovering around 48.39, which still leaves room for more downside before reaching oversold territory, supporting the bearish outlook.
In summary, this setup reflects a continuation of the downward trend, with tight risk management and profit levels that align with historical price zones. Traders are advised to watch for confirmation of the sell trigger before entering.

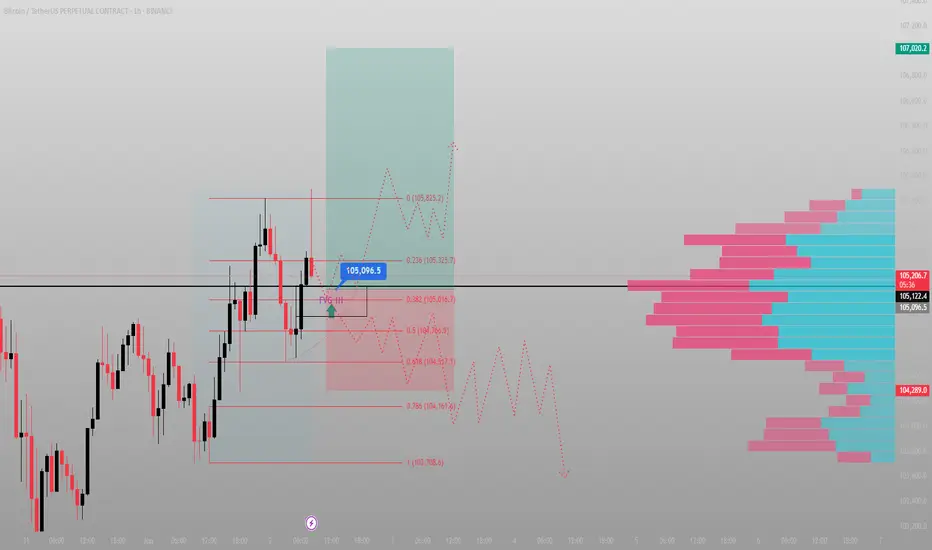
Most called rejection. I called reaccumulation — mid-trade.This wasn’t luck. It was structure.
BTC tapped directly into the 1H Fair Value Gap at 105,016 — precisely the overlap with 0.382 fib and the volume imbalance from the prior impulse. Price didn’t just react. It delivered confirmation. Fast.
Entry was clean, risk tight — and the invalidation was defined. Below 104,517, I’m out. No emotion. Just system.
I’m now watching the 105,325–105,825 pocket. That’s where the thin volume zone transitions back into resistance — and where trapped shorts begin to feel the heat.
If price breaks and holds above 105,900, expect a swift drive into 106.7–107.0 before further consolidation.
Execution clarity:
✅ Entry: FVG 1H — 105,016
🎯 TP1: 105,825
🔒 Stop: 104,517
🔓 R:R = 2.38, no drawdown, full intent
Most wait for confirmation.
I act at the point of imbalance — not after it’s obvious.
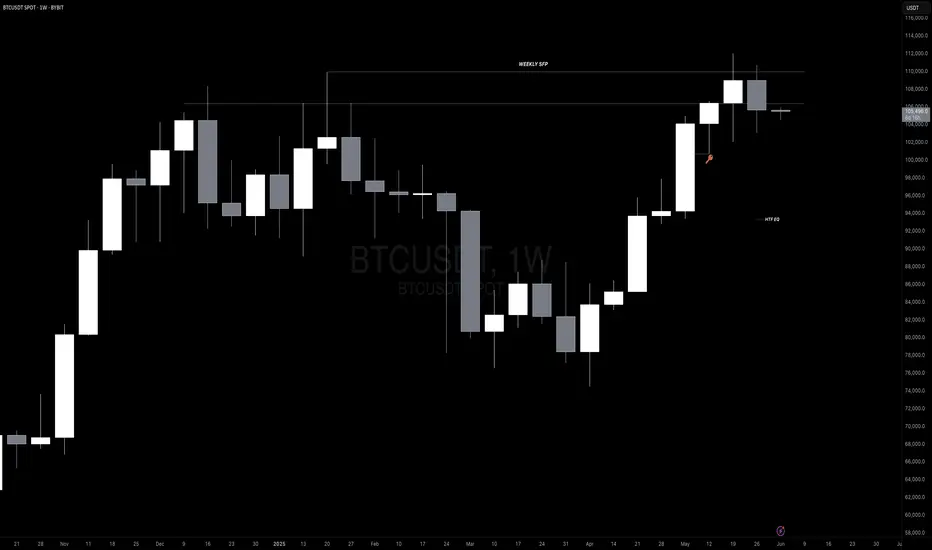
BTC (Post Weekly Close Update)CRYPTOCAP:BTC (Post Weekly Close Update)
We’ve confirmed a weekly SFP and observed a bearish engulfing weekly close, signaling caution at the very least. Whether the price corrects to our target, BOs here, or reaches a new ATH remains uncertain, so we’ll play it level by level. Imo, subtle signs of bullish exhaustion are worth noting.
That said, I don’t expect a collapse to 70K, though anything is possible. I anticipate a drop below the key 100K level, targeting the 18H HOB and weekly FVG around 98K. We could even see a wick into the CME gap, YO, and VRVP support observed at 94K. This move may spark fear, traders anticipating lower, with some calling for a bear market. However, I expect the price to reverse, reclaim key levels, and resume the uptrend.
On LTF/MTF - charts, we’re trading level by level. A range may form, allowing the market to gather liquidity to sustain the trend, especially since we missed liquidity at 72K. As long as the price remains below 107K, scalping makes more sense than swing trading in the short term. A break above 107K could target 110K or a new ATH. However, if the price reaches 107K - around 107800 - I’d consider shorting. A daily close above 107K might trap retail traders into opening longs, only for the price to retrace and head lower (keep this scenario in mind).
VELO data:
Market dynamics are stable. Spot is flat or selling, while perps are driving pric. OI has dropped from dangerous levels, and funding rates remain slightly positive. Overall, nothing significant is occurring, which aligns with the current range-bound market.
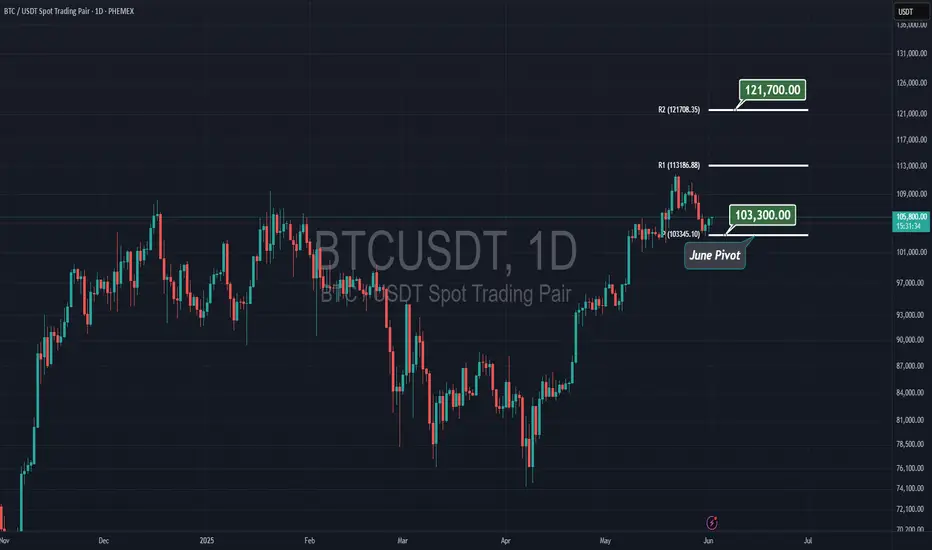
Bitcoin on JUNE's Pivot, $103kI believe $103,300 ( June's Pivot ) will hold bitcoin, and in few days we see a rally to the upside, and by the end of June, Bitcoin will reach to $121,700 which is the 2nd resistance for the pivot.
Long time no trade! Weekly Trade Outlook – BTC Focus
Monday Recap | 3PM GMT
Bitcoin remains in a global uptrend, but we’re currently sitting at the weekly range extreme — so caution is key. Internally, we've seen some bearish action, but price recently tapped into a clean 4H demand zone, showing a strong reaction.
Key question this week:
→ Can we reclaim 2H structure to make another push toward the top of the range?
Before that happens, keep in mind there's a 4H supply zone acting as resistance, so we’ll need to see how price reacts there.
While BTC navigates this structure, there are notable scalp opportunities setting up this week. All have been outlined in the setup — just remember:
Wait for confirmation before entering.
De-risk quickly when in profit.
Stay adaptive, especially around the midrange levels.
🎥 Video recap dropping later today — stay tuned.
Weekly Class Schedule
🕒 Monday – 3PM GMT
🕒 Tuesday – TBC
🕒 Friday – TBC

Lingrid | BTCUSDT All-Time High Level Retest Long SetupBINANCE:BTCUSDT is holding above the $103,500 support area after a textbook pullback from the higher high at the resistance ceiling. The price is respecting the upward channel and bouncing near the lower boundary, suggesting renewed bullish intent. A reclaim of the $106,000 zone could trigger continuation toward $111,800 within the broader target area. Bulls remain in control while price sustains above the upward trendline.
📈 Key Levels
Buy zone: 103,000–104,000
Buy trigger: 106,000 reclaim with volume
Target: 111,800
Sell trigger: clean break below 103,000
💡 Risks
Weak bullish follow-through above 106k may signal exhaustion
A breakdown below the channel support flips bias to bearish
Macroeconomic volatility could disrupt the technical setup
Traders, if you liked this idea or if you have your own opinion about it, write in the comments. I will be glad 👩💻

BTC - Hedge SetupWe’re currently in a bearish structure, but we've just formed a smaller bullish structure, and the B–C correction within it offered a solid opportunity for short-term long positions.
Once we reach the bullish target zone and the bearish trend reversal area, anyone with overexposed long positions can consider opening a short-term hedge — and move it to break-even once it’s in profit.
New week, new gains!
LFG

BTC Trendline Breakdown? Bearish Setup Brewing!📉 #Bitcoin has recently broken its key trendline after making a new All-Time High (ATH). This could be the first major sign of a trend reversal. Here’s what we’re seeing:
🔹 Trendline Broken: The uptrend has been broken — a significant technical signal.
🔹 Retesting the Break: Price is currently retesting the broken trendline, a classic move before continuation.
🔹 Triple Touch Confirmation: The trendline was respected with 3 clear touches during the uptrend — increasing the validity of this break.
🔹 Support Still Holding: We’re watching a major support level below — a break here would confirm bearish momentum.
🚨 Strategy Plan:
If the support level breaks and #BTC retests it as resistance, we’re planning a short position with strict risk management. Patience is key — wait for confirmation before entering!
🛡️ Risk Management First. Always.
Don't rush into a trade — wait for a clean breakdown and retest for a high-probability entry.
📊 What do you think? Is #BTC ready to reverse, or will the bulls defend the trend?
👇 Drop your thoughts in the comments.
❤️ Like this idea if it helped you.
✅ Follow for more #BTC setups and real-time updates!
#BTCUSD #Bitcoin #CryptoTrading #TrendlineBreak #ShortSetup #TechnicalAnalysis #BearishReversal #PriceAction #TradingStrategy

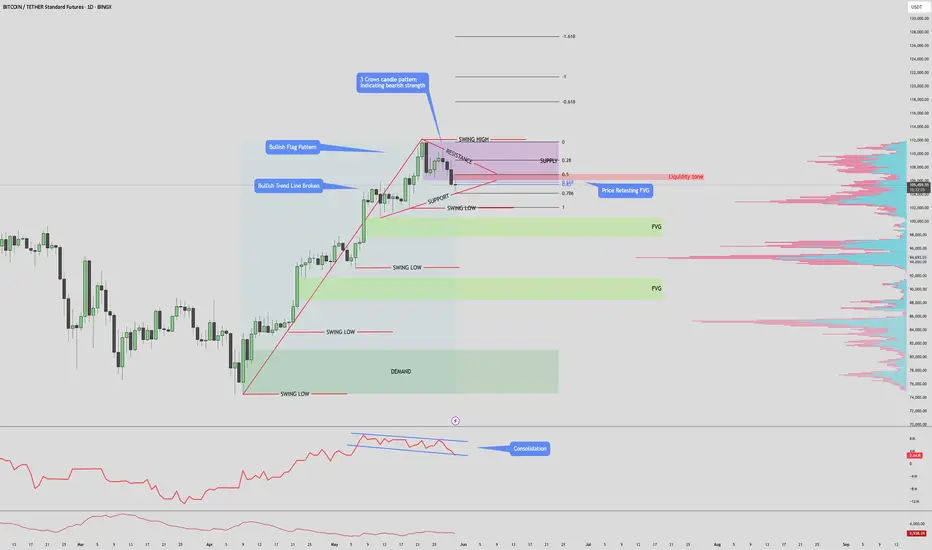
$BTC/TETHER Daily Time Frame new ATH incoming?Bitcoin Market Outlook
Bitcoin has stalled after printing new all-time highs, now consolidating within a **supply zone** while forming a **bullish flag pattern**. Price is currently testing the **Fibonacci golden pocket** region (0.618–0.65), a critical level for potential reversal or continuation.
A **\$71M liquidation cluster** is stacked around **\$107,000**, just above current price—making it a key magnet for upward movement.
Bullish Scenario
* If price breaks above the supply zone and clears the \$107K liquidation area, we can expect a push toward **flag resistance**.
* A confirmed breakout from the flag could trigger **continuation to new highs**, supported by low resistance overhead and momentum from short liquidation.
Bearish Scenario
* If price fails to hold the golden pocket and breaks below **\$102,000**, a drop toward **\$99,000** is likely.
* This level is reinforced by **two unfilled Fair Value Gaps (FVGs)**, which may act as magnets for price rebalancing before potential recovery.
Let me know if you notice anything wrong with this, or have some charts of your own!
Thank you for reading.
BTC - Road to 107k through small scalps!!As I mentioned earlier the time i posted the chart, BTC did exactly the move I anticipated, however 104,545 is the point of your buy with short scalps till 105,992, if moves up trail, can throttle to 107,914
BTC - Some local POIsBTC on Binance or Bybit is not that Fib-friendly. CME is much better.
CME is closed over weekend, but here a quick local TA and 3 POIs.
Any question ? write it in comments ;)
Follow for more ideas/Signals.💲
Check out my previous TA/Signals which played out nicely. :)
Just donate some of your profit to Animal rights or other charity :)✌️

Short BTC1. Daily Bias (D1): SELL
D1 in downtrend
RSI weak (under 60)
Price under resistance (111.9)
✅ Bias: SELL confirmed
2. Market Structure (M15)
Price formed LH-LL
Current move = pullback to previous supply
✅ Structure supports short plan
3. Trap / SFP Zone
Expected trap near 107.2
Waiting for confirmation before selling
✅ Trap setup planned
4. Entry & Risk Plan (From Chart)
Entry: ~106,378
Stop Loss (SL): 107,276
Take Profit (TP): 103,399
Reward/Risk (R:R): ≈ 3:1
✅ Logical levels
✅ Good R:R
✅ Entry based on confirmation
Navigating a Projected 2025-28 Bear Cycle & Accumulation RoadmapFellow Traders,
This post outlines a conceptual Bitcoin bear market projection (2025-2028) and a phased accumulation strategy, based on synthesized market cycle data. (Inspired by external analyses).
I. Projected Bear Market Timeline:
Q4 2025: Euphoria Top (Potential 100k-120k)
Q1 2026: Bear Trigger (SPX correction, BTC < 60k)
Q4 2026: Capitulation (Crash towards $30k, miner selling)
Q2 2027: Extreme Fear & Bottom (Recession, BTC plunge to 18k-25k)
Q4 2027: Accumulation Begins (e.g., MVRV < 0.5)
Q1 2028 onwards: Slow Recovery (Halving anticipation)
II. Phased Accumulation Strategy:
A systematic buying approach across distinct price zones, triggered by on-chain/macro signals:
Early Accumulation (22k - 25k): 20% Allocation.
Triggers like MVRV < 0.85, high VIX.
Core Accumulation (18.5k - 20k): 50% Allocation.
Triggers like Hash Ribbons "Recovery," low funding rates.
Aggressive Accumulation (16.5k - 17.5k): 20% Allocation.
Triggers like Fed cuts, NUPL < -0.75.
Black Swan Buy (14k - 15k): 10% Allocation.
For extreme, unexpected negative events.
(Timelines for these phases roughly span Q4 2026 - Q3 2027)
III. Key Supporting Concepts:
Price Floor Models: Models like MVRV Z-Score (16.8k), Thermo Cap (17.2k), and Realized Price (21k) align with accumulation zones.
Bottom Confirmation: Watch for signals like MVRV < 0.75, aSOPR < 0.85 (est. Q2-Q3 2027).
Diversified Capital: Strategy suggests a broader allocation including BTC Spot (70%), Gold (15%), Cash (10%), and BTC Call Options (5%) for risk management.
Conclusion:
This conceptual framework suggests a long-term, disciplined approach to navigating a potential BTC downturn and subsequent accumulation. Patience, phased entry based on data (not emotion), and risk awareness are paramount.
This is a conceptual model, not financial advice. DYOR.

Bitcoin Market OutlookBitcoin Market Outlook
Bitcoin has stalled after printing new all-time highs, now consolidating within a **supply zone** while forming a **bullish flag pattern**. Price is currently testing the **Fibonacci golden pocket** region (0.618–0.65), a critical level for potential reversal or continuation.
A **\$71M liquidation cluster** is stacked around **\$107,000**, just above current price—making it a key magnet for upward movement.
Bullish Scenario
* If price breaks above the supply zone and clears the \$107K liquidation area, we can expect a push toward **flag resistance**.
* A confirmed breakout from the flag could trigger **continuation to new highs**, supported by low resistance overhead and momentum from short liquidation.
Bearish Scenario
* If price fails to hold the golden pocket and breaks below **\$102,000**, a drop toward **\$99,000** is likely.
* This level is reinforced by **two unfilled Fair Value Gaps (FVGs)**, which may act as magnets for price rebalancing before potential recovery.

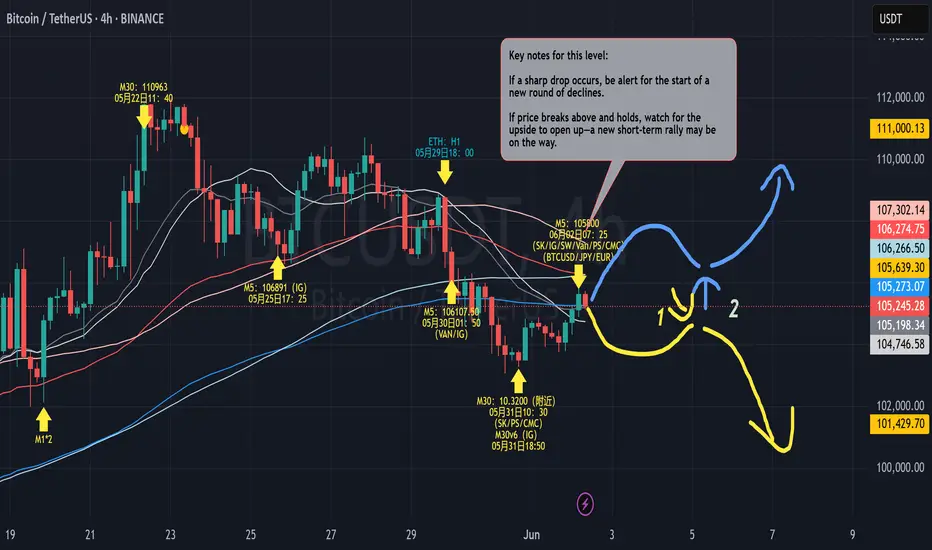
Key Market Turning PointThe market is now at a clear crossroads, with two distinct possible directions:
Yellow Path
If the current rebound loses steam and stalls around resistance, I will focus on the Point 1 area. As soon as a bearish signal emerges (e.g., price rejection, clear downtrend formation), I will start shorting in batches, aiming to catch the downward move. This is a “wait for confirmation, then act” approach—never betting blindly. Personally, I prefer this scenario, as there’s still significant overhead pressure and no obvious new bullish momentum.
Blue Path
If price breaks out strongly and holds above the key level, I’ll shift my focus to Point 2. I’ll wait for a clear bullish setup after a pullback, then go long with the new trend. But this is only my backup plan—not my main scenario for now.
My strategy in short:
Stay patient—don’t guess, don’t jump in early, only trade when there’s a clear signal.
Leaning bearish for now, but will quickly adapt if the market turns strong.
Position sizing and stops are always clear—never stubbornly hold a losing trade.
Often, the best trades come from simply waiting for confirmation, not from predicting the future. Good signals aren’t always present—patience and discipline are what make trading consistent over time.
Today's BTC trading strategy, I hope it will be helpful to youSustained Capital Inflows
Increasing amounts of capital are flowing into the Bitcoin market. Large institutional investors with keen insights have been continuously buying Bitcoin, providing strong support for its price increase. To draw an analogy, the Bitcoin market is like a large reservoir—when new water continuously flows in, the water level naturally rises easily.
Technological Development Driving Growth
The blockchain technology behind Bitcoin continues to advance. Take the Lightning Network as an example: it has made Bitcoin transactions faster and reduced transaction fees, significantly enhancing the practical usability of Bitcoin. Technological advancements have increased Bitcoin's attractiveness, prompting more people to hold it, which in turn provides momentum for price increases.
Impact of Global Economic Conditions
The current global economy is unstable, with many countries implementing accommodative monetary policies. This has led to a continuous increase in the money supply in the market, causing the real purchasing power of currency to decline. Bitcoin has a fixed total supply (only 21 million coins), and its scarcity has become particularly valuable in this context. In such an environment, Bitcoin has become a choice for many people to preserve and increase the value of their assets. The increase in demand naturally tends to drive prices higher.
Today's BTC trading strategy, I hope it will be helpful to you
BTCUSDT BUY@104000~105000
SL:102000
TP:106000~107000
#Bitcoin Update 01.06.2025Despite last week's negative movement, my analysis shows that Bitcoin remains bullish. Let’s break this down step by step 🔍:
🚀 1. Deep Retracement Completed
Bitcoin has just completed a strong retracement and bounced back exactly from a key level – check Arrow #5. This is a major signal because the last time we saw such a deep retracement on the daily timeframe was back in April 2025… and that led to a significant rally. We may be witnessing the start of another strong leg upward 📊.
✅ 2. Reversal Confirmation Needed
However, theory always needs confirmation. The bullish confirmation will come when we see a clean breakout above Arrow #4. A break of this level will give us the green light 🚦 for a bullish continuation.
🔥 3. Break Arrow #2, and Sky Is the Limit
If the price manages to push above Arrow #4, it could easily break past Arrow #2, and from there, the next major resistance sits around \$114K – yes, you read that right! 🎯
⚠️ Bearish Scenario
On the flip side, the bearish confirmation will only come if Bitcoin breaks below the Arrow #6 black line (refer to my previous analysis for that key level). Until then, the bulls are still in control 💪.
💬 Stay focused, stay patient – the charts are telling a powerful story. We’re on the edge of a potential big move. Trade smart, and don’t get shaken out by noise.
🚨 More updates and levels coming soon – keep your eyes open!
#Crypto #BTC #Trading #BitcoinAnalysis #BullishOrBearish

Clearly we are forming a pattern here.We will soon swim above the water surface and see mass adoption by institutional, sovereign wealth funds, nations, as they become participants in the network.

BTCUSDT PERPETUALSwing position. Bought @103250.0 TP @110573.0
Looking at the dealers range from the image, it shows price is following a continuation long. price has pulled back back to extreme discount to take it higher.

BTC/USD next wave started. So this is my planBitcoin started the rally, and I'm expecting a bullish rally till 106700 range. Expecting a pull back. And re-entering again at the tip. Holding it till 107500
