btc btc crash is coming next week tight your seat belt as it indicates it was broket the ATH meand all the time high so that also it creates double top tough we are waiting the supply zone retest and them all the way down we will see the result next week subscribe me
BTCUSDT.3S trade ideas
BTC/USDT – Trendline Breakdown Alert!Bitcoin has broken below its ascending trendline on the 4H chart, signaling a potential shift in momentum. 📉
Current Price: $103,322
Immediate Support Levels: $101,539 | $97,205
Target Zone: ~$97K if bearish momentum continues
Resistance: $105,101 | $108,941
If the momentum is sustained above $105,101, we can see a rally to the immediate resistance of $ 112,000.
Stay tuned for detailed updates !!
Watch for confirmation below $101.5K — a sustained drop could open the gates to further downside. Trade safe! 🚨
#Bitcoin #BTCUSDT #CryptoTrading #TechnicalAnalysis #TradingView #ScramblerG
BTCUSDT Preparing for one more time jumpThe reversal area has been marked on the chart..
When the price comes to the level we need to see some bullish momentum before we enter into the rocket trade..
THANKS.
DYor

Technical Note on BTC/USDBearish bias in the short term unless the price breaks and holds above the resistance.
• Monitor volume and structure on the breakdown to confirm momentum.
• Key levels to watch: Resistance ~109,000, Support ~104,000–104,500.
BINANCE:BTCUSDT
Please, God, please 🚀🚀
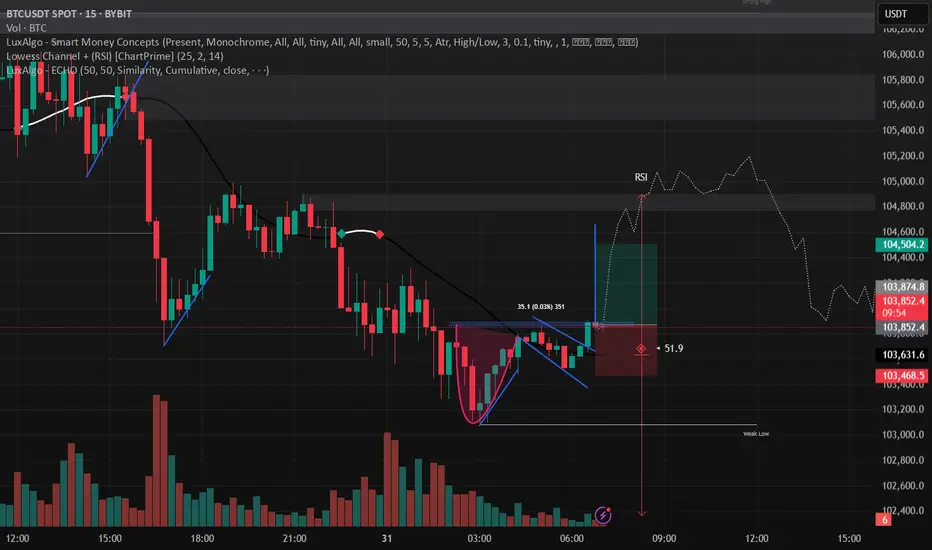
Bullish divergences spotted across 5 key indicators:
🔹 MACD
🔹 RSI
🔹 CCI
🔹 OBV
🔹 VWMA + MACD Combo
📍Price currently reacting from the 103K discount zone
🎯 Targeting 104570 my equilibrium zone
Setup looks clean. Let’s see if bulls take control 🐂📈
#BTC #SmartMoney #CryptoSetup

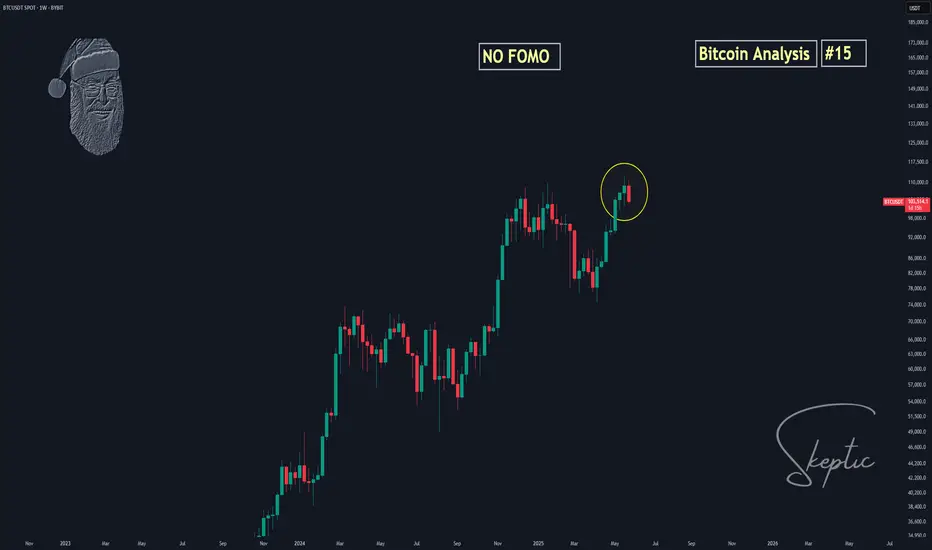
Skeptic | Bitcoin Weekly Recap #15 Bull Run On? Altcoin Next?Hey everyone, Skeptic here! Bitcoin’s been throwing curveballs this past week—did it leave you spinning? 😵 Still unsure if the bull run’s officially on, or hunting for the perfect altcoin entry? Don’t worry, in this recap, I’m laying it all out with clear reasoning to give you a crystal-clear view of the market and help you ditch those FOMO-driven decisions. Here at Skeptic Lab , we analyze Markets with one motto: No FOMO. No hype. Just reason. We’re not like others who panic over dumps or hype every pump—we’ve got risk management , stop losses , and we stay glued to the market’s pulse. Let’s dive into the Bitcoin Weekly Recap and unpack it all! 📊
Monthly Timeframe: The Big Picture
Let’s zoom out to the last three months. The 74,000 to 82,000 range has been a rock-solid support zone for Bitcoin, with heavy shadows every time we touch it. Big shadows like that scream potential trend reversal, and right now, Bitcoin’s major trend is firmly uptrend. Until we see a clear signal for a trend change, all that noise about Bitcoin crashing to 50K or “the bull run’s over” is pure nonsense. If you hear anyone making those bold future price predictions, run the other way! Our job isn’t to predict the future—it’s to map out scenarios and have a plan when they play out. Comparing the 2022 bear market to now is flat-out silly. Why? Back then, we’d already seen massive gains, but now, we haven’t had significant growth yet—altcoins are quiet, and total market volume hasn’t spiked. The end of a trend isn’t when everyone’s scared of losses; it’s when everyone’s dreaming of becoming a millionaire and the news is pumping FOMO. 😄 So, ignore those baseless analyses and let’s get to the real stuff.
Weekly Timeframe: Momentum Check
On the weekly chart, we kicked off a solid uptrend momentum, even hitting a new all-time high. Bears tried to jump in and sell, but here’s the catch: the previous ceiling hasn’t been technically broken yet, so we haven’t gotten a clear buy signal. Why? Because support and resistance levels aren’t static—they shift over time. The longer time passes, the higher or lower these levels move, and they need updating. Right now, we got rejected after testing the ceiling because our true resistance is still intact. So, when do we get confirmation? Let’s drop to the Daily Timeframe for clarity.
Daily Timeframe: Spot Trigger
After breaking 112,000 , we’ll get the main confirmation that the last ceiling before the correction is broken, signaling the continuation of the major uptrend per Dow Theory. That’s our spot buy trigger—buy above 112,000 with a stop loss below 100,000 , giving you a 10% stop loss size. Please, manage your capital so that if you hit the stop loss, you lose no more than 3% of your total capital. Staying alive in financial markets hinges on risk management. Now, let’s hit the 4-Hour Timeframe for long and short triggers.
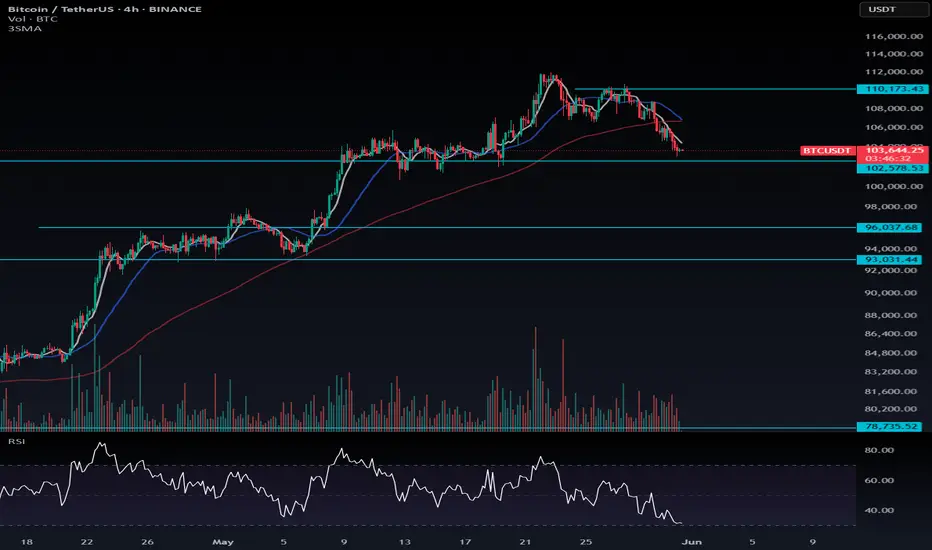
4-Hour Timeframe: Long & Short Setups
We had a solid upward trendline on the 4-hour chart, but it broke to the downside. When this happens, two scenarios are possible: either the uptrend’s slope has just softened with no trend change, or we’re entering a correction. My take? We’re likely heading for a time-based correction (think range-bound boxes). If we start ranging, don’t beat yourself up or pile into trades impulsively—win rates for most traders tank in range phases, and losing streaks pile up. For long positions, I suggest waiting for a break above 108,900 . That’s where we got a strong rejection and pullback last time, so we need solid confirmation to go long since bearish momentum is stronger in this phase. For shorts, 105,000 was a good level, but the next short trigger is a break below support at 101,577 . If we see a strong reaction at any level on this timeframe before that, you could short on a break there too. For breakout confirmation, indicators like SMA or RSI work, but volume is king. High volume on a break means it’s likely to continue; low volume screams fake breakout, so cut your risk there.
Bitcoin Dominance (BTC.D): Altcoin Timing
Let’s wrap up with a quick look at BTC.D to figure out if it’s time to jump into altcoins. BTC.D shows Bitcoin’s share of the total crypto market cap—the higher it is, the more liquidity flows into Bitcoin, often from altcoin sales. On the daily chart, we’re still above an upward trendline I mentioned in previous analyses, and altcoins haven’t made any real moves. When I say “moves,” I mean serious 100-500% or even 10,000% rallies , not just 10-20% pops. An altseason would be confirmed by a break of this trendline and a drop below support at 60.27. That’s when we’d expect massive altcoin gains, but it only works if Bitcoin’s already in a strong uptrend with solid market liquidity. Otherwise, don’t expect crazy altcoin pumps. The total market cap needs to be growing too for this to happen.
💬 Let’s Talk!
If this recap sparked some ideas, give it a quick boost—it means a lot! 😊 Got a pair or setup you want me to tackle next? Drop it in the comments. Thanks for joining me at Skeptic Lab—let’s grow together with No FOMO. No hype. Just reason. Keep trading smart! <3✌️
BTC HTD Demand zones for longBTH HTF Demand Zone are marked,
when price hit these levels you can take long if you want,
trading is risky, Do-your-own-research, Follow risk management

BTC///SHORT/// Risk to reward Unusual, do not copyHello. This is trade that i take on prop firm account with around 10 to 1 risk to reward. Do not copy this trade.

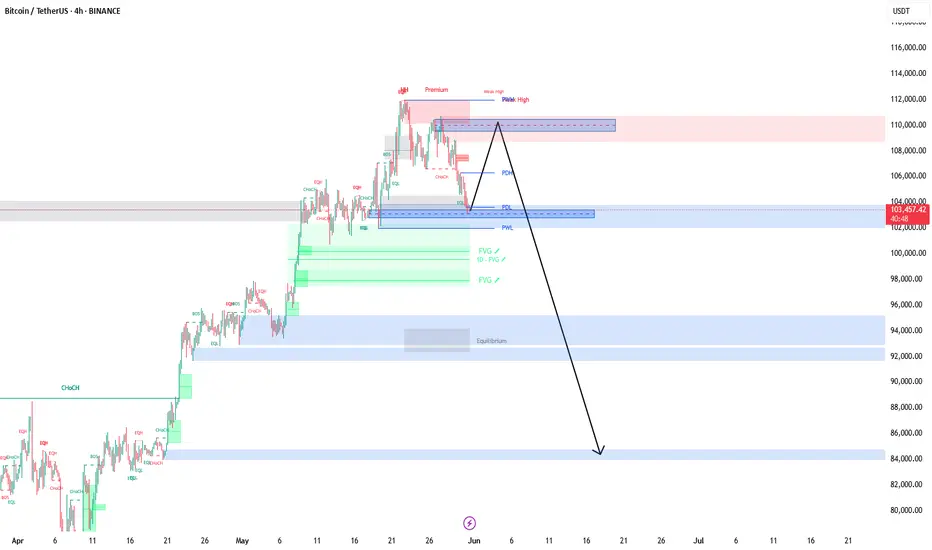
Bitcoin Price Correction or Crash?📉Here's What Traders Should Know
Amid recent market fluctuations, it's important not to fall for fear-based narratives. What we’re experiencing is not a market crash, but rather a technical correction within the ongoing bullish cycle.
🔍 Key Insight:
This correction may extend toward the $96,000 to $93,000 price zone, aligning with key support areas and potential Fibonacci retracement levels. There's currently no significant cause for concern, as this movement appears to be part of a healthy market structure.
💡 Pro Tip for Traders:
Stay calm and avoid emotional decisions. Focus your attention on identifying high-conviction long setups when market conditions become favorable again.
📊 Strategy Tip:
Use this consolidation phase to reassess your risk management, refine your trade setups, and get ready to act when bullish confirmation signals emerge. Volatility often sets the stage for the next major move — preparation is key.
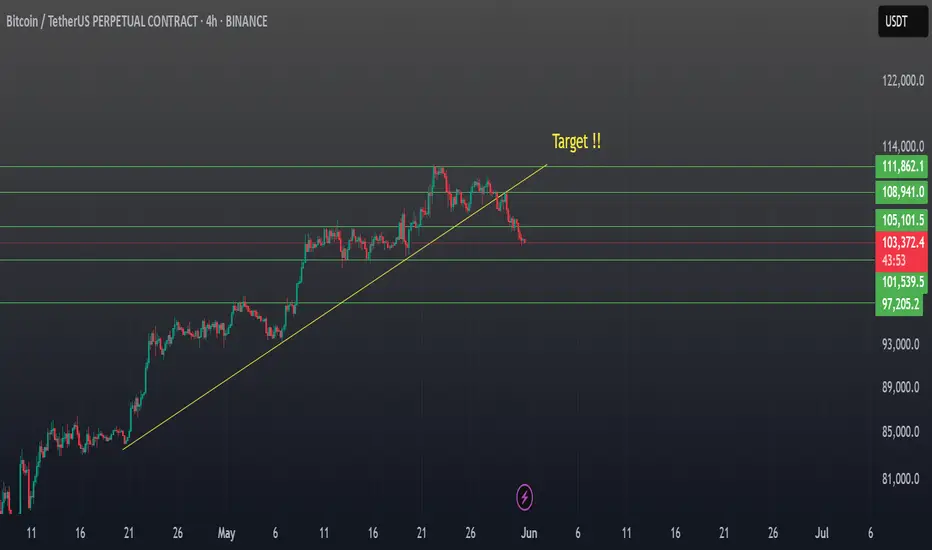
The time has come for #Bitcoin's highest flight.After hitting the user stops, now it's time for Bitcoin to gain strength and reach its true value. The last lag, in my opinion, should be much larger than lags 1 and 2. Everything I predicted so far has come true. If this one comes true, I'll take a training course. BINANCE:BTCUSDT 😅💚

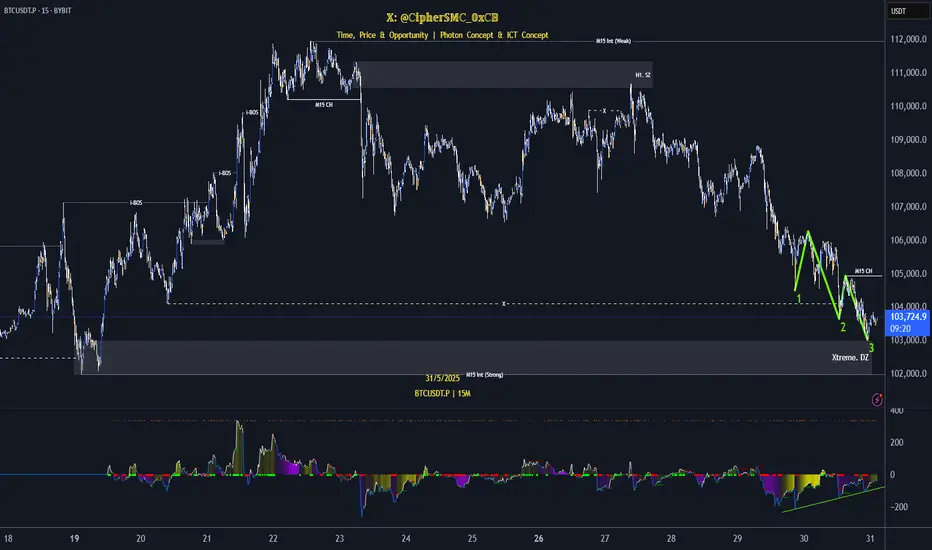
BTC is in an extreme demand zoneBTC is now at the Extreme Demand Zone on the M15 timeframe and is forming an ICT Drive Pattern. We are currently waiting for a bullish CHoCH (Change of Character) or MSS (Market Structure Shift) to confirm a bullish trend. The decline from 111,968.0 to 102,992.0 represents a pullback following the Daily Break of Structure (BOS), where the market is also hunting the final long positions, contributing to a correction. We are waiting for confirmation before opening a long position. On the other hand, when the price created a bearish CHoCH/MSS at 110,218.4 and then pulls back to that level again, I should open a short position.
langThe 109545 range has been oversold, the RSI has reached the saturation range. In my opinion, it will return to the range after the liquidity injection.

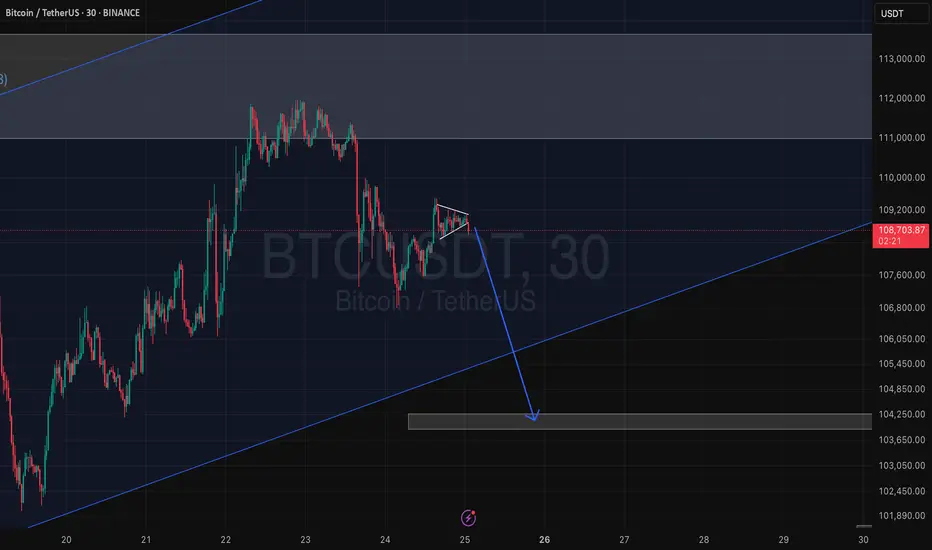
BTC Trade plan 31/05/2025Dear Trader,
The trendline has been broken — I’m waiting for an upward move before the next bearish leg.
My Final Target is around 97000 K
if you enjoyed this forecast, please show your support with a like and comment. Your feedback is what drives me to keep creating valuable content."
Regards,
Alireza!

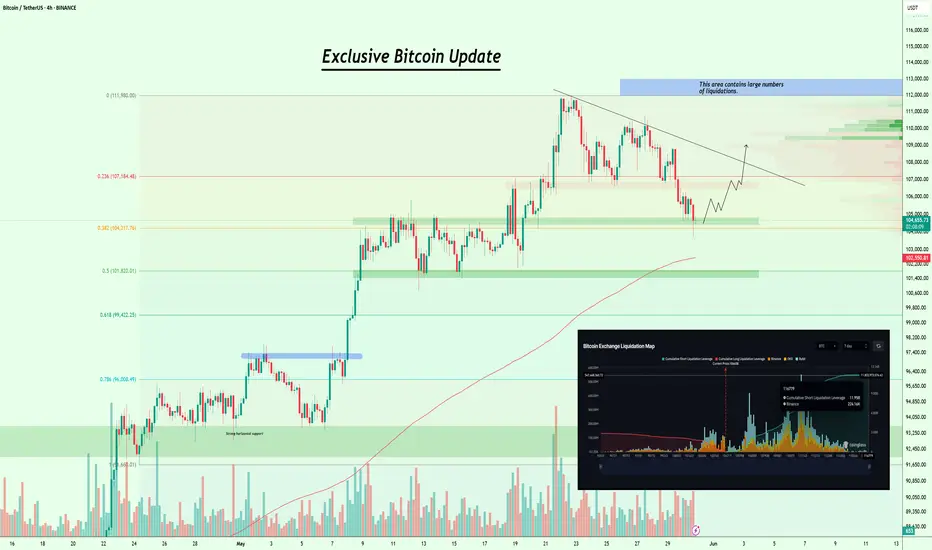
Bitcoin Correction or Trap? Watch This Support Zone CloselyExclusive #Bitcoin Update
I got lots of DMs, people are asking:
Do you think the bull trend is finished, or is it just a correction and pullback?
Guys, first stop panicking.
This is exactly what the shark wants you to do. Don’t let them shake you out.
Let’s get to the chart:
My previous chart got invalidated, and the current situation is that CRYPTOCAP:BTC is defending strongly around the $104.8K to $104.3K support zone.
According to the FIB level, we’re currently at the 0.383 level. This area has previously served as strong resistance, so it can now function as effective support.
If bulls manage to bounce from this area and push above $107K, we could trigger a sharp move toward the $112K–$113K liquidation zone,
where we have almost $12B in short liquidations acting as a strong magnet!
Let's talk about the worst-case scenario, in case we break down below this supportive area, then we have
200 EMA and a strong support around $101.4k to $101.8k.
I’ll keep you posted as things unfold. If you find my updates helpful, don’t forget to like and follow for more! #Bitcoin2025
CRYPTOCAP:BTC BITSTAMP:BTCUSD BINANCE:BTCUSDT
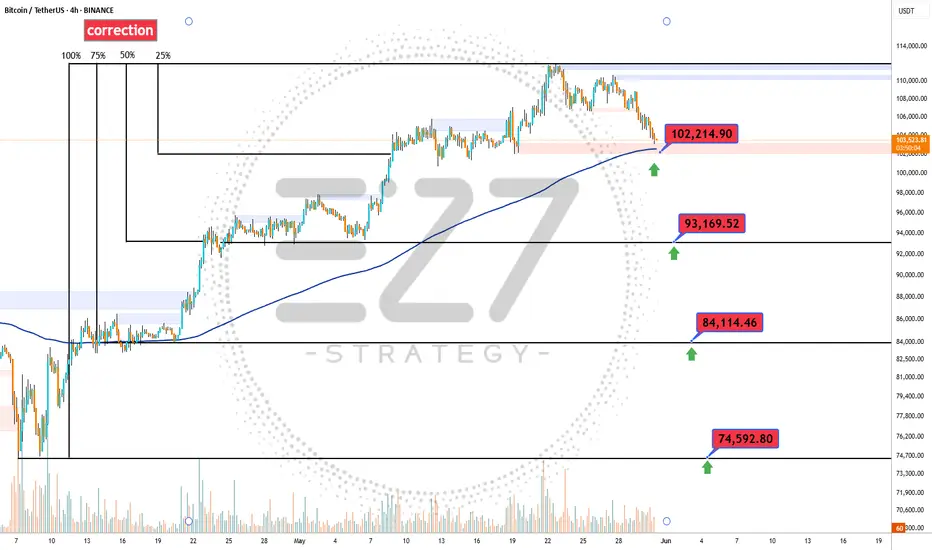
BTC Correction's 📉 Significant Bitcoin Correction During Uptrend
After a strong bullish rally, Bitcoin has entered a correction phase, retracing nearly 25% of its recent gains. Interestingly, this correction aligns exactly with the 200-period moving average on the 4-hour chart, marking a potential key support level.
🔍 Is Bitcoin’s Correction Over or Just Beginning?
The overlap with the 200 MA could signal the end of the correction, but if this zone fails to hold, deeper targets between the 35% and 75% retracement levels may come into play.
🛡️ Potential Support Levels for Bitcoin if the Correction Continues:
First support: 102,200 USD – 25% correction
Second support: 93,200 USD – 35% correction
Third support: 84,100 USD – 50% correction
Fourth support: 74,600 USD – 75% correction