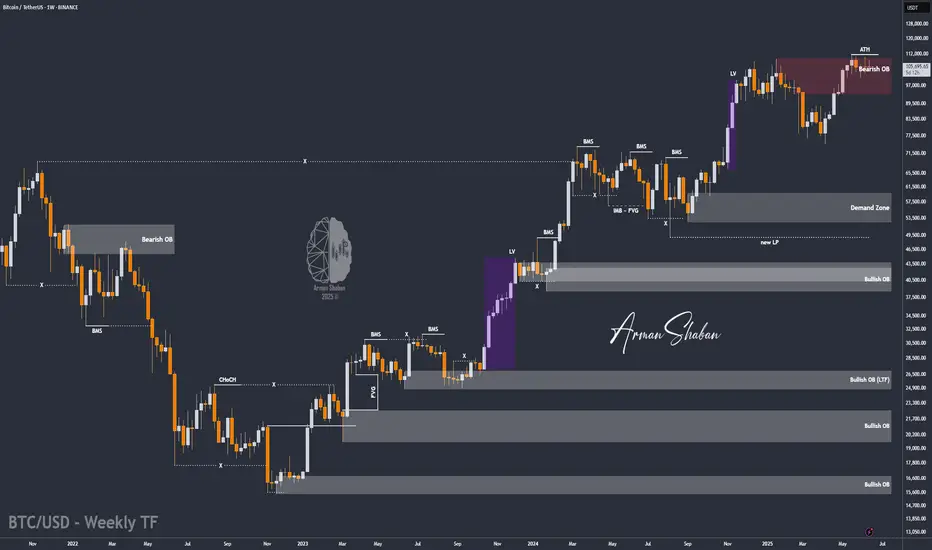
BTC Dips After ATH – $100K Support in Focus Amid TensionsBy analyzing the #Bitcoin chart on the weekly timeframe, we can see that after rallying to $111,980 and printing a new all-time high, price faced a correction down to $100,000.
Currently, Bitcoin is trading around $105,700, and with geopolitical tensions escalating, particularly the risk of war, we could see further downside — potentially taking price as low as $90,000.
However, if BTC manages to hold above the $100,000 level, there’s a strong chance we’ll see a short-term rally toward $120,000.
This analysis will be updated as the situation evolves. Stay tuned!
Please support me with your likes and comments to motivate me to share more analysis with you and share your opinion about the possible trend of this chart with me !
Best Regards , Arman Shaban
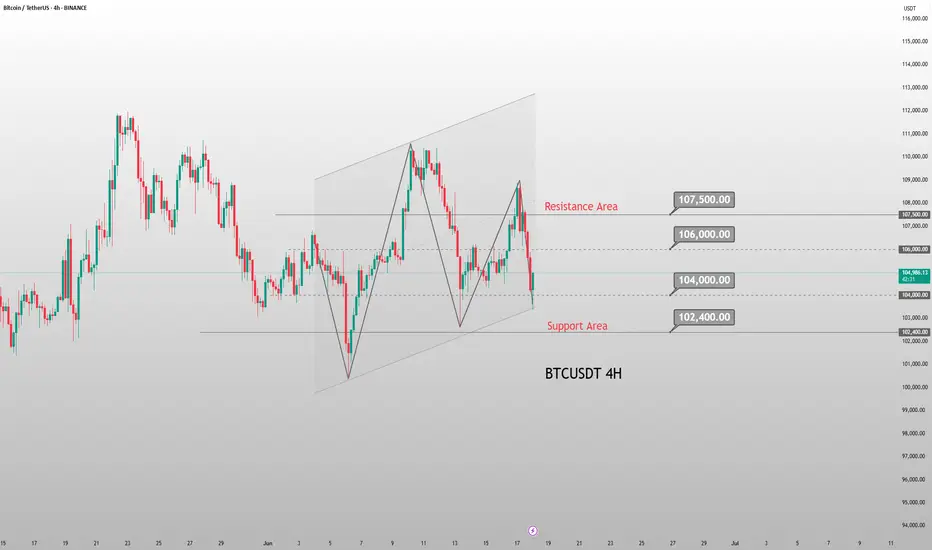
BTCUSDT.3S trade ideas
Check for support near 104463.99-106133.74
Hello, traders.
Please "Follow" to get the latest information quickly.
Have a nice day today.
-------------------------------------
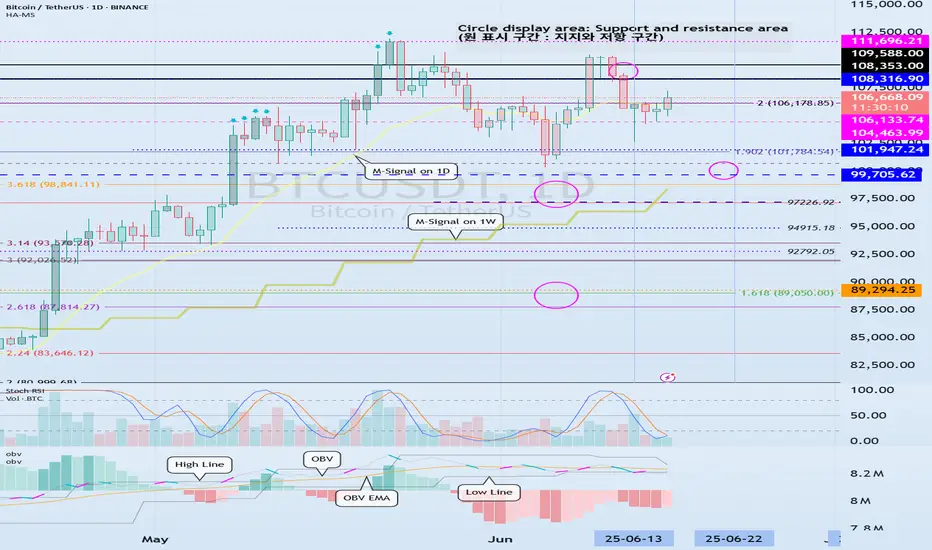
(BTCUSDT 1D chart)
The next volatility period we should pay attention to is around June 22nd (June 21-23).
Currently, the HA-High indicator of the 1D chart is formed at 108316.90, so the key is whether it can rise above that point and maintain the price.
If not, there is a possibility that it will touch the M-Signal indicator of the 1W chart.
In other words, we need to check whether there is support near 99705.62.
However, we need to check whether there is support near 104463.99-106133.74.
-
If we look at the auxiliary indicator OBV, the High Line is showing a downward trend.
This means that the high point is getting lower.
Therefore, if it rises above 108316.90 this time, we need to check whether the OBV can rise above the High Line and maintain it.
-
DOM(60), DOM(-60) indicators are displayed by the Close value.
HA-Low, HA-High indicators are displayed by the (Open + High + Low + Close) / 4 value.
Therefore, HA-Low and HA-High indicators represent the middle value, and DOM(60) and DOM(-60) represent the end point value.
This makes it difficult to trade when DOM(60) and DOM(-60) indicators are generated.
To make this clearer, I added an arrow signal.
DOM(60) indicator and HA-High indicator are indicators that represent high points.
In other words, the generation of DOM(60) indicator and HA-High indicator means that there has been a decline in the high point range.
However, as I mentioned earlier, the DOM(60) indicator is not easy to respond to because it indicates the end point, but the HA-High indicator indicates the middle value, so there is time to check whether there is support near the HA-High indicator and respond accordingly.
Therefore, you should check whether there is support in the section between the HA-High indicator and the DOM(60) indicator and respond accordingly.
On the contrary, the DOM(-60) indicator and the HA-Low indicator are indicators that indicate the low point.
You can think of it as the opposite of what I explained above.
-
By not indicating the support and resistance points according to the arrangement of the candles, but using the indicator points as the support and resistance points, anyone can see how the support and resistance points were created.
This will provide important objective information for trading.
-
Thank you for reading to the end.
I wish you successful trading.
--------------------------------------------------
- This is an explanation of the big picture.
(3-year bull market, 1-year bear market pattern)
I will explain more details when the bear market starts.
------------------------------------------------------
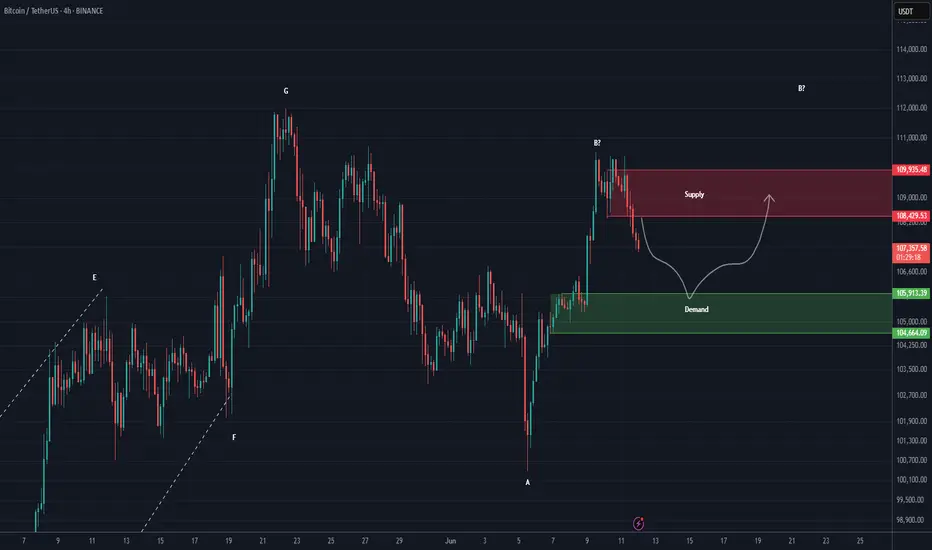
Bitcoin Long Setup: Two Potential Entry Zones After The DropHello, traders! As predicted, Bitcoin is perfectly following Scenario #2 from my previous analysis.
📉 What Happened?
The instrument showed a fake rally, luring impatient traders into premature long positions, only to liquidate them with a sharp downward move. The primary Point of Interest (POI) remains below us — this is where the "whale" aims to deliver the price to fill their orders and close the shorts they used for the initial SSL manipulation.
My Trading Scenarios & Entry Plan
1️⃣ Scenario 1: Mitigation of the Primary POI
My expectation remains the same: a reaction upon the mitigation of the 4h order block , which aligns with the 78.6% Fibonacci level.
Entry Condition: The level must hold on at least the 4H timeframe, confirmed by a bullish reversal and an order flow shift on the Lower Timeframe (LTF).
Zone: $102,745 - $103,868
Invalidation: A clear break and close below the 78.6% Fib level would invalidate this scenario.
2️⃣ Scenario 2: Deeper Liquidity Grab
If the liquidity at the 4h OB isn't enough for the whale to continue the uptrend, they might trigger a more aggressive decline to grab liquidity from the low at $100,370.
Entry Condition: A swift sweep of this low, followed by a sharp reclaim of the level and the beginning of a bullish order flow on the LTF.
Zone: $100,700 - $102,000
Invalidation: A candle close below the $100,370 liquidity level would invalidate this scenario.
Final Thoughts
Do not open positions just because the price has reached a POI. Wait for a clear reversal reaction and LTF confirmation for more conservative and safer entries. Always use stop-losses to protect your capital; no setup has a 100% win rate, and for every whale, there can always be a bigger one.
To be consistently profitable, you just need to find setups with a win rate greater than 50% — this is how casinos and professional traders operate.
Happy hunting with the whales — don't be the plankton. Follow their tracks.

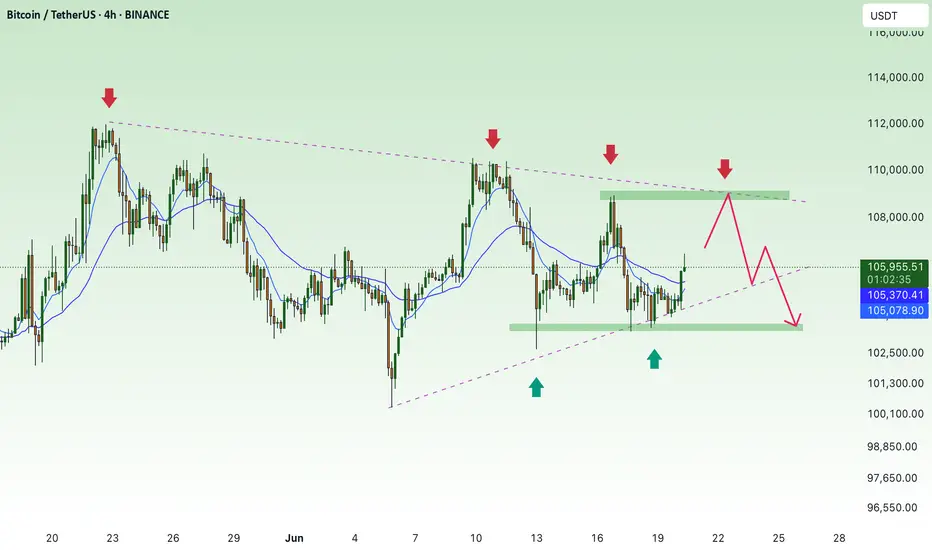
BTC ANALYSIS (4H)Last week, Bitcoin made a sharp bullish move upward, aiming for retail liquidity, which made the forecast path more difficult.
The green zone is a support area where Bitcoin might react.
To collect the ATH liquidity, Bitcoin needs to break through the red zone.
Let’s see what happens | when the market direction isn’t clear, there’s no need to take unnecessary risks.
For risk management, please don't forget stop loss and capital management
Comment if you have any questions
Thank You
Bitcoin in Mid-Term Uptrend, But Consolidating in Short-Term Ran📊 Bitcoin in Mid-Term Uptrend, But Consolidating in Short-Term Range
Bitcoin remains in a mid- and long-term uptrend, clearly shown by the white trendline on the chart. However, in the short-term, the price is consolidating inside a sideways range (highlighted in red).
If price bounces from current levels and starts pushing upward, it would confirm a higher low above the range support at $101,429, which increases the probability of an upside breakout. Otherwise, we could see another test of the range bottom.
The levels at $103,884 (support) and $106,258 (resistance) are not particularly strong, but can still be used for aggressive pre-breakout trades. Personally, I won’t enter trades at these levels just yet — I’d like to see more interaction and confirmation.
⚠️ Note:
Breakouts from this range are likely to be sharp and impulsive, regardless of direction.
For short setups, you could either wait for a breakdown of $103,884, or use a sell-stop below $101,429 — but I’m not taking shorts, as the overall trend remains bullish on higher timeframes.
On the long side, I won’t enter on a break of $106,258 unless we see a fakeout below $103,884, which would increase the probability of a successful long breakout.
BtcBtc direction is turned over in to huge sell and bear whale is active now the trading price will go to ward 99k lets keep on eye
BTC is still bearish (2H)This analysis is an update of the analysis you see in the "Related publications" section
The red zone seems to have had enough orders to reject the price downward. It is expected that the price will drop at least to the green zone below.
There will be some fluctuations along the way.
A daily candle closing above the invalidation level would invalidate this analysis.
For risk management, please don't forget stop loss and capital management
Comment if you have any questions
Thank You
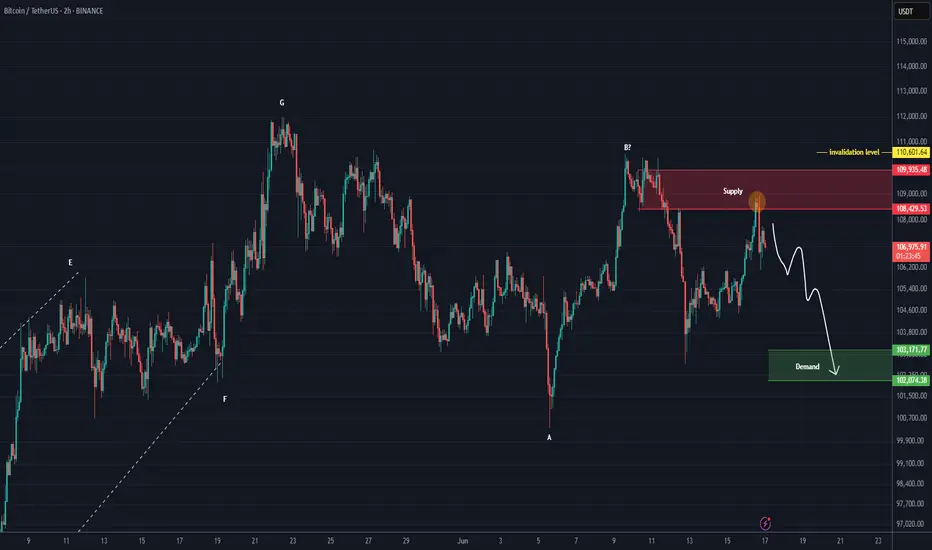
BTC: One More Leg Down?
I believe the impulse BINANCE:BTCUSDT BITSTAMP:BTCUSD BINANCE:BTCUSDT.P from April to May has been completed, and we are currently in a correction phase, which is likely to continue for some time.
In the base case, I’m considering a simple zigzag pattern:
Wave A – impulsive move down
Wave B – forming a symmetrical triangle
Wave C – expected next
🎯 Target zone: 97,500, where we have a confluence of weekly FVG, 20-week MA, and vWAP.

Bitcoin Breaks 20-Jan 2025 Peak Price, New ATH Next (+Altcoins)Look at this, Bitcoin closed the day exactly above the 20-Jan 2025 high. This day Bitcoin peaked at $110,265, the all-time high before May; yesterday, 9-June 2025, Bitcoin peaked at $110,577.4 but closed at $110,270, five dollars higher. Is this a bearish or bullish signal? What to expect!
Good evening my fellow Cryptocurrency trader, I hope you are having a wonderful day.
This week starts with a bang, a big bang, with Bitcoin doing great. The question immediately arises and I will answer, Will Bitcoin continue growing? Or, will Bitcoin produce a retrace?
I can tell you with 100% certainty that Bitcoin will continue to grow. I can support this statement with data from the charts.
We have hundreds and hundreds of altcoins going bullish, strongly bullish, some coming out of a new all-time low. If Bitcoin was set to crash, these altcoins wouldn't be gaining in bullish momentum, they would be diving deep much lower in order to create new lows. But this isn't what is happening this week, last week and today, no! What we are seeing now is huge growth across the altcoins market and this confirms what Bitcoin will do next.
Needless to say, as Bitcoin trades near its all-time high this is extremely bullish.
If a new all-time high is hit but the action moves lower, say 10-15% lower and remains there, this is bearish and points to lower prices. If the action remains very close to resistance, as it is now, this is ultra-bullish. It is simple do you agree?
Because when there is an incoming drop many people in the know start to sell, so the action never stays at resistance there is always a strong rejection with high bearish volume.
On the other hand, when resistance is challenged and continues to be hit over and over, or the action stays very close, it simply means that people are buying, holding and ready for growth. Bitcoin will continue moving higher mark my words. It is very easy because this has been confirmed long ago.
The bottom was hit 7-April and we are now experiencing long-term growth. As Bitcoin continues to trade near its all-time high, the altcoins will blow up.
When Bitcoin grows 20-30%, some altcoins can grow 100-200%. When Bitcoin grows 50%, some altcoins can grow 300-500%. This is the 2025 bull market.
Thank you for reading.
Give me a boost if you trade and profits from the altcoins market.
Namaste.
P.S. Leave a comment with your favorite altcoins, I will consider the pair for a few full analysis.

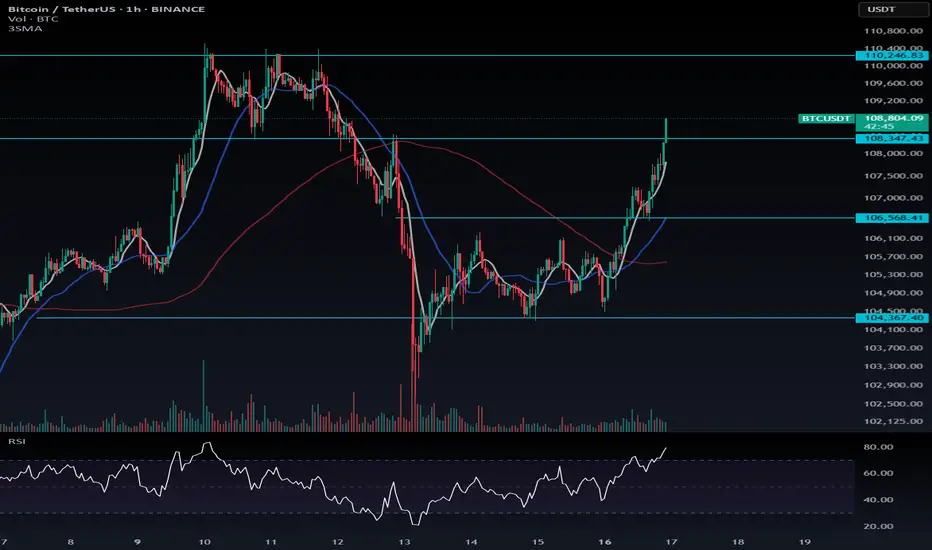
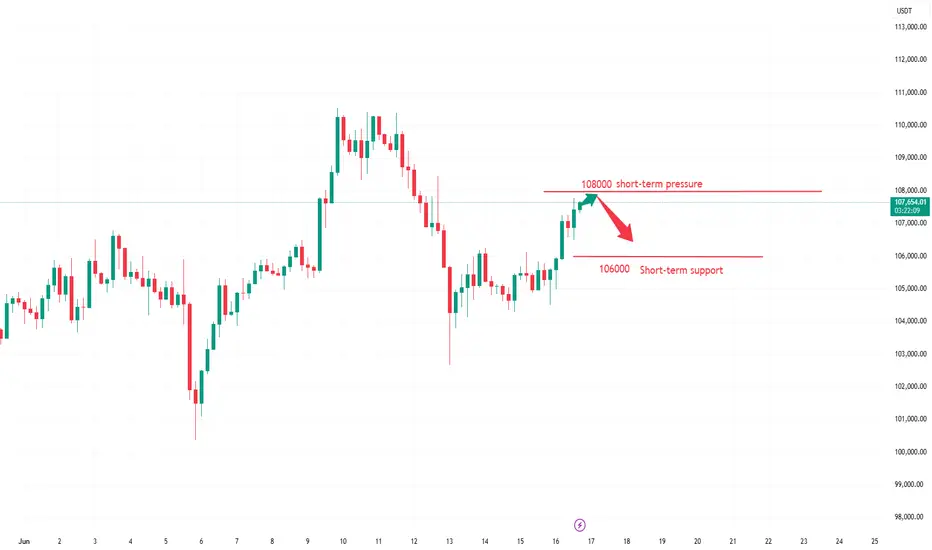
BTC Rally in Play — Time to Lock In Profits and Wait for FOMC?📈 Bitcoin Rally in Play — Time to Lock In Profits and Wait for FOMC?
After the expected upward move, I believe now is a good time to either close your positions or secure partial profits, whether you're in Bitcoin or altcoins. The market will offer new opportunities, so there’s no rush.
With the upcoming FOMC meeting on Wednesday, I suggest holding off on new entries until the news is out and volatility settles.
Currently, the resistance at $108,347 isn’t confirmed as valid yet — but if we see a rejection from that level, it could become a short-term barrier. On the downside, to maintain this recent bullish momentum, the support at $106,568 must hold.
---
💬 How are you managing your trades ahead of the FOMC? Took profits already or still holding? Drop a comment below — always good to hear your plan!
Bitcoin Market Analysis and Future Trend ForecastThe Bitcoin market has once again become the focus of investors. The price of Bitcoin has shown a significant upward trend, successfully breaking through the key resistance level of $106,000 per coin with an intraday increase of over 2%, demonstrating the strong vitality of the market. This price movement not only reflects the warming of positive sentiment in the cryptocurrency market but also indicates the gradual recovery of investor confidence, which has become the core driving force behind Bitcoin's current rally.
Currently, the Bitcoin price is at a critical juncture. From a daily chart perspective, after reaching an intraday high of $107,265, Bitcoin failed to effectively break through the key resistance level of $108,000 and has since retracted to fluctuate around $106,940. On the 4-hour timeframe, the MACD indicator shows that the histogram remains in positive territory, but the rate of increase has slowed, suggesting a short-term weakening of bullish momentum. Meanwhile, the RSI indicator stands at around 65, approaching the overbought zone, indicating that the market faces short-term correction pressure.
you are currently struggling with losses,or are unsure which of the numerous trading strategies to follow,You have the option to join our VIP program. I will assist you and provide you with accurate trading signals, enabling you to navigate the financial markets with greater confidence and potentially achieve optimal trading results.
Trading Strategy:
sell@107500-108000
TP:106000-106500
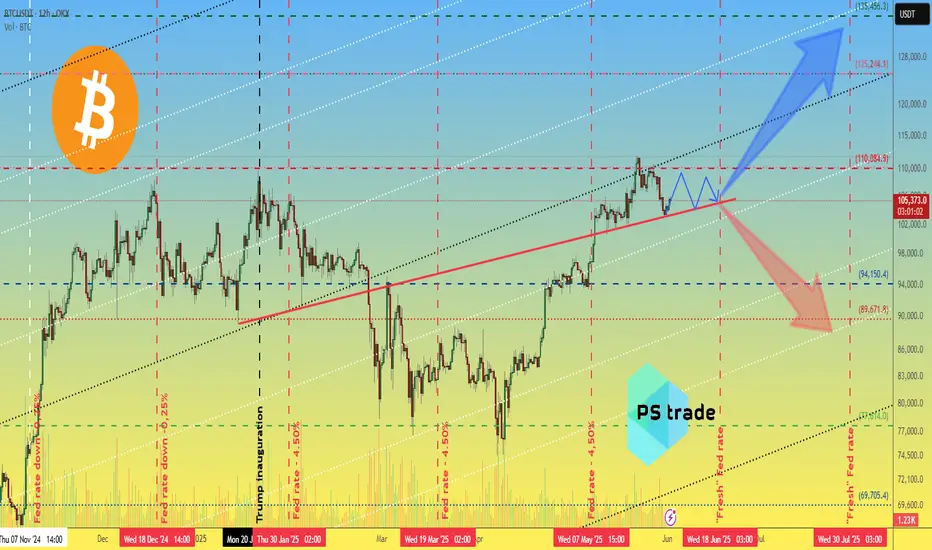
BITCOINThe Federal Reserve is likely to interpret the June 2025 University of Michigan (UoM) consumer sentiment and inflation expectations data as mixed but cautiously encouraging, with implications for monetary policy:
Key Data Points
Consumer Sentiment: 60.5 (vs. 53.5 forecast, prior 52.2) – a sharp rebound to the highest level since mid-2023.
1-Year Inflation Expectations: 5.1% (vs. 6.6% prior) – a significant decline, nearing pre-tariff levels.
Fed Interpretation
Improved Consumer Sentiment:
The jump to 60.5 signals renewed optimism about the economy, likely driven by reduced trade tensions (e.g., tariff pauses) and stable labor markets. This aligns with recent upward revisions to April and May sentiment data.
The Fed will view this as a sign of economic resilience, reducing urgency for near-term rate cuts to stimulate growth.
Sharply Lower Inflation Expectations:
The drop to 5.1% (from 6.6%) aligns with the New York Fed’s May 2025 survey showing declining inflation expectations across all horizons.
This suggests consumers are growing more confident that the Fed’s policies (and tariff adjustments) are curbing price pressures, easing fears of a wage-price spiral.
Policy Implications:
Dovish Tilt Supported: Lower inflation expectations reduce the risk of entrenched price pressures, giving the Fed flexibility to cut rates later in 2025 if growth slows.
No Immediate Cuts Likely: Strong sentiment and a resilient labor market (unemployment at 4.2%) justify maintaining rates at 4.25–4.50% in July.
Focus on Tariff Risks: The Fed will remain cautious about potential inflation rebounds from Trump’s tariffs, which could add 1.5% to prices by late 2025.
Market Reactions
DXY (Dollar Index): Likely to dip modestly as lower inflation expectations boost rate-cut bets, but sentiment-driven growth optimism may limit losses. Key support at 98.00–98.20.
Bonds: 10-year yields may edge lower (toward 4.00%) on reduced inflation fears, though strong sentiment could cap declines.
Equities: Stocks (especially consumer-discretionary sectors) may rally on improved economic outlook.
Conclusion
The Fed will likely view this data as validating its cautious stance: inflation expectations are cooling, but strong sentiment and labor markets argue against premature easing. A September rate cut remains the base case, contingent on continued disinflation and no tariff-driven price spikes. Traders should watch for June CPI (July 11) and Q2 GDP to confirm trends.
#bitcoin #dollar

Bitcoin BTC price analysis🍿 At the OKX:BTCUSDT chart, we show one of the scenarios that could play out in the first half of June.
Much will be decided today with the opening of the US market. It is very likely that there will be a downward movement at the opening in response to the new tariffs announced by Trump on Friday after the markets closed.
🕯 Well, then we'll have to “keep our fingers crossed” that market players show their strength and hold on and buy back the drop — like say: we're tired of shaking with every crazy statement from Trump.
💰 If the price of CRYPTOCAP:BTC stays above $103k, there is a chance that it will be “stuck” in the $103-110k consolidation. The market needs to digest and redistribute the results of two months of #BTCUSD price growth from $75k to $112k.
And considering the position of the BTC.D and USDT.D indices, there is a chance that the “little bit” of capital will pass to the altcoins, and they will shoot up a little.
⁉️ Probably, the safest thing to do would be to watch the altcoins and buy only those that have started a significant upward movement with volume.
What do you think?
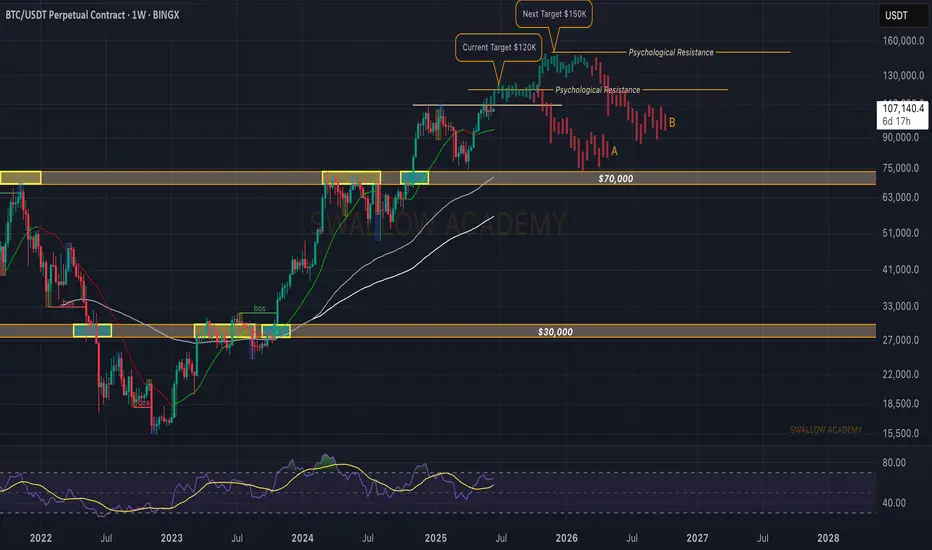
Bitcoin (BTC): Gameplan Remains Same | Bullish Start of WeekBitcoin is showing signs of recovery, where buyers are taking over the Monday lows and pushing prices to upper zones. Now that we see the recovery, we are back in play, expecting the price to reach the ATH area once again, where we will be looking then for $120K.
Swallow Academy
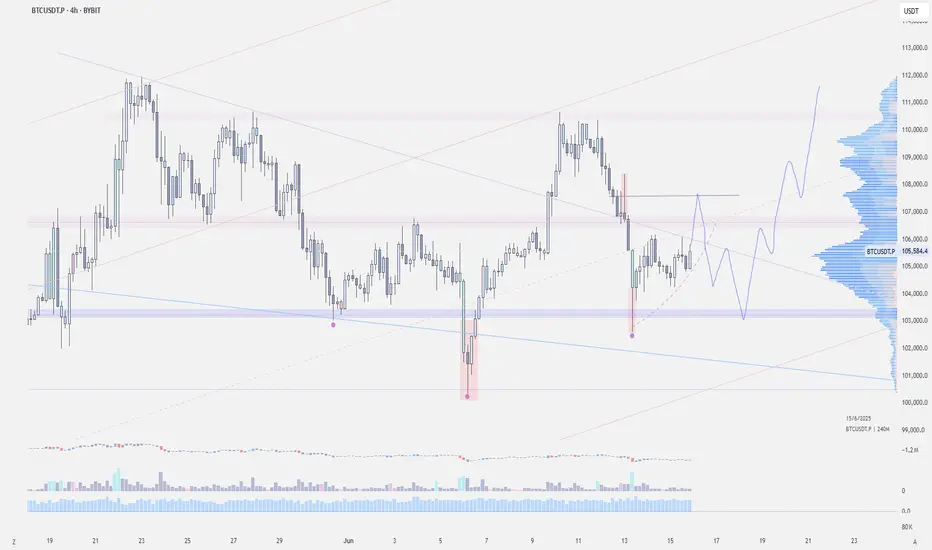
$BTC - Weekend LTF OutlookBINANCE:BTCUSDT | 4H
We've got a swing point retest here on the 4-hour timeframe.
Immediate resistance at 106k, but I'm eyeing the internal liquidity — the wicks on both sides.
Most likely it’ll fill the upper wick first (107.3k–107.8k). If we reject there again, we could sweep the lower wick around 103.5k–103k.
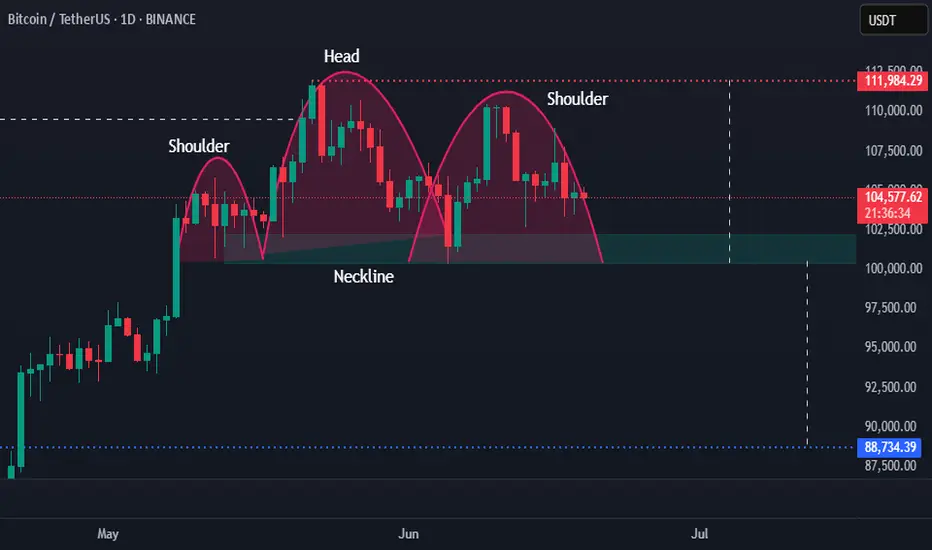
Classic H&S pattern in Daily chart of BTCHello Good Morning everyone:
Are your preapared for this classic pattern of Head and Shoulder of BTC at daily chart??
BTC ITS A TRAP Bitcoin is currently facing significant resistance at key technical levels and may be positioning for a potential sharp decline heading into Thursday, particularly as markets close and geopolitical tensions in the Middle East threaten to escalate.
Two key technical confluences support this thesis:
1. Bullish Gartley Harmonic Pattern: This setup is developing with highly precise ratio alignments, targeting a convergence at the Point of Control (POC) alongside multiple anchored VWAP levels. While the pattern typically involves a sharp decline, it often precedes a powerful reversal once liquidity is swept from the lows, making this a potentially attractive risk-reward inflection zone.
2. Failed Auction Structure: Price action has demonstrated an inability to sustain a breakout above the established fair value range, instead reverting back within the bounds of a parallel channel. This failed breakout—confirmed by a rejection at the upper end of the volume profile—suggests heightened probability of a move back toward fair value, marked in blue, which coincides with the POC and represents the market's most accepted / traded price.
We’ll observe how the setup develops from here.

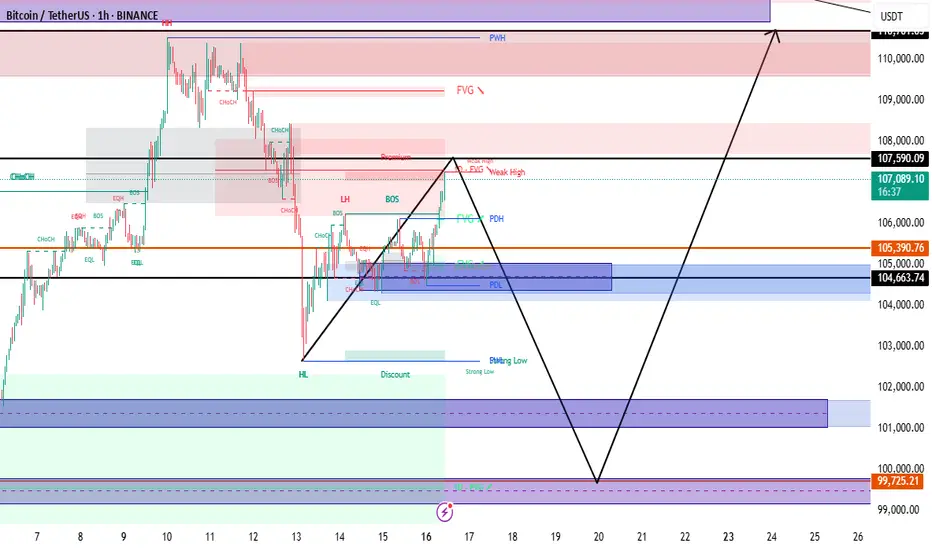
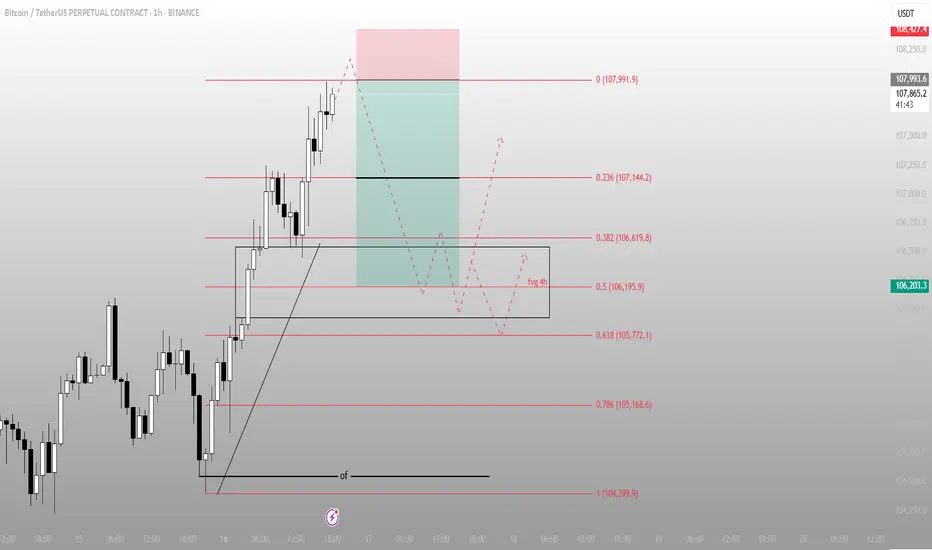
That wasn’t a breakout. That was the stop runBTC swept the high into 107,991 — precision tap of the premium fib. Now the delivery shifts. Price has already done its job: take liquidity, trigger late longs, and set up the real move.
Here’s the execution breakdown:
Price tagged the 0 level of the fib extension — 107,991 — and rejected
A clean 4H FVG sits just below around 106,195.9 (0.5), aligned with 0.382 and 0.618 fib levels (106,619.8 to 105,772.1)
This is the re-entry zone for Smart Money — not the top chasers
Expectations from here:
→ Rebalance into the 106.6–105.7k region
→ If that zone holds and price shifts structure bullish again, we retest 107.1 → 107.9 → break higher
→ If we lose 105.7 cleanly, I’m watching 104,399.9 — the deeper inefficiency magnet
This isn’t about confirmation. It’s about preparation.
More trades like this — clean, controlled, conviction-based — live in the profile description.
TradeCityPro | Bitcoin Daily Analysis #114👋 Welcome to TradeCity Pro!
Let’s go over Bitcoin analysis and the key crypto indexes. As usual, I’ll break down the futures triggers for the New York session.
⏳ 1-Hour Timeframe
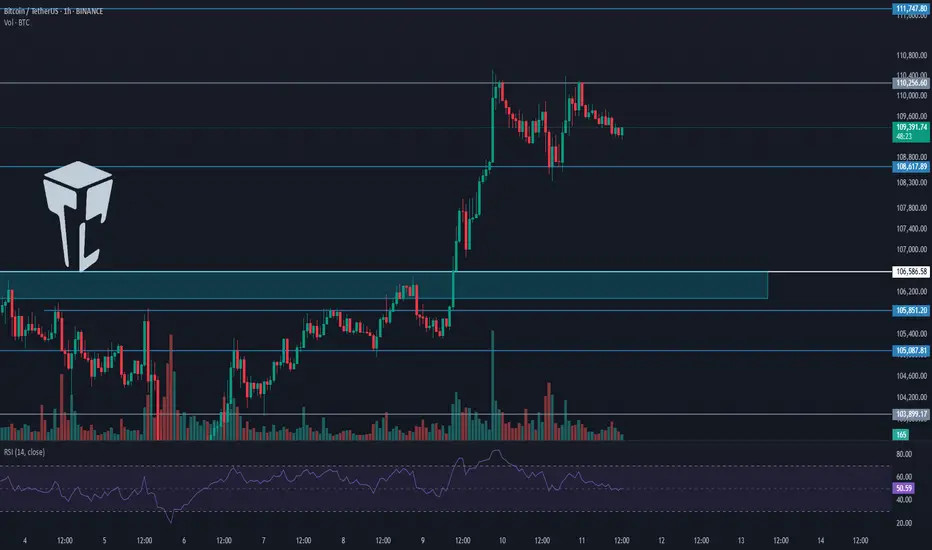
On the one hour timeframe, as you can see, a trading range has formed between the levels of 108617 and 110256. This has happened after a strong upward move with significant buying volume, and now we’re in a market correction phase.
📊 Market volume is decreasing during this corrective phase, which shows the strength of the buyers and supports the ongoing uptrend. RSI has exited the Overbuy zone and is now cooling off, which indicates that the bullish momentum has weakened for now.
📈 For a long position, the 110256 trigger seems very suitable today. If the price forms a higher low above 108617 before breaking this level, the probability of breaking 110256 increases significantly.
💥 If this trigger is activated, it’s crucial that volume rises as well. That would confirm the strength of the trend and increase the chances of the uptrend continuing. The current target for this position is 111747.
🔽 In the correction scenario, if the price stabilizes below 108617, this scenario becomes more likely and a deeper correction could follow.
✨ Personally, I won’t open a short position unless we get confirmation of a trend reversal. But if you want to go short, a break below 108617 is not a bad option and could signal a downward move.
👑 BTC.D Analysis
Bitcoin dominance has continued its downward movement, stabilized below 64.12, and is now heading toward 63.93.
⭐ If the 63.93 low is broken, the bearish move in dominance will likely continue. If it pulls back, a break above 64.12 will confirm that retracement.
📅 Total2 Analysis
Let’s look at Total2. Yesterday, it broke through the 1.2 level and is now moving toward 1.24. A breakout above this level could start the next bullish leg.
🎲 If a correction occurs, the price may drop back to 1.2 or even 1.18.
📅 USDT.D Analysis
Now for Tether dominance. This index is still sitting at the 4.56 support and is currently being held there. If 4.56 breaks, the next bearish leg can form.
🔔 In case of a retracement, USDT dominance might rise to 4.64.
❌ Disclaimer ❌
Trading futures is highly risky and dangerous. If you're not an expert, these triggers may not be suitable for you. You should first learn risk and capital management. You can also use the educational content from this channel.
Finally, these triggers reflect my personal opinions on price action, and the market may move completely against this analysis. So, do your own research before opening any position.
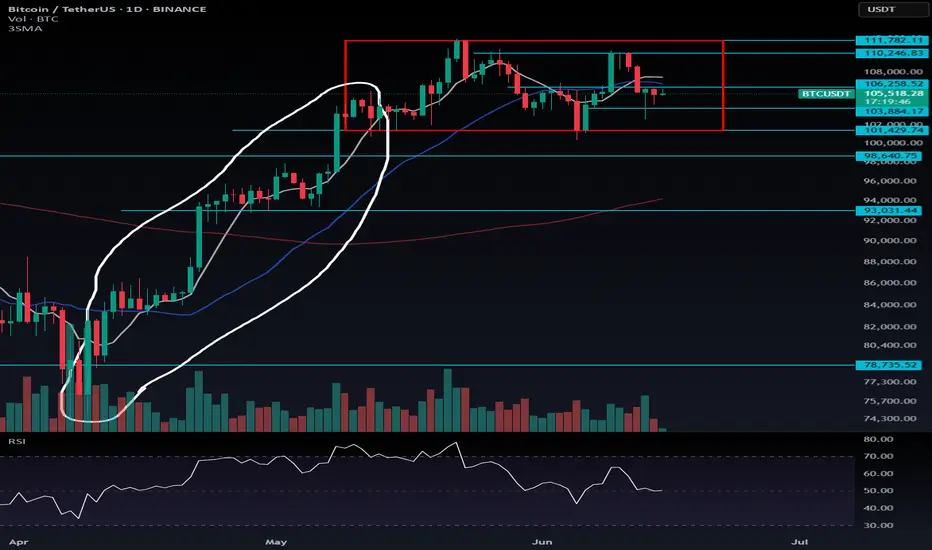
BTC Is Replaying a Bullish Fractal >>> Are You Watching?Hello guys!
I see a deja vu here! Let’s look at the historical daily chart (Jan–May 2025):
What happened?
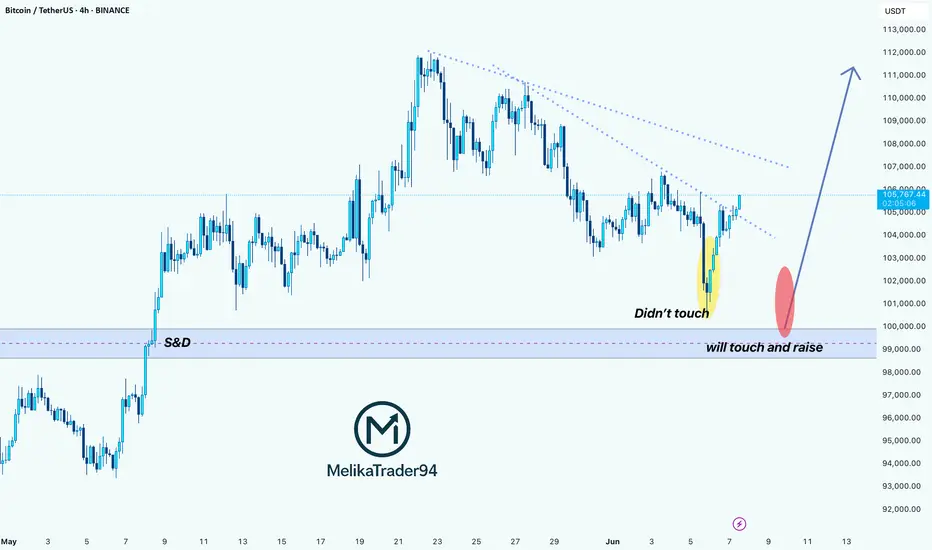
Initial Drop (Yellow Oval): Bitcoin approached a key S&D zone but didn't touch it, triggering a short-lived bounce before dropping again.
Second Drop (Red Ovals): This time, price precisely touched the demand zone, triggering a clean bullish reversal.
What followed was a strong trend breakout, sustained higher lows, and an eventual surge past prior resistance levels.
Current 4H Chart Setup: A Mirror Image?
Yellow Highlight: Once again, we saw a bounce that didn't quite touch the key demand zone ($98K–$100K).
Red Zone Prediction: If this mirrors the historical move, the price is likely to return and touch this S&D area before launching a bullish leg.
Blue Path Projection: A sharp reversal is expected post-touch, aiming toward $111K–$113K as the next key resistance zone.
The descending trendline adds confluence
___________________
History Doesn’t Repeat, But It Often Rhymes
Based on this fractal analysis, Bitcoin is likely forming the same bullish base seen earlier in 2025. The setup hinges on one key event: a return to the $99K–$100K zone, where demand is likely to step in aggressively.
If the pattern repeats, the current market may offer one last high-reward long opportunity before a parabolic rally.
Current BTC Trend Analysis and Trading RecommendationsThe daily candlestick chart of BTC shows a three - day consecutive bearish retracement, having fallen back to the vicinity of the starting point of the previous pinbar rebound and currently remaining in a recent low - level sideways consolidation zone. However, the 4 - hour trend is pressured by the middle band of the Bollinger Bands, staying within a downward channel and forming a rebound - retracement wave pattern.
For short - term strategies, anticipate a further retracement first. Long positions should be initiated only after the support level is confirmed valid. This retracement represents a necessary consolidation phase before the bullish trend continues, and the current adjustment range does not pose a substantial threat of trend reversal to the overall uptrend. With the core upward trend intact and the direction remaining clear, BTC is expected to resume its upward momentum after a brief consolidation. The operational approach remains to go long on retracements.
BTCUSD
buy@103500-104000
tp:105500-106500
Investment itself is not the source of risk; it is only when investment behavior escapes rational control that risks lie in wait. In the trading process, always bear in mind that restraining impulsiveness is the primary criterion for success. I share trading signals daily, and all signals have been accurate without error for a full month. Regardless of your past profits or losses, with my assistance, you have the hope to achieve a breakthrough in your investment.
BTC BITCOIN Bitcoin buy level on the green structure to watch will be on the 100k and my next buy watch zone will be 97-98k .
Growing institutional participation, including the launch and approval of Bitcoin ETFs is increasing liquidity and legitimizing BTC as an investment asset.
Macroeconomic Environment , Persistent low real interest rates by central banks and concerns about inflation support demand for Bitcoin as a store of value.
Geopolitical uncertainties and currency debasement fears boost Bitcoin’s appeal as a digital gold.
Bitcoin’s network security, hash rate, and active addresses remain robust, underpinning confidence in its decentralized infrastructure.
Continued development in scaling solutions and layer-2 technologies enhances usability.
Increasing regulatory clarity worldwide, including clearer frameworks for crypto exchanges and custodians, reduces uncertainty and encourages adoption.
However, regulatory risks remains a factor that can cause short-term volatility.
#bitcoin #btc

continue to move accumulation: below 109,000💎 Update Plan BTC (June 20)
Notable news about BTC:
Semler Scientific (SMLR) unveiled an ambitious three-year strategy on Thursday aimed at significantly expanding its Bitcoin holdings to 105,000 BTC by the end of 2027. The announcement coincided with the appointment of a new executive to lead the firm’s digital asset initiative.
The Nasdaq-listed healthcare firm has named Joe Burnett as its Director of Bitcoin Strategy, a move it believes will strengthen its long-term treasury vision and enhance shareholder value. As part of this strategic shift, Semler Scientific plans to accumulate Bitcoin through a mix of equity and debt financing, alongside reinvested cash flows from its core business operations.
Technical analysis angle
BTC as well as XauUSD are trapped in the channel price 104k to 110k these are also two important milestones of BTC. Also congratulations to investors when detecting the bottom of 104k. The next expectation within the price channel is still maintained at 110k landmark
But with the recent moves of investors, the community is afraid that BTC will continue to adjust in the future.
==> Comments for trend reference. Wishing investors successfully trading