How Bitcoin can impact alt coins like sol and sui This video is a very quick update on the potential for bitcoin to drop into the 96/97k region and the effect it will have on alt coins .
If you hold altcoins and you see them bleed in price then its important to know and understand whats ahead for Bitcoin .
Understanding this will help you with your entry's and your exits on all altcoins .
BTCUSDT.3S trade ideas

[SeoVereign] Bitcoin Bearish Outlook – June 17, 2025We are the SeoVereign Trading Team.
With sharp insight and precise analysis, we regularly share trading ideas on Bitcoin and other major assets—always guided by structure, sentiment, and momentum.
🔔 Follow us to never miss a market update.
🚀 Boosts provide strong motivation and drive to the SeoVereign team.
--------------------------------------------------------------------------------------------------------
Hello,
This is SeoVereign, approaching technical analysis not as a result but as a prediction, with a realistic perspective.
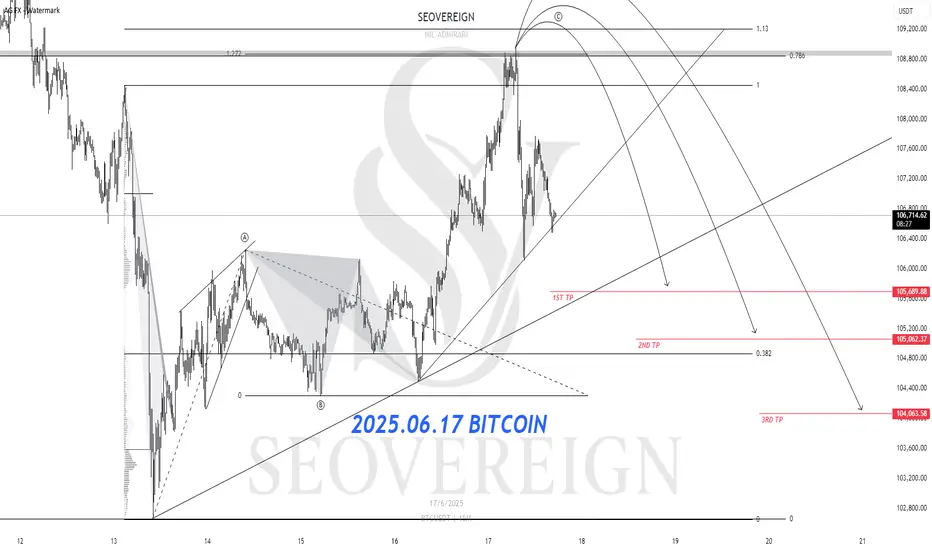
I am presenting a bearish view on Bitcoin as of June 17, 2025.
First, based on the fact that a downtrend appeared near the 0.786 level of the overall Fibonacci retracement, I believe strong downward pressure is forming, and thus I am outlining this bearish perspective.
This 0.786 level corresponds to around the 109,000 price range. On the chart, the 109,000–110,600 range is a very strong supply zone where support and resistance have repeatedly been confirmed.
Next, from a wave counting perspective, the 1.272 trend-based Fibonacci extension lies in a similar area as the 0.786 retracement level, which further reinforces my conviction in this view.
After successfully predicting the downward movement from the 11th, I have been continuously counting the recent upward wave, and the wave structure on the chart appears to align naturally, as I see it.
In addition, from a harmonic perspective, the Alt Bat pattern is functioning effectively, and since the movement has been captured within the pre-set X–1.13 range, the confirmation of this pattern can also be considered successful.
The first target is currently set around the 105,700 level.
I will continue to monitor the market closely, and once this idea progresses to a certain point, I will share more specific evidence and the thought process behind the bearish entry through an additional update.
Thank you.
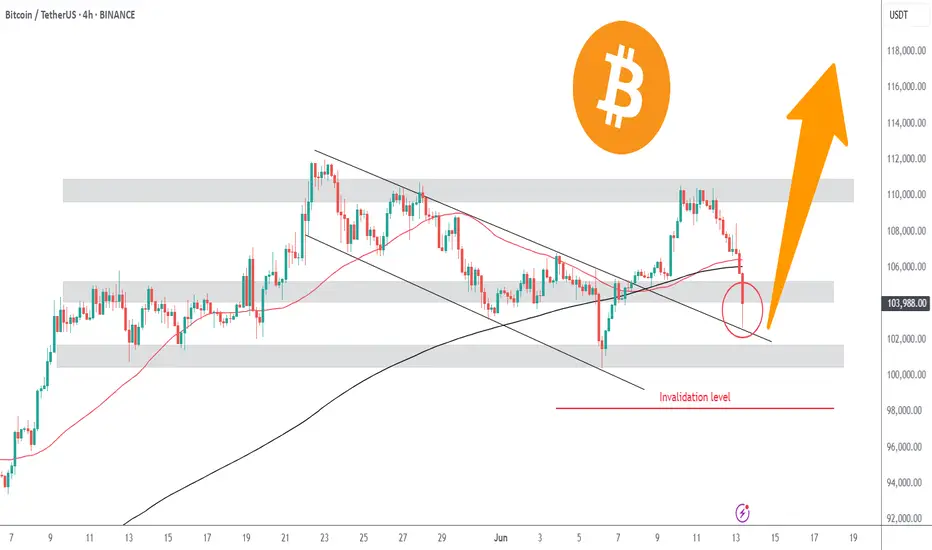
Bitcoin Retests Broken Channel | Bounce to $110k?Bitcoin is currently retesting the broken downward channel. This selloff was a market shock reaction due to Israel's airstrikes on Iran. Price found support around $103k, at the daily timeframe 50SMA. The daily 50SMA also served as support in the previous drop to $100k last week.
In the chart's red circle is likely where many long leveraged positions had their stop losses or liquidation levels. We can safely assume this event was a liquidity hunt as Bitcoin remains strong above $100k. A healthy pullback to retest.
Historically, we have seen similar market shock selloffs like this. One example is the 1st of October 2024 Iran strikes on Israel. Bitcoin crashed 5% from $63k to $60k. What followed after was a recovery to over $100k, never seeing $60k again.
Will Bitcoin recover?
We still have multiple bullish developments. Institutions are becoming increasingly interested in Bitcoin, the US Bitcoin reserve, SEC x Ripple case settlement, SOL ETF approval, Fed rate cuts, among others.
Provided that the conflict does not escalate, once the market panic reaction is over, we can expect a healthy bullish continuation, as long as Bitcoin remains above $100k.
We also have a massive pool of short liquidity above $111k. Once we break above this level it will be a short-squeeze to $120k.
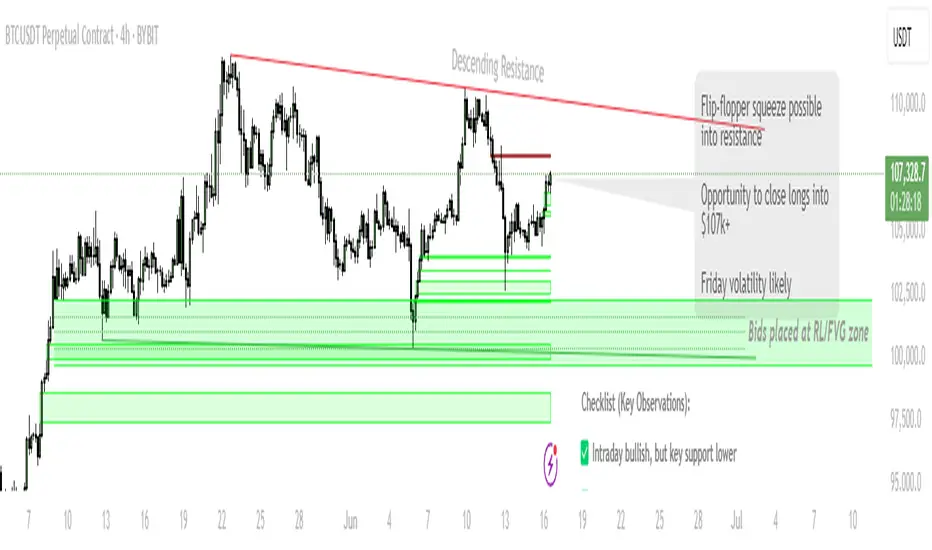
BTC Setup: Watching for a Trap — Bids Below, Flip Above!Scenario 1 (Fakeout & Reversal):
Watch for push to $107,000–$108,000 (potential bull trap)
Close longs on move into resistance zone
Look for reversal signals (SFP, strong rejection) to re-enter lower
Scenario 2 (Sweep and Bounce):
Place bids at/just below $100,272 (1D Support) and within $98,000–$100,000 (FVG)
Target: Move back toward trendline resistance ($107k+)
Stop: Below $97,200
Invalidation:
Structure flips bearish on a clean break/close below $97,200
🔔 Triggers & Confirmations:
Enter longs only on SFP or strong bounce confirmation in FVG zone
Avoid chasing if price is between $102k–$106k (“no-trade chop”)
📝 Order Placement & Management:
🔼 Buy Limits: $100,300 / $99,000 / $98,000 (staggered bids in FVG)
🛡️ Long Stop: $97,200
🎯 Target: $107,000–$109,000 (trendline resistance)
📝 Take profits on spike to $107k+
🚨 Risk Warning:
Friday volatility, news risk
Avoid new longs above $107k — watch for failed breakout/fakeout
Monday trades of the day🔥 These are the scalps I’ve got my eye on today. 🔥
Mostly looking at continuation longs — unless structure tells a different story.
💡 Key Plan:
For each long setup, I’ll wait for an internal market structure (MS) flip before pulling the trigger. No confirmation, no entry. Precision is the priority.
📅 Class Schedule:
Monddaday | After 6 PM
BTC bullish rally before the fall?I am expecting a bullish Rally to the previous high since it's a third wave of current impulse I'm expecting BUY from here to the target mentioned. Will be exciting if any reversal signs occur. (BTC should touch 140,000+ in 2 months.)
entering buy from 107400
*A fall still pending* BITSTAMP:BTCUSD
BTC/USDT – Rising Wedge Breakdown Looms Near $110K
Idea Summary:
Bitcoin is compressing in a rising wedge on 1D/4H timeframes, approaching resistance around $ 110K–$ 112K. We’re seeing bearish divergence on RSI and MACD, declining volume, and sentiment cooling—signaling a potential breakdown.
Key Confluences:
• Rising wedge pattern (bearish reversal during uptrend) with converging trendlines and falling volume
• RSI divergence: price rising, RSI flattening/declining
• Volume behavior: weaker rallies, distribution-style setup near highs
• Sentiment neutralizing: Fear & Greed Index slipped from ~74 to ~55–60
• Macro backdrop: U.S. inflation cooling, Fed pause in rate hikes → but upcoming FOMC brings volatility risk
Conclusion:
BTC is near a wedge apex with short-term bearish structure forming. A breakdown could test $ 90K–$ 75K, whereas a break above $ 112K invalidates the setup. 📉
Trigger zones:
• Breakdown < $ 105K → triggers short
• Breakout > $ 112K → stop out & pause
💬 Thoughts? Breakdown or breakout next?
Bitcoin Crash Predicted! Here are the next targets! Bitcoin is crashing as predicted, and here I am showing you the next targets, and the changes in market structure that would make me take profits earlier!
Enjoy and feel free to smash the rocket button if you feel the bearish vibe!

BTC - Where it is heading to? Owing to the recent war scenario's the market has taken a slump, seeing pattern its a bearish stance where a pull back down is emminent (means to fall down as drawn in blue) but as its retracing all the move after its fall, expecting a sweep moves to the top as mentioned. till 108k
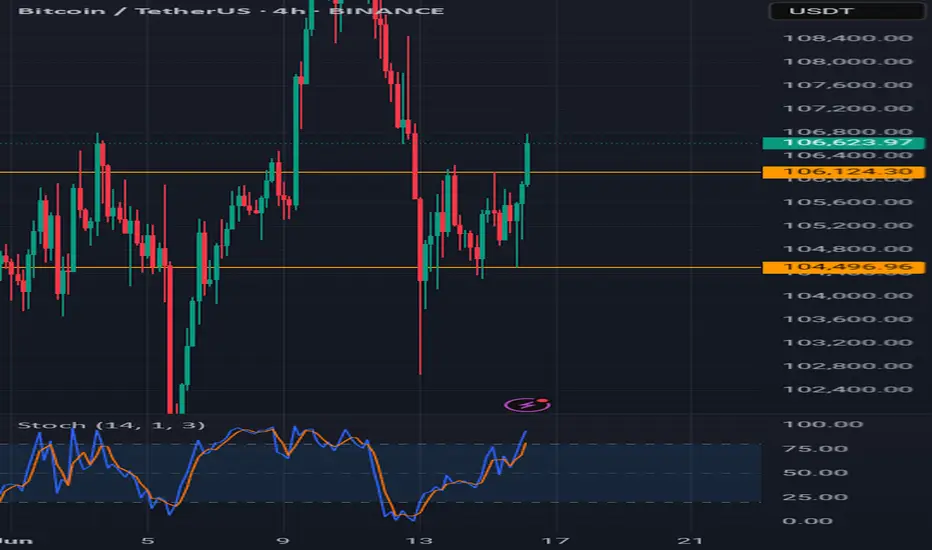
Bitcoin bullish It broke resistance 106,124.30 same will happen with Nas and Us30 as they follow Bitcoin movements
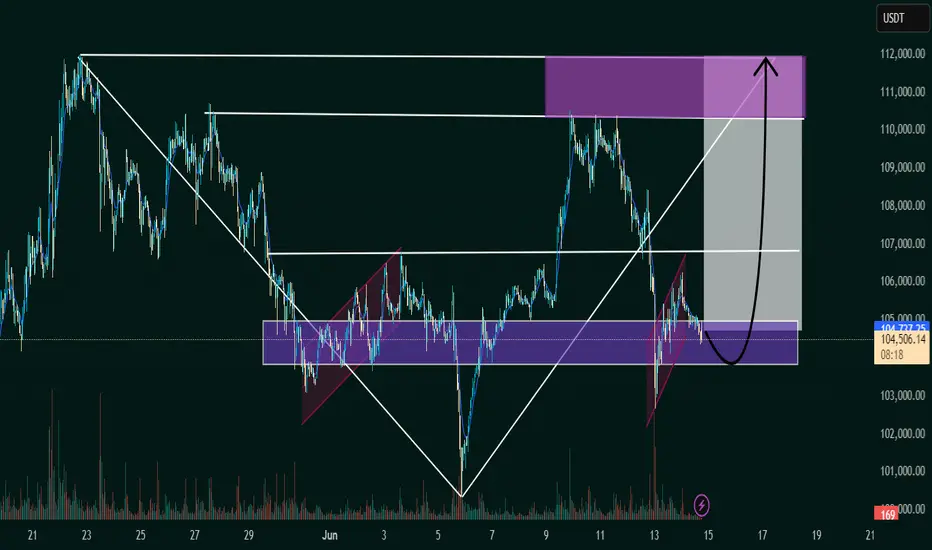
BTC/USDT Bullish Reversal Zone AnalysisSupport Zone:
The horizontal purple box (~104,000 USDT area) has acted as a strong support/resistance flip zone multiple times.
Falling Wedge Breakout:
The price action broke out of a falling wedge pattern earlier, confirming bullish momentum.
Flag Formation (Current):
A smaller bullish flag/pennant appears to be forming, and a breakout above could trigger a strong upward move.
Projected Move:
The black arrow indicates a potential bounce from this support zone, with the price targeting the 111,000–112,000 USDT zone (highlighted in the top purple box).
Volume Spike:
Notable volume spike near the bottom supports the idea of accumulation and possible reversal.
📈 Conclusion:
If the support zone holds and price breaks above the minor flag, a bullish continuation is likely toward the 111,000–112,000 resistance area. Traders should watch for confirmation of a breakout and volume increase for validation.
US entering the war,~25% drop will happen if it's gonna escalateUS about to enter the war with Iran, as long the war finish quickly with US destory Fordow nuclear site and other facilities, we can stop around 94k$ zone,
war escalating more, will engage a bigger drop in markets.
Likely they will announce it after markets close on Friday. stay updated.

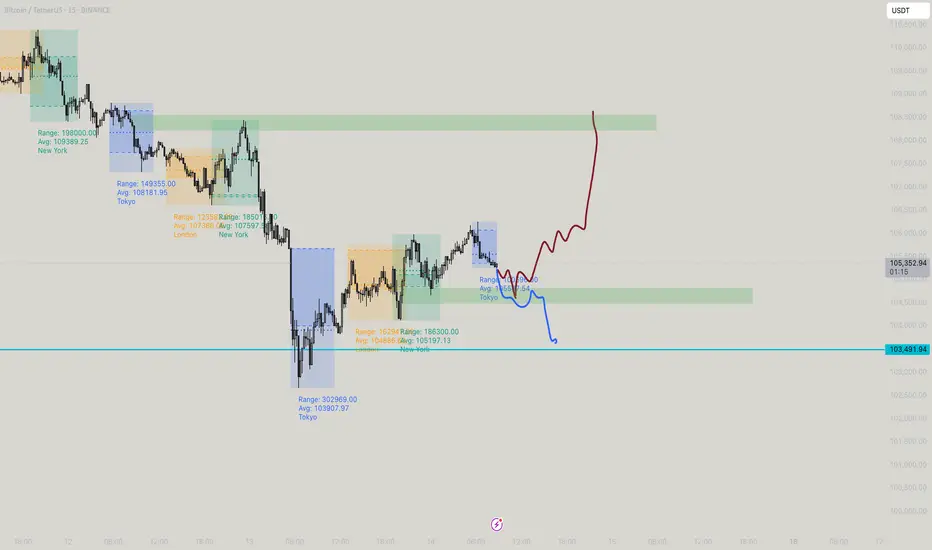
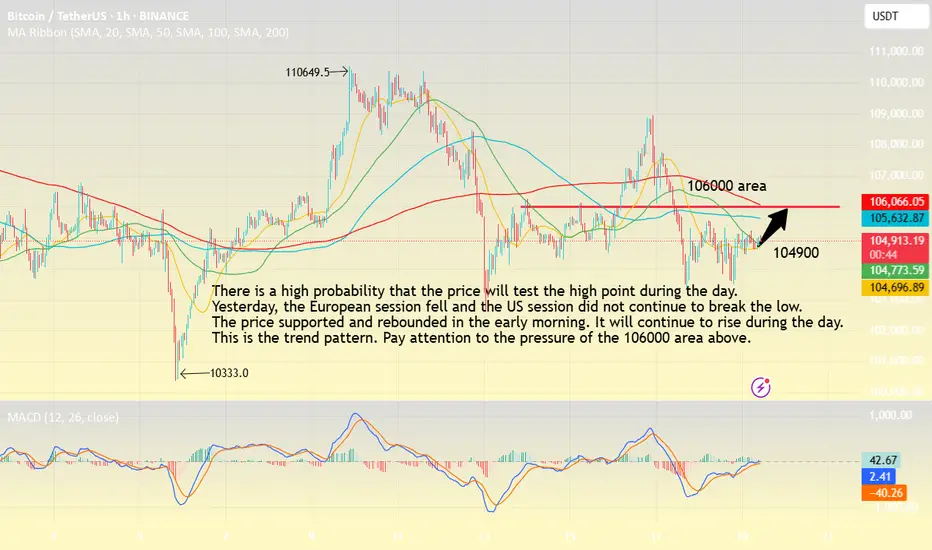
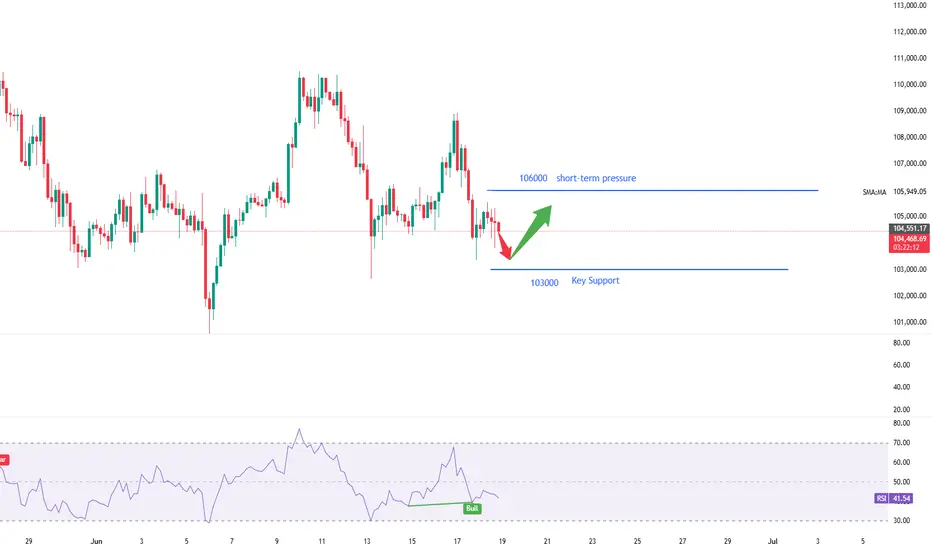
BTC-----Buy around 104900, target 106000 areaTechnical analysis of BTC contract on June 19:
Today, the large-cycle daily level closed with a small positive line yesterday, the K-line pattern was a single positive line with continuous negative lines, the price was below the moving average, and the attached indicator was dead cross. The general trend of the decline was still relatively obvious, but in trading, we should pay more attention to the rhythm of the price range in the shock, so the operation should be decisive, not greedy, and do a good job of risk control; the short-cycle hourly chart yesterday's intraday support was corrected upward, the European session fell but did not continue to break down, the price support rebounded in the early morning, the current K-line pattern was a single positive line with continuous positive lines, and the attached indicator was golden cross, so it is highly likely to break through yesterday's high of 105500 area within the day.
Today's BTC short-term contract trading strategy:
Buy at the current price of 104900 area, stop loss at 104000 area, and target 106000 area;
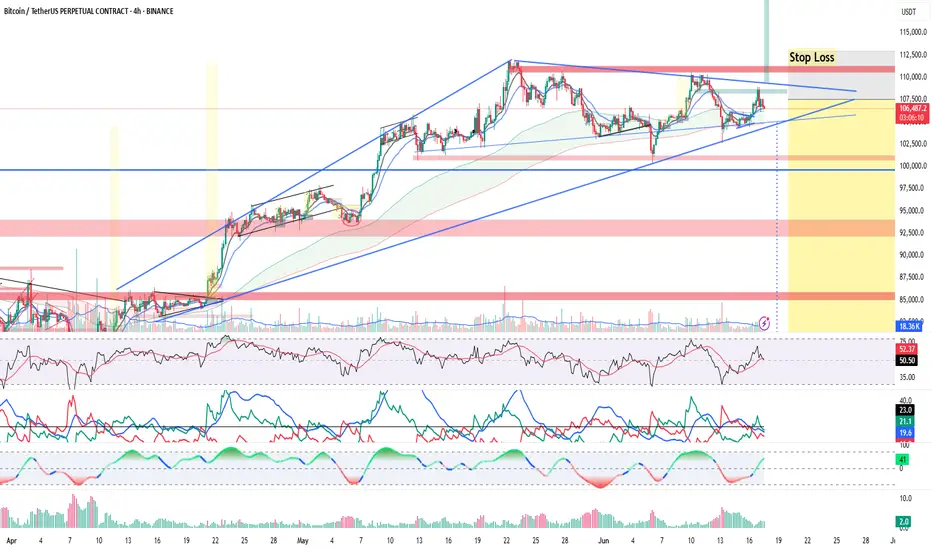
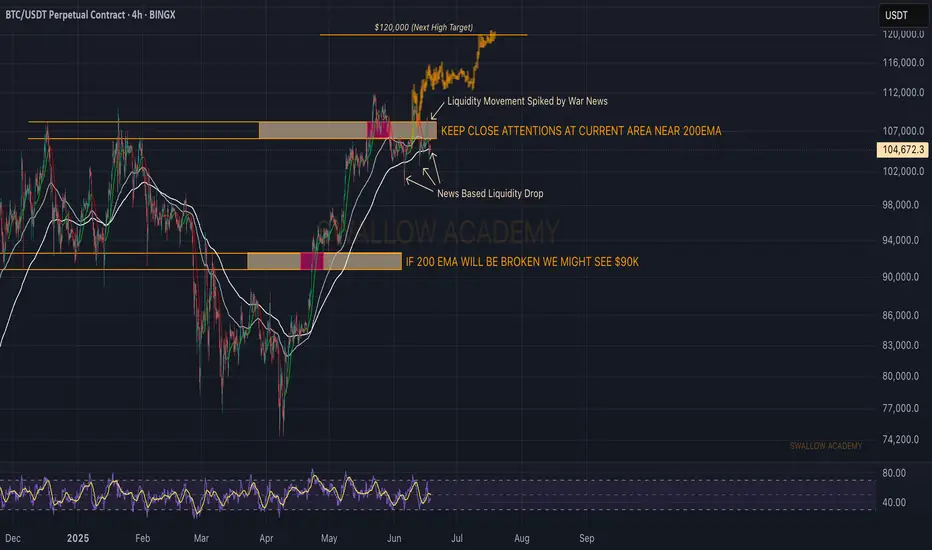
Bitcoin (BTC): Important Area of 200 EMA | Volatility IncomingWhat's happening in the world is having a huge impact on Bitcoin, but the worst is to come...
Price is hovering near the 200EMA, where neither buyers nor sellers can establish proper dominance near that area so our "wait" game continues. We wait for proper confirmations of which side will take control of the 200EMA and once we see it, we will be trading according to that.
Overall, as long as we are above the 200EMA, we are still looking for the $120K area, but once there, we will be looking for a BIG dump.
Swallow Academy
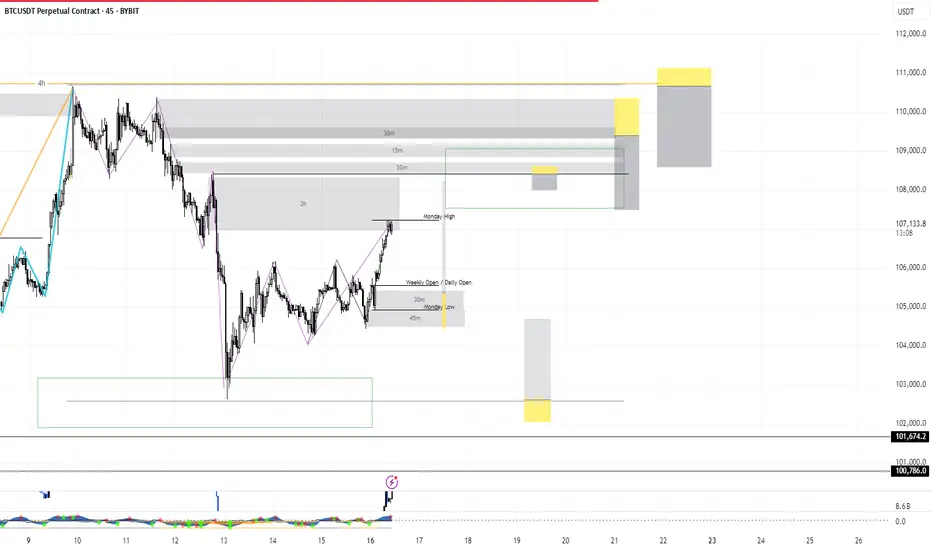
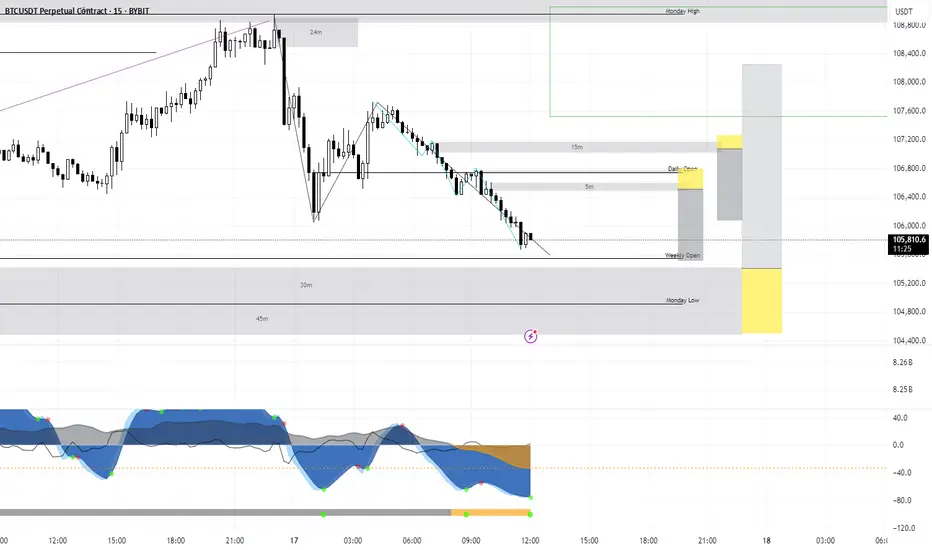
At the moment, Bitcoin is hovering around the newly created FVG.🚨 BITCOIN MARKET UPDATE 🚨
Bitcoin has recently broken below the previous BPR (Balanced Price Range), signaling a significant shift in market structure. Along with this breakdown, a Bearish Fair Value Gap (FVG) has also formed — a strong indication that the market may be preparing for a further move to the downside.
📉 What This Means:
The break below BPR, combined with the emergence of a bearish FVG, suggests that bearish momentum is currently in play. This is often a sign that the market intends to seek out lower liquidity zones, potentially targeting new lower lows.
🔎 Current Setup:
At the moment, Bitcoin is hovering around the newly created FVG. If price retraces into this zone and gives us a clear bearish confirmation (such as a rejection candle, bearish engulfing, or other MSS confirmation), it could provide a high-probability sell opportunity.
🎯 Target:
The primary target would be liquidity below the most recent lower lows.
⚠️ Risk Management Reminder:
Always wait for proper confirmation before entering a trade. These setups are best traded using MSS (Market Structure Shift) or BPR strategies for higher probability outcomes.
📚 DYOR — Do Your Own Research!
Trading involves risk. Ensure you have a strategy in place and never trade blindly.

Excellent Trade yesterday! Today's PlayHere are the scalp plays I am watching today. A few continuation plays in to demand and a reaction off supply. Lets see what the NY brings.
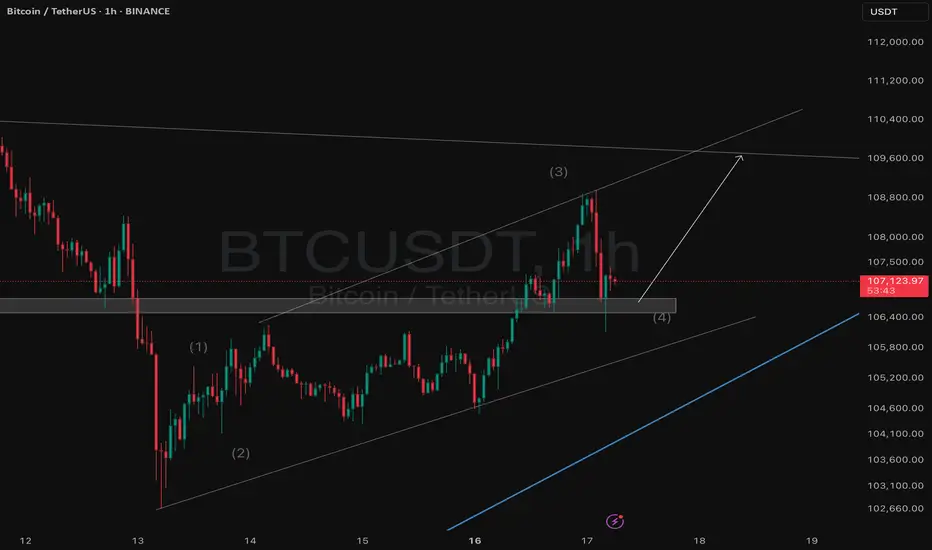
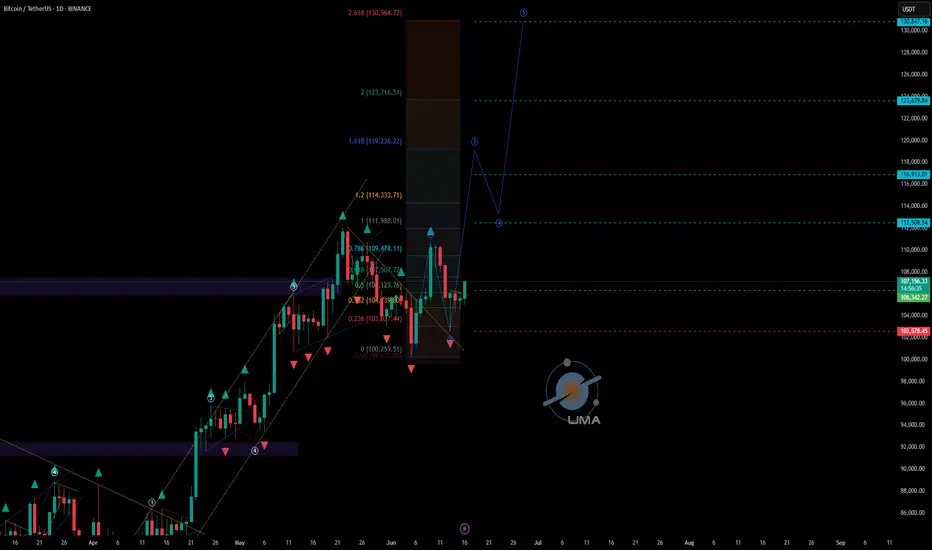
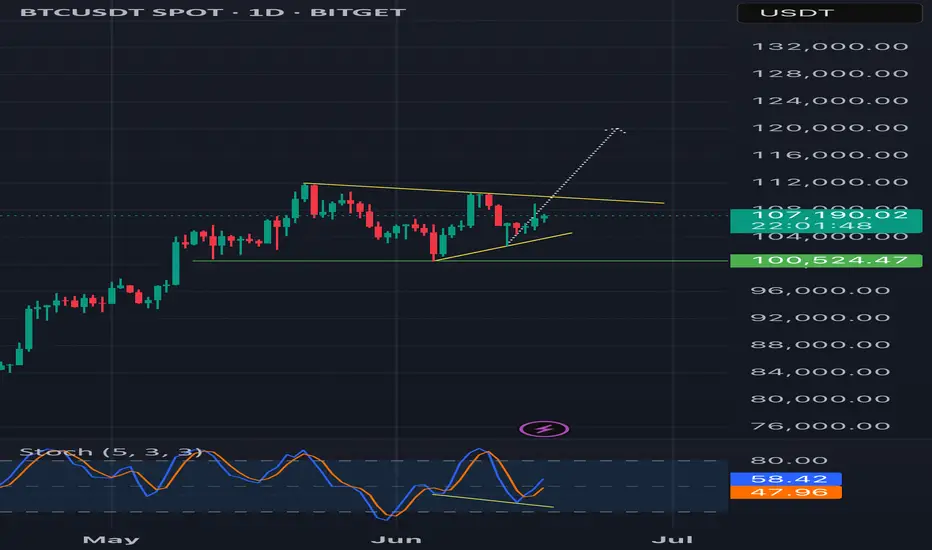
BTCUSDT - UniverseMetta - Signal#BTCUSDT - UniverseMetta - Signal
D1 - Retest of the trend line + formation of a potential 3rd wave in continuation of the uptrend. Stop behind the minimum of the 2nd wave.
Entry: 106342.27
TP: 112508.54 - 116913.01 - 123639.84 - 130847.16
Stop: 102578.45
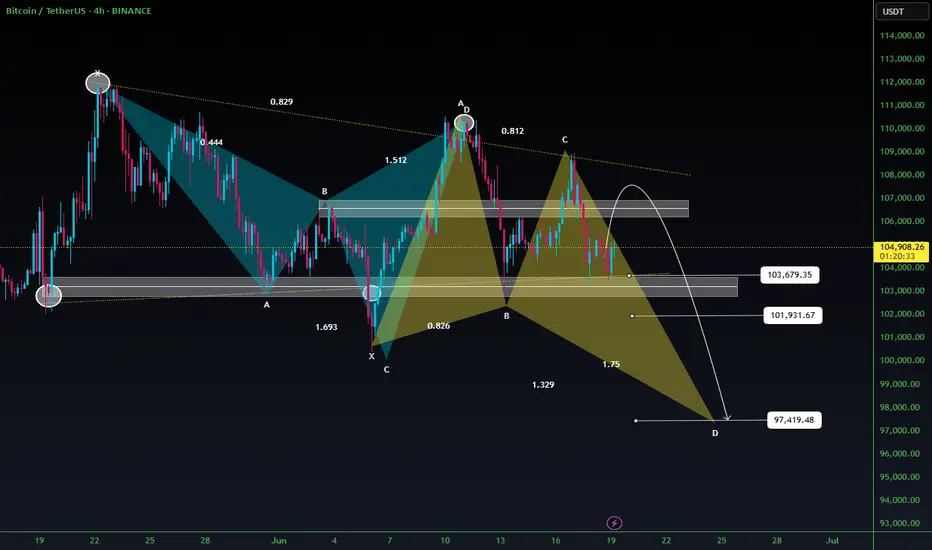
Technical Analaysis Setup – #BTC/USDTTechnical Analaysis Setup – #BTC/USDT
#Bitcoin is currently forming a bearish harmonic pattern indicating a potential correction toward key support zones.
📉 The price action suggests the development of a Gartley pattern with projected downside targets around $103,679, $101,931, and possibly extending to $97,419.
A critical resistance zone between $105,000 and $106,000 will be pivotal for either confirming bullish momentum or triggering a bearish reversal.
If BTC fails to break through this resistance and confirms the bearish reversal signal, a deeper decline toward the aforementioned support levels becomes highly probable.
🎯 Target 1: $103,679
🎯 Target 2: $101,931
🎯 Target 3: $97,419
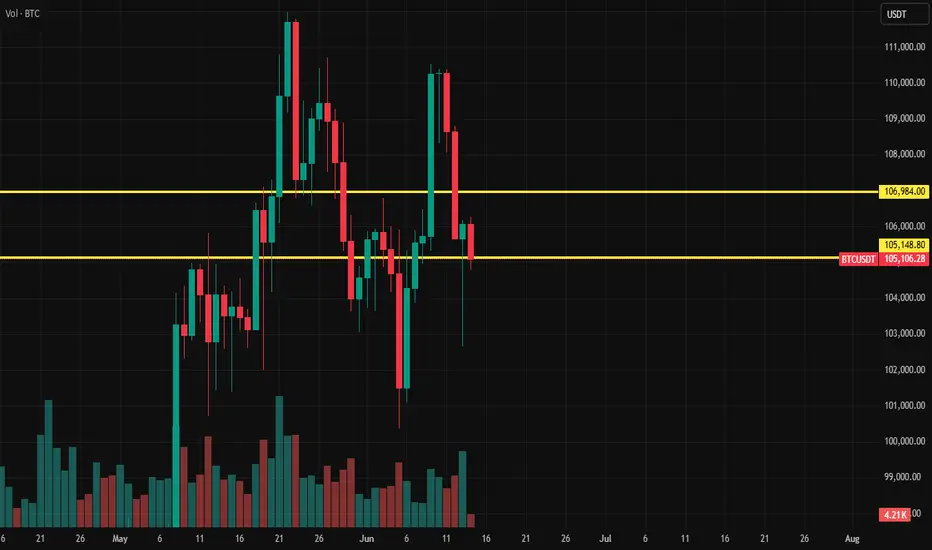
Bitcoin's Latest Market AnalysisThe recent escalation of the situation in the Middle East has triggered a surge in risk - aversion sentiment across global financial markets. As a risk - on asset, Bitcoin has faced certain selling pressure in a market environment dominated by risk - off sentiment.
From a technical chart perspective, Bitcoin has made multiple attempts to break through the key resistance range of $108,800 - $110,000 in the recent period, but has encountered significant selling pressure each time. On the other hand, the area between $105,000 - $103,000 forms an important support zone. When the price drops to this area, it attracts some bargain - hunting capital inflows, which provides a certain degree of support for the price.
The price of Bitcoin is expected to fluctuate within a relatively narrow range. If it can hold the key support level of $105,000 and the bulls can regain strength, the price is likely to rebound to the range of $106,000 - $108,000. However, if the $105,000 support level is effectively breached, it may trigger additional selling pressure, potentially driving the price down further to $103,000. In extreme cases, if market panic sentiment spreads further, it may test the psychological threshold of $100,000.
you are currently struggling with losses,or are unsure which of the numerous trading strategies to follow,You have the option to join our VIP program. I will assist you and provide you with accurate trading signals, enabling you to navigate the financial markets with greater confidence and potentially achieve optimal trading results.
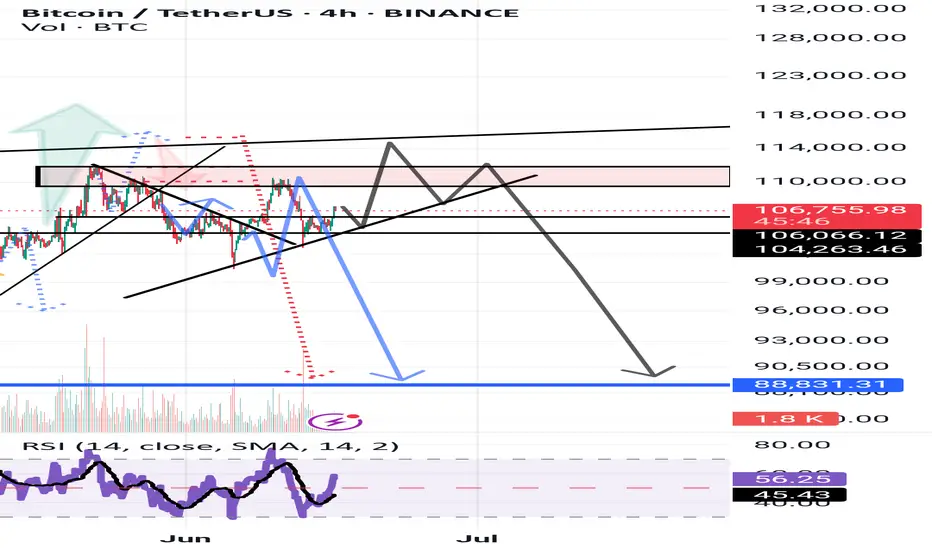
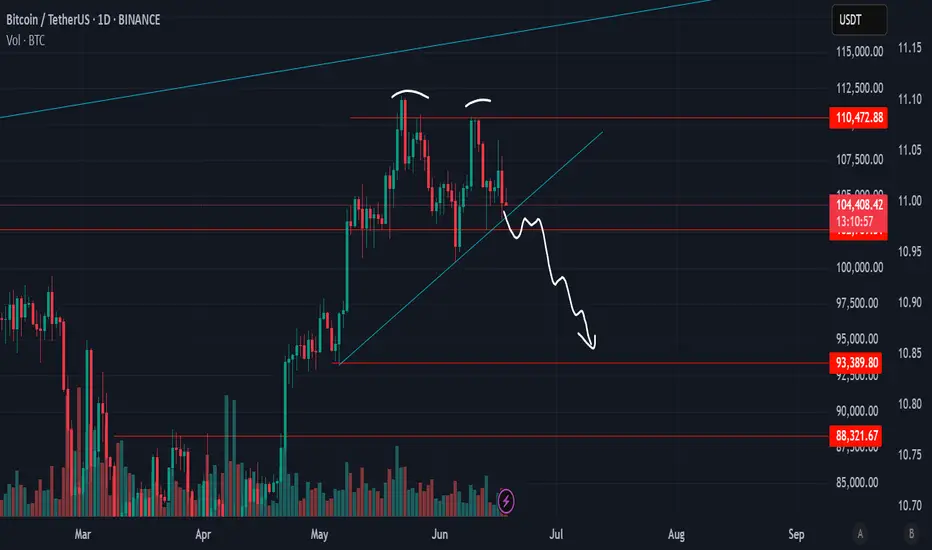
Bitcoin Double TopDouble top formation and now in support line and support trendline
if this line break, it will give rug and rug in altcoin, and maybe bitcoin can heading to 94k
But if bitcoin can solid above the lines, we can expect sideway with resist in 110k
BTC long now ! Bullish divergence confirm !Bullish divergence in daily timeframe is confirm. It might be good for take long position
#isharewhatitrade
#dyor
Kingbtc 3 4hWelcome to KIN BTC 3. It is expected that Bitcoin can form an upward step, initially reaching 108,200. After that, with a lower probability, a higher peak may also be formed. However, ultimately, the level of 88,700 is expected to be seen.