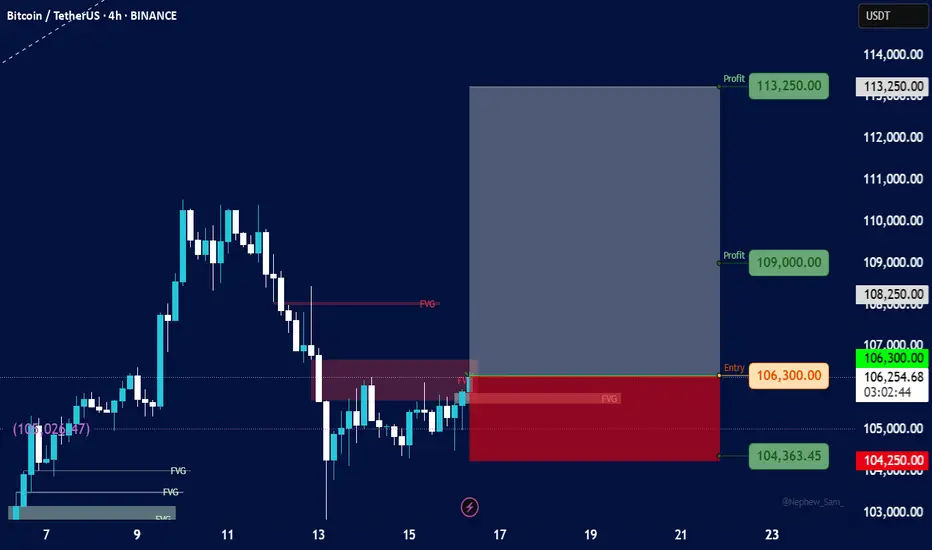
BitcoinEntry Point:
Entry Level: 106,300 USDT
Price is currently slightly below entry (106,254.67), so the trade setup is still valid and could trigger soon.
Stop-Loss (SL):
Stop Level: 104,250 USDT
Defined just below the lower FVG zone, indicating where invalidation would occur.
Take-Profit Targets (TP):
TP1: 109,000 USDT (near minor resistance)
TP2: 113,250 USDT (major target)
The Risk-to-Reward Ratio (RRR) looks favorable — possibly over 3:1, which is strong.
Shift stop to entry after reaching TP1
BTCUSDT.3S trade ideas
BTC is going to brake this lines and I it will go even higher BTC is going to brake this lines and I it will go even higher Then previous higher high . Watch closely for opening market on Monday . Anyways it will be big move long or short . Once it brake this two line .
BTC-----Sell around 100500, target 103500 areaTechnical analysis of BTC contract on June 14:
Today, the large-cycle daily level closed with a small negative line yesterday, the K-line pattern continued to fall, the price was below the moving average, and the attached indicator was dead cross. The decline in the big trend was still very obvious. We should pay attention to the breakout and pressure signal of the high point of yesterday's correction and pullback in the 106200 area; the short-cycle hourly chart yesterday's price rebounded and corrected after hitting the low point, and retreated under pressure in the Asian morning today. The current K-line pattern continued to fall, and the attached indicator was dead cross. Then the trend is likely to fluctuate downward during the day, but the strength is not expected to be great over the weekend, so it is still short-term.
BTC short-term trading contract strategy:
Directly short in the 100500 area, stop loss in the 105500 area; target is 103500 area;

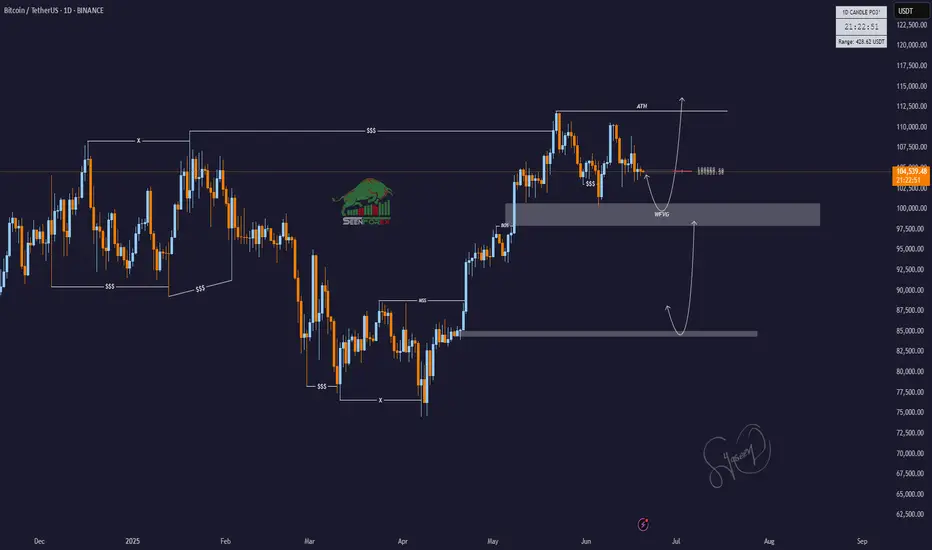
BTC/USDT Smart Money Roadmap | Daily FVG + ATH TargetSeenForex | ICT-Based Smart Money Analysis
Bitcoin is currently reacting within a Daily Weak Fair Value Gap (WFVG) after a series of liquidity sweeps ($$$). Price structure suggests two possible scenarios:
✅ Bullish Continuation Setup:
Daily WFVG acting as potential mitigation zone
Targeting ATH liquidity above $112,000
Confirmation required: bullish BOS or entry model near FVG
🔄 Bearish Liquidity Sweep Scenario:
Deeper liquidity draw possible below WFVG
Next potential demand zone around $85,000–$87,000
Clean inefficiency (FVG) below waiting to be filled
🧠 Wait for price reaction inside WFVG or deeper zone before taking action.
📊 Strategy Used:
ICT | Smart Money | Liquidity Sweep | Order Block | BOS | FVG
📅 Date: June 19, 2025
🔍 Analyst: SeenForex
#BTC #Bitcoin #BTCUSDT #SmartMoney #ICT #FVG #Liquidity #TechnicalAnalysis #CryptoTrading #SeenForex #OrderBlock #TradingViewIdeas
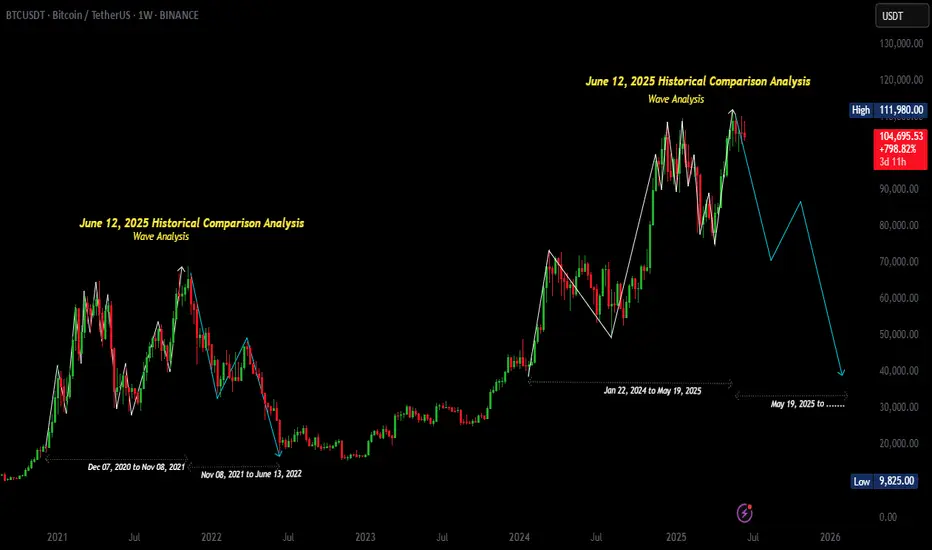
June 12, 2025 Historical Comparison Analysis [Wave Analysis]No one knows tomorrow but what if???
Here, we have a historical comparison between December 07, 2020 to June 13, 2022, and January 22, 2024 to present day.
December 07, 2020 to November 08, 2021:
• Uptrend
• Flag (retracement)
• Uptrend continuation
• Range
• Downtrend
• Range (W or Double bottom pattern)
• Uptrend
• Flag (retracement)
• Uptrend continuation
November 08, 2021 to June 13, 2022:
• Downtrend
• Flag (retracement)
• Downtrend continuation
January 22, 2024 to May 19, 2025:
• Uptrend
• Flag (retracement)
• Uptrend continuation
• Range
• Downtrend
• Range (W or Double bottom pattern)
• Uptrend
May 19, 2025 to present day:
• .......
JUST WHAT IF HISTORY REPEATS ITSELF
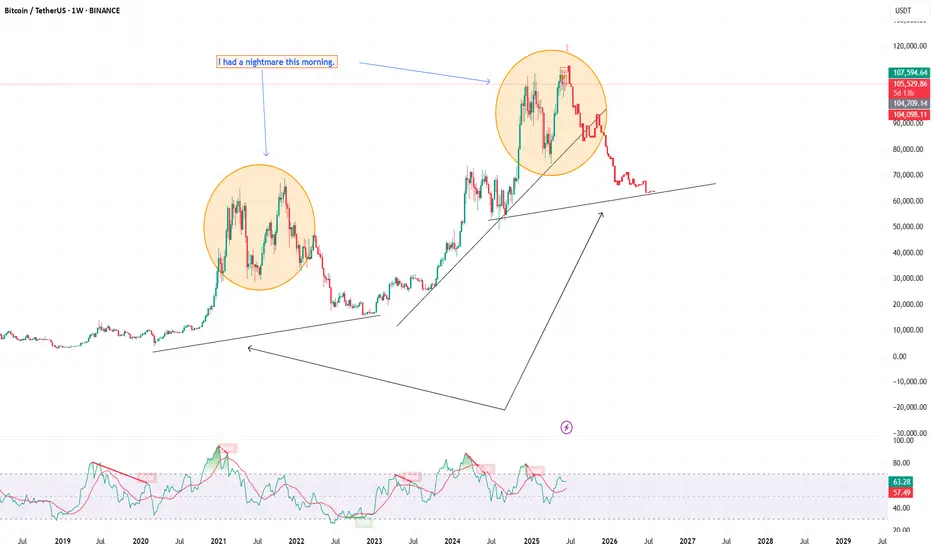
I had a nightmare this morning.Recently, I published my analysis about BTC and found that BTC is following a rising channel and is being supported by fib retracement.
But unfortunately, BTC hasn't shown any remarkable movement so far, and came back again the the support area.
I feel this is not a good sign for BTC.
ON a weekly view, It May repeat its previous movement.
I am publishing my reservation about BTC, be careful about BTC.
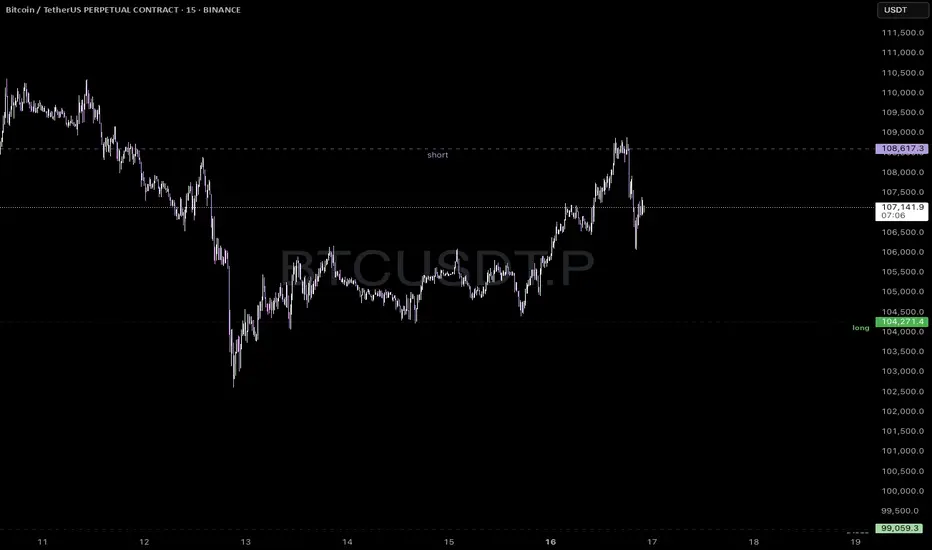
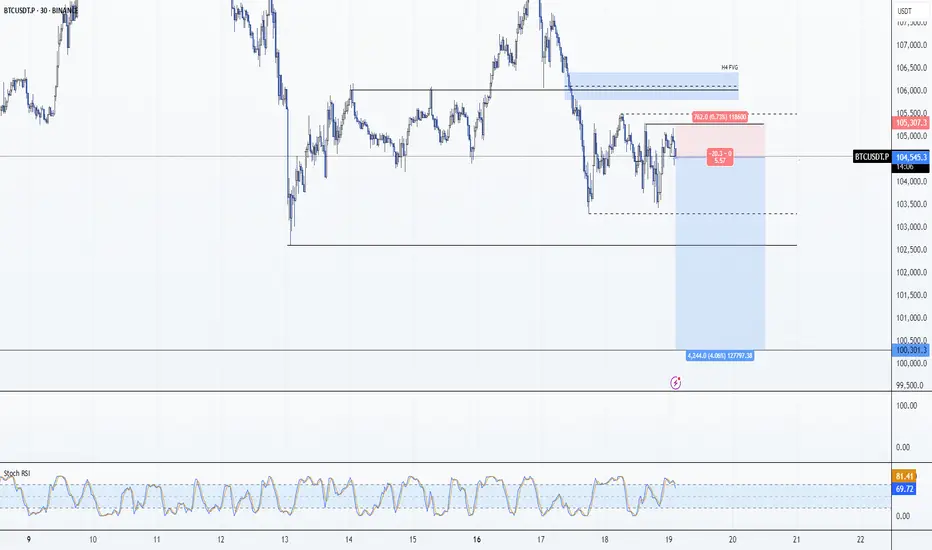
BTCUSD – Range Scalping Zones IdentifiedPrice tapped into a previous short zone near 108.6 and showed rejection. We’re watching for downside follow-through toward the 104.2 to 104.5 range where a potential long opportunity may form.
This chart outlines clean range-based levels for scalping. These zones line up with prior liquidity sweeps and local structure shifts. Scalpers can look to react at these levels depending on how price behaves when we get there.
Ideal for traders on lower timeframes like the 15m, but the concept applies across intraday setups. Always wait for confirmation before entering.
be ready for it this for educational purpose comment for any stock analysis name and take risk on ur on action
STOP LOSS LESSONI want to share my opinion about stop-losses.
I don’t use them, because very often the stop gets triggered — and then the price moves in the right direction, but you're no longer in the trade.
I do it differently: I set a take-profit, but no stop-loss.
Let’s say I have $1000, and I enter a short with $100.
The price would have to increase 10 times to get me liquidated.
A 2–3% drawdown is acceptable, especially in an overbought market.
So why would I use a stop?
Trade with small amounts — and everything will be fine.
You won’t lose money.
If you're looking for excitement, go to a casino — the odds are better there.
In trading, you need to be careful and stay calm.
From my experience, technical analysis often doesn't work.
Thanks for your attention.
#stoploss
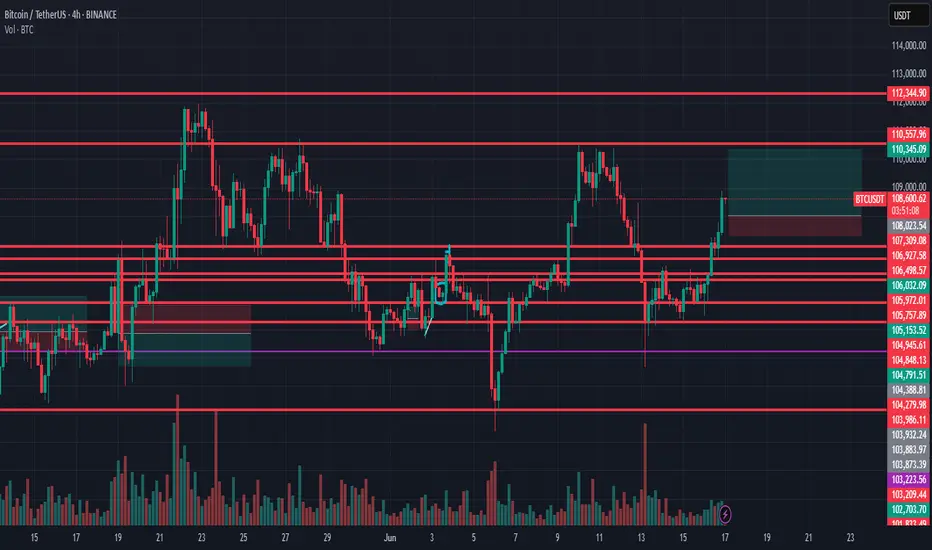
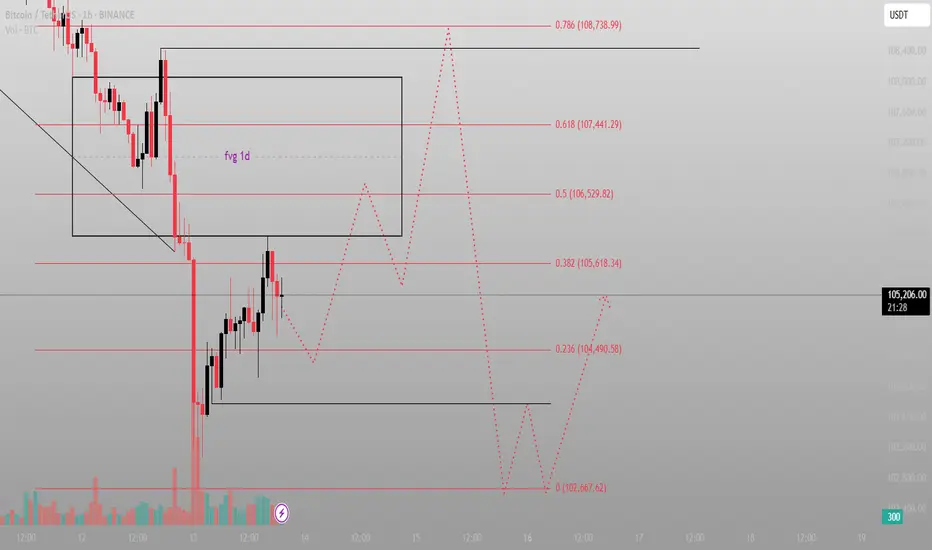
The FVG above isn’t the target. It’s the bait.This is a classic Smart Money sequence. Most are watching the imbalance at 106.5k–108.7k and expecting immediate delivery. But that’s not how this game works.
The setup:
Price broke down violently, then reversed with momentum — stopping right beneath the daily FVG block. That alone tells me it’s not ready. It’s gathering.
Below? Multiple fib levels that haven’t been tested — 104.4k (0.236), 102.6k (0.0), and a volume-backed rejection wick that still holds weight.
The market is likely to dip again — pull into deeper discount, reset the low timeframe narrative — and only then attack the FVG and upper sweep zones.
What I expect:
Sweep of 102.6k (final liquidity run)
Reaction → reclaim 104.4k
Push into the FVG toward 106.5k (0.5) and possibly 107.4k (0.618)
No emotional reaction to the red candles — this is structure playing out, not weakness unfolding.
Plan:
Ideal Entry: 102.8k–103.2k range
SL: Below 102.6k
TP1: 105.6k
TP2: 107.4k
Final: 108.7k clean inefficiency fill
Let it dip. Let it breathe. That’s where conviction is built.
Final thought:
“The real move starts when they convince you it’s done.”
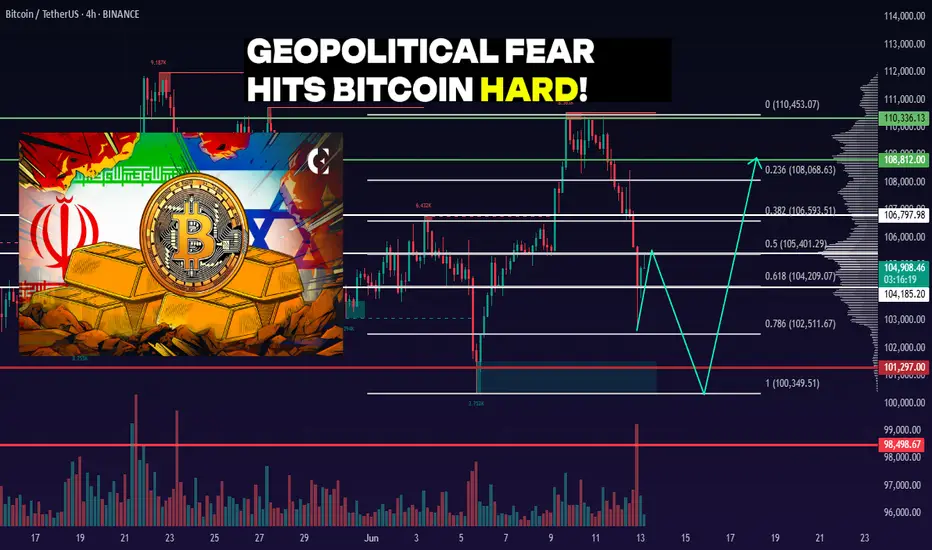
This Isn't a Crash Yet: Bitcoin's Real Correction Is Just Beginn⚡️ Hello, everyone! Bitcoin fell to $102,700 overnight. Liquidation volumes reached over a billion dollars according to official data alone. In reality, the figure is much higher.
This correction was linked to the start of hostilities between Israel and Iran. But those who follow me know that I have been predicting this for the past few weeks.
🌐 People think that geopolitics and macroeconomics drive the markets. And in part, that is true. But almost always, the signs of a sharp price movement in the near future are always visible on the chart much earlier.
➡️ And that is why I believe that the current decline is only the beginning:
A triple top has formed on the 4H timeframe. There are a huge number of gaps below, starting with $102,810 - 97,368, and another $93,270 - 85,162. And as we know, in 99% of cases, gaps close sooner or later.
There are 1 billion liquidations at the $102,700 level alone. Now imagine how much liquidity there is at the $99,000 level? And at $90,000? I don't even need to turn on the indicators to understand that there is now a huge amount of liquidity in longs concentrated below. Because throughout the entire last impulse from the 70 levels, we have hardly seen any normal correction.
⚙️ What the indicators say:
Money Flow - the outflow of liquidity and closing of positions continues. A divergence has formed even in the current movement, hinting at a potential continuation of the correction.
Dynamic Sup/Rez - the level of $105,773 is one of the most important levels, judging by the trading volumes on it. It is now also the key resistance level. The nearest support of the same strength, judging by the volume of demand, is no earlier than $94,750. And its volumes are significantly lower, at least for now.
📌 Conclusion:
For a long time now, all indicators have been literally screaming at us that a correction is about to begin. But no one believes it. I do not believe that Bitcoin will fall to 95 tomorrow. We may even see a rebound to $107,000 to close the newly formed above us and drop those who decided to short too early.
The price moves from liquidity to liquidity — that's the law. And right now, there is simply no liquidity at the top, just as there is no demand to set new ATXs at $150,000 or whatever everyone is waiting for.
🔥 So let's be patient, or better yet, stock up on free USDT and get ready to increase our positions. Because we will definitely get such opportunities soon.
Have a great weekend, everyone!

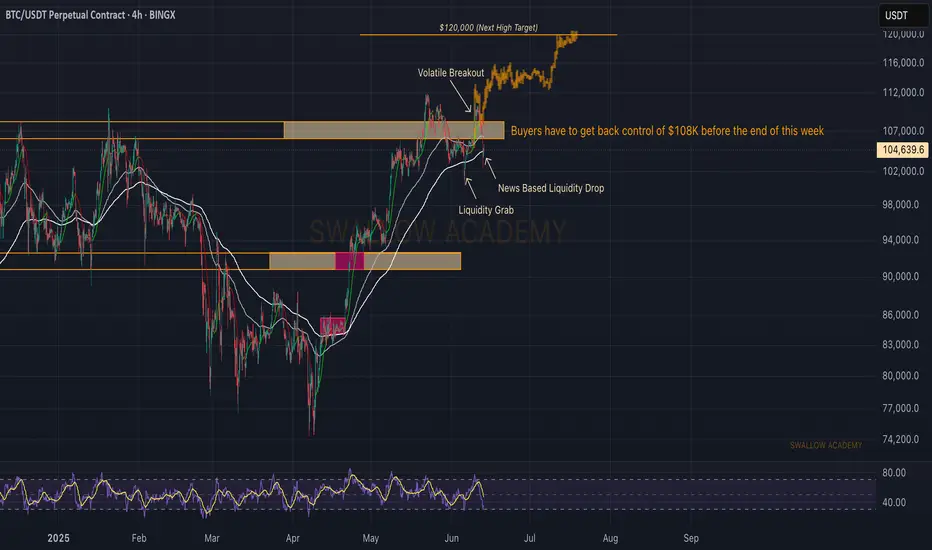
Bitcoin (BTC): Strong Selloff | Sellers Taking OverBitcoin is bleeding due to the economic news. Escalating tensions between Iran and Israel, with reports of Israel possibly preparing military action against Iran, have triggered a strong selloff on BTC, which might send the price back below the 100K area if buyers do not manage to take back control over the $108K area.
We are in a big tension zones currently so we will be waiting to see how everything escalates. If buyers fail to show dominance anytime this week, we will be switching our view to bearish.
Swallow Academy
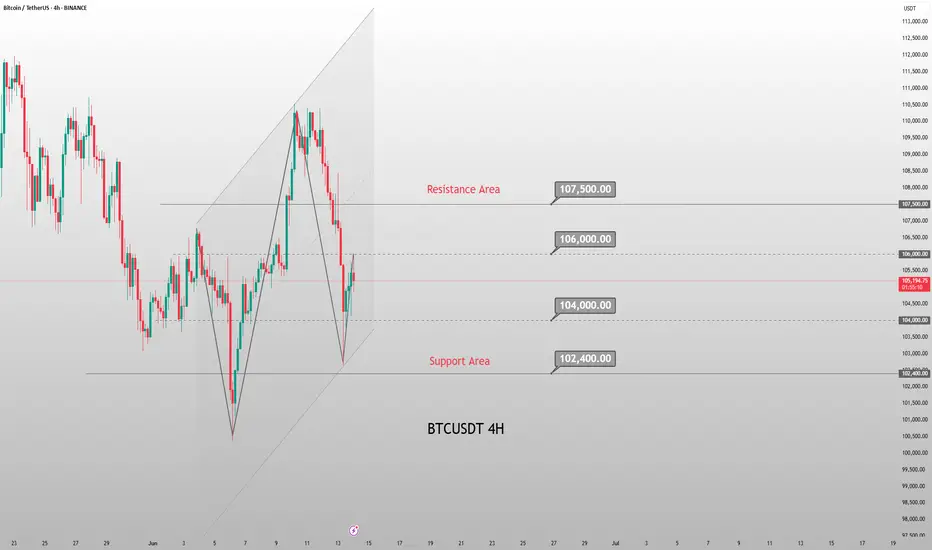
BTC 4H. $104K or Bust — Critical BTC Moment! 06/13/25BINANCE:BTCUSDT remains in a sideways range between $110,336 – $101,297. The main trading volume is concentrated around $103,907.
Recently, the price reached the upper boundary of the range at $110,336 and sharply declined from there — confirming the strength of resistance. The drop was intensified by negative geopolitical news (Israel–Iran tensions).
As a result, BTC retraced into the $104,185 – $101,297 demand zone — a potential area where buyers might step in again.
Personally, I expect one more dip into the $104,185 – $101,297 range to test the strength of buyers.
⚠️ If negative news continues, a breakdown below $100,349 and a new local low is possible.
DYOR.
TradeCityPro | Bitcoin Daily Analysis #113👋 Welcome to TradeCity Pro
Let’s dive into the Bitcoin analysis and key crypto indexes. As usual in this analysis, I’ll walk you through the futures triggers for the New York session.
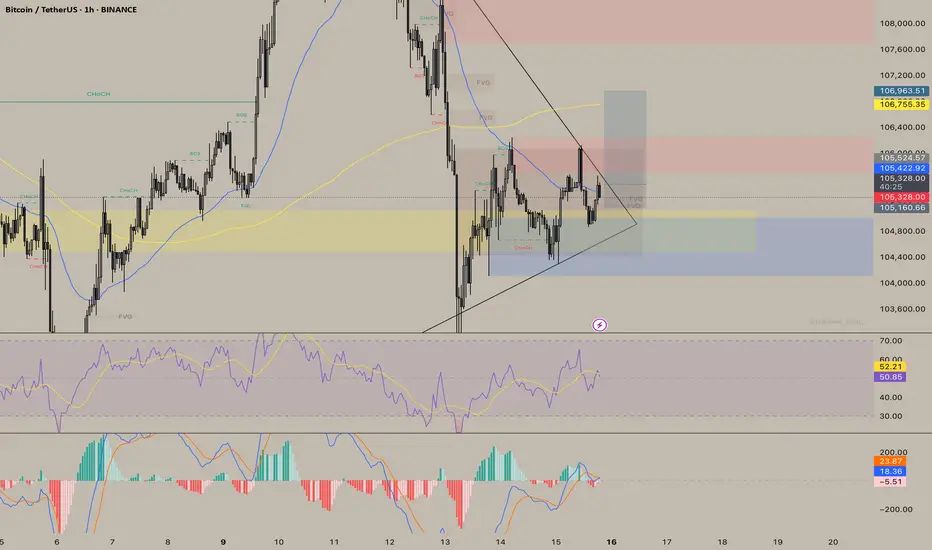
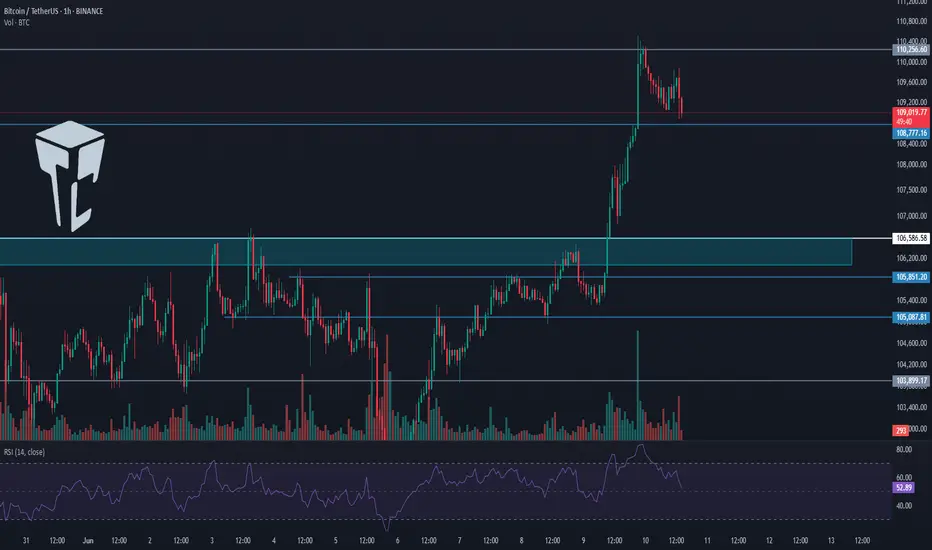
⏳ 1-Hour Timeframe
As you can see in the one hour timeframe, Bitcoin has continued its upward movement and reached the 110256 level and is now undergoing a correction.
✔️ If the price continues correcting, the next support level will be 108777. In case of a deeper pullback, the next area to watch is 106586.
📈 For a long position, our first trigger level is 110256, with a target of 111747.
📊 Market volume is currently increasing, and if this inflow of buy volume continues, the probability of a bullish move increases.
💥 The RSI oscillator has dropped below the 70 level. If RSI reenters the overbought zone, we’ll also get a strong momentum confirmation.
👑 BTC.D Analysis
Let’s take a look at Bitcoin Dominance. Today, it finally closed below the 64.49 level and has dropped to 64.12.
⚡️ This drop has allowed capital to flow into altcoins, and many of them are moving upward today. If 64.12 breaks, the downtrend may continue.
📅 Total2 Analysis
Moving on to Total2, this index finally broke above the 1.21 level and is now heading toward 1.24.
💫 At the moment, there is no major resistance preventing the market from continuing its upward trend. But there’s an important point regarding USDT Dominance, which I’ll cover below.
📅 USDT.D Analysis
During this bullish move in the market, the dominance of Tether hit the support at 4.56, while other indexes and most altcoins activated their triggers.
🔑 The key point here is that Tether Dominance has such a significant influence on the market that the inability to break this support has caused the entire market, including Bitcoin, to start correcting.
🔽 The 4.56 level in USDT Dominance is very important and will be the key to triggering the next bullish leg.
❌ Disclaimer ❌
Trading futures is highly risky and dangerous. If you're not an expert, these triggers may not be suitable for you. You should first learn risk and capital management. You can also use the educational content from this channel.
Finally, these triggers reflect my personal opinions on price action, and the market may move completely against this analysis. So, do your own research before opening any position.
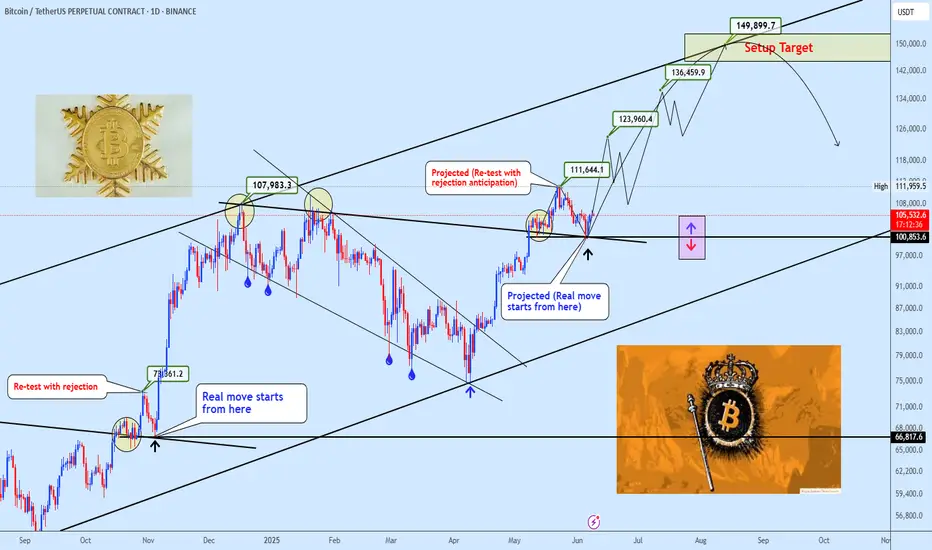
BTCUSDT Re-Test Complete Bullish Continuation Back in PlayAs anticipated in the previous analysis, BTC has successfully completed the projected retest of the $100,000–$101,000 zone. The price action within this region confirmed strong demand and validated it as a key structural support.
With the retest fulfilled and buyers stepping back in, the bullish continuation structure remains intact. We now shift focus toward the next upside targets around $123,420, $136,000, and $149,450, which form the anticipated confluence resistance zone for this current bullish cycle.
So long as price continues to hold above the $100K structure, market sentiment remains constructive. Any decisive break below this zone would warrant a re-evaluation of the short-term bias.
Stay sharp and manage risk accordingly. Feel free to share your thoughts in the comments.
$BTC end of cycleFirstly, as you can see by the red paint, Bitcoin loves to establish trendlines, by turning resisting into supporting trendlines.
Given this, market is still in a bull market & Market will continue to be so till this flips.
Green forecasting follows the above , the EW pattern and previous years correlation after entering euphoric areas (above mid blue trend).
Anywhere in those areas is good to sell & buy the white triangle next year.

Bitcoin’s Final Wave & Time Reversal Zone _ New ATH Loading?Today, I want to analyze Bitcoin ( BINANCE:BTCUSDT ) on the weekly time frame and answer these questions :
Can Bitcoin create a new All-time High(ATH) or not!?
At what price range can Bitcoin's uptrend end!?
When can we expect the uptrend to end!?
Please stay with me.
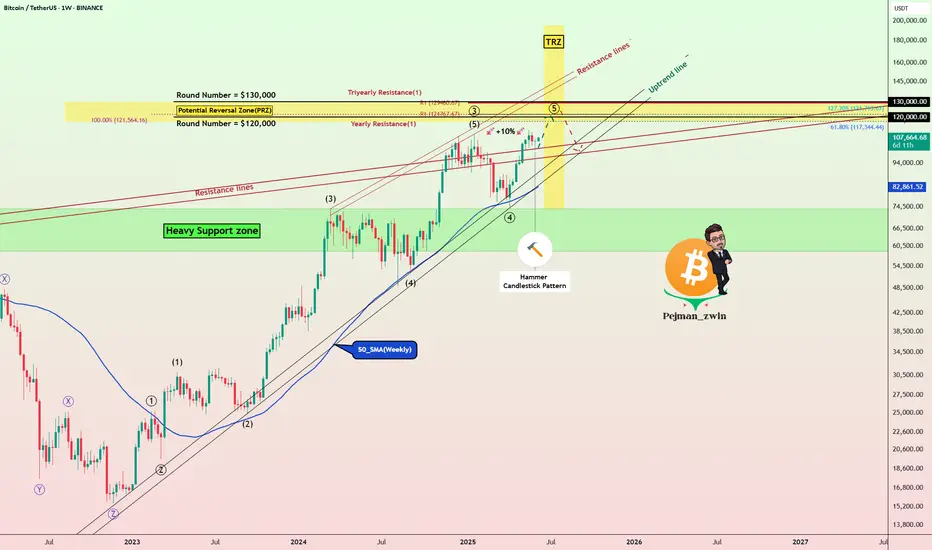
Bitcoin appears to have managed to break the Resistance lines , although we saw a fake break a few months ago , and it also appears to have a Hammer Candlestick Pattern in the previous weekly candle , which could signal the completion of Bitcoin's pullback to the Resistance lines(broken).
In terms of time , if we want to analyze the Bitcoin chart and look at Bitcoin's past, in general, the months of June(Average=-0.13%/Median=+2.20%) and especially July(Average=+7.56%/Median=+8.90%) have been among the most productive months for Bitcoin , and the months of August(Average=+1.75%/Median=-8.04%) and September(Average=-3.77%/Median=-4.35%) were the months when Bitcoin had a correction . Technical analysis tools show the end of the upward trend and the beginning of Bitcoin's correction at the Time Reversal Zone(TRZ=June 23 to August 4) .
In terms of Elliott Wave theory , Bitcoin appears to be completing the main wave 5 , as the main wave 3 was extended .
I expect Bitcoin to trend higher(+10%) in the coming weeks and create a new ATH . New ATH could be created in the Potential Reversal Zone(PRZ) and TRZ , and then we can wait for the start of the main correction .
What do you think about Bitcoin’s future movement? Can Bitcoin create a new ATH? When and at what price?
Note: If Bitcoin falls below $100,000, we should expect further declines.
Please respect each other's ideas and express them politely if you agree or disagree.
Bitcoin Analyze (BTCUSDT), weekly time frame.
Be sure to follow the updated ideas.
Do not forget to put a Stop loss for your positions (For every position you want to open).
Please follow your strategy and updates; this is just my Idea, and I will gladly see your ideas in this post.
Please do not forget the ✅' like '✅ button 🙏😊 & Share it with your friends; thanks, and Trade safe.
BTC: Short 19/06/25Trade Direction:
BTC Short
Risk Management:
- Risk approx 0.25%
Reason for Entry:
- M30 + M15 Bear Div
- Rejected off Monday low
- Failure to break weekly open
- H1 overbought
- Market is choppy, HTF Bearish
Additional Notes:
- Compounding shorts to maximize edge if trade confirms, currently have a risk free SOL short running. Moving my risk to this.
BTCUSDT Trend Analysis and Trading RecommendationsToday's overall BTC market rebounded after hitting a low of 102,614 in the early trading session, with Bitcoin's price maintaining a slow upward trend throughout the day. The intraday high reached 105,912 but encountered resistance. As the weekend approaches, historical market data shows limited volatility during weekends, so range-bound fluctuations are expected for the weekend.
From the current overall market rhythm, the price has rebounded slightly today after the previous decline. The hourly chart shows consecutive upward candles, though the price movement remains relatively slow. As time progresses, the price is expected to sustain an upward trend after pullbacks, and breaking through the short-term resistance level is only a matter of time. In terms of short-term structure and pattern, despite slight resistance and minor pullbacks, the downward momentum has weakened. We can still focus on long positions at lower levels, paying attention to the 106,000 resistance level.
BTCUSD
buy@104000-104500
tp:106000-107000
Investment itself is not the source of risk; it is only when investment behavior escapes rational control that risks lie in wait. In the trading process, always bear in mind that restraining impulsiveness is the primary criterion for success. I share trading signals daily, and all signals have been accurate without error for a full month. Regardless of your past profits or losses, with my assistance, you have the hope to achieve a breakthrough in your investment.
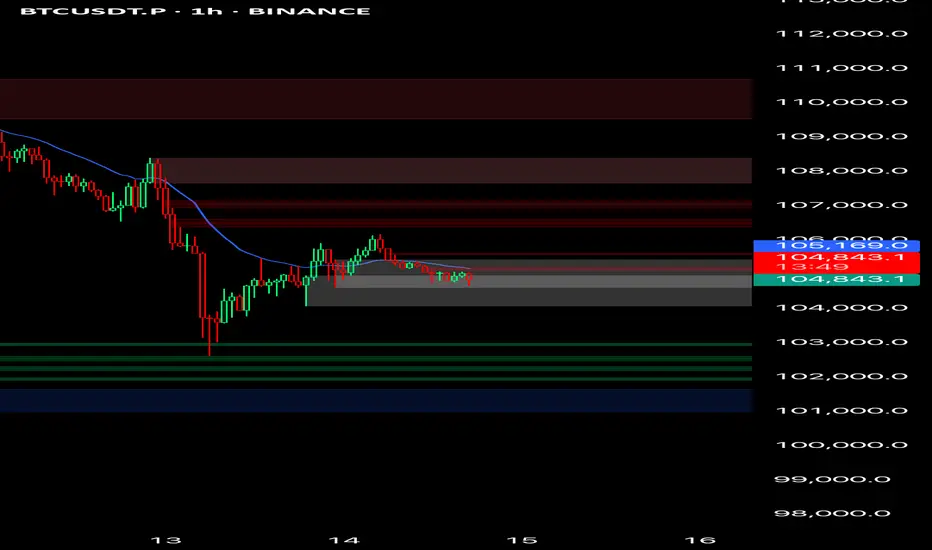
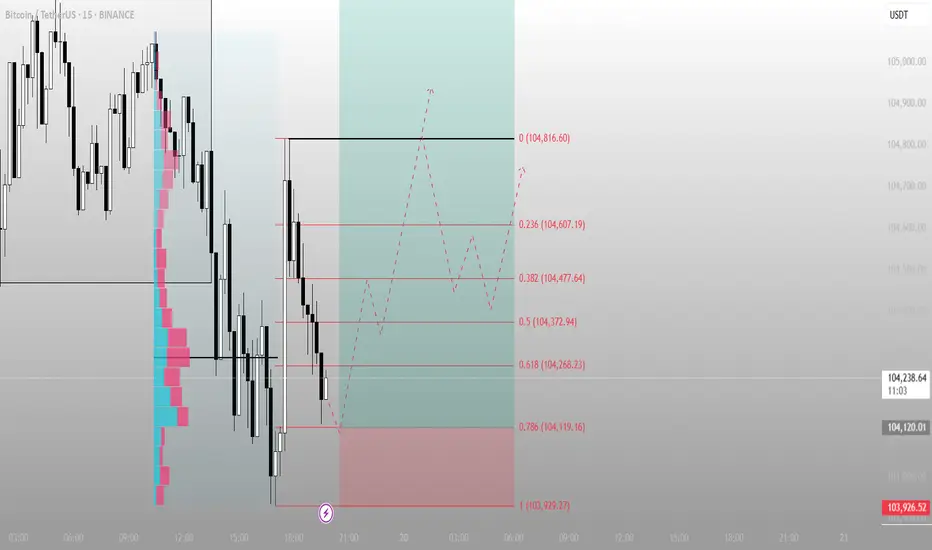
BTC – 15min Reversal Structure & Fibonacci ReclaimWe’re currently witnessing a potential short-term reversal on BTC’s lower timeframe after a volume-supported breakdown and sweep of local lows.
🔍 Key Observations:
Price swept liquidity at local lows (~103,929.27)
Entered into a clear reaccumulation box with responsive buyers
Volume profile shows prior POC just above – room for fill
Fibonacci retracement aligns with key structure:
0.5 = 104,372.94
0.618 = 104,268.23
1.0 = 104,816.60 (final high target for this impulse)
📈 Potential Play:
Entry Zone: Just above the sweep candle (104,100–104,200)
Target 1: 0.382 at 104,477
Target 2: 104,816.60
Invalidation: Close below 103,926
🧠 Mindset:
This is a classic liquidity sweep → reaction → reclaim pattern. If BTC flips the 0.5 level with strong momentum, a short squeeze toward the 104.8K area becomes likely.
Great opportunity for scalpers or day traders.
Let me know if you want this turned into a long-form breakdown or sent in another format.
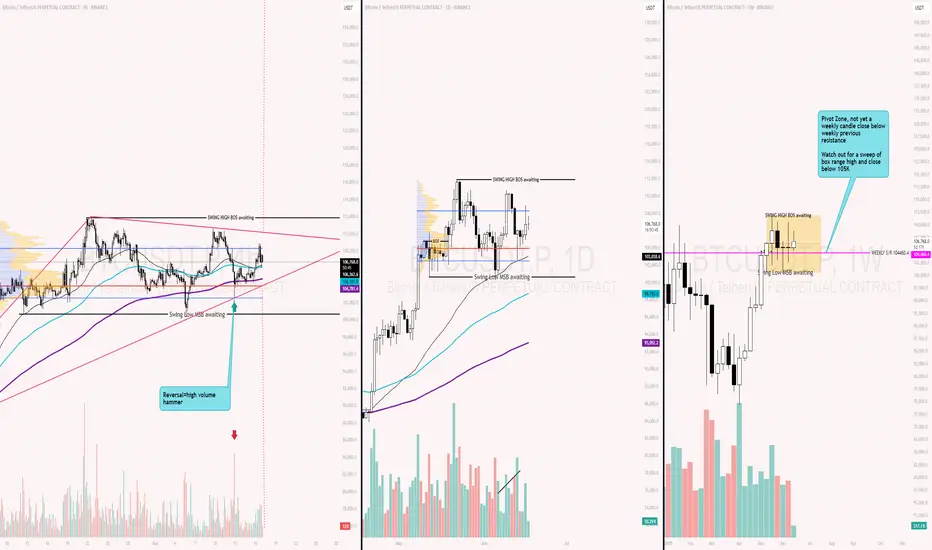
BTC Weekly BOX breakout or possible false breakoutWe have BTC setting up a nice weekly consolidation box, with candle closes consistently holding above the previous weekly ATH resistance. Multiple Doji closes indicate consolidation and compression. At the bottom of the box, we’ve seen strong reversals with high volume. The 4H chart is consistently defending the 200 EMA, supporting the idea that the daily trend remains strong — although direction is currently unclear.
Is distribution happening? It’s not easy to short just yet. We might still see a false breakout, position filling, and then a return to the box range. I’d be interested in a swing short if that happens — especially if the weekly candle closes with high volume and signals a reversal, indicating a potential bearish shift on the daily chart. Let’s keep in mind that June is historically weak, especially during the last two weeks.
On the long side, I’ll only be looking for entries after a daily break of structure (BOS).
Does not need to goes to the highs, we could drop below 100K if we lose box range low with a MSB.
Interesting days ahead — patience is key, as we currently don’t have many high-probability setups.
BTC H4 Range Play: Patience Until One Side Breaks✅ Price contracting within well-defined H4 range
✅ Clear lower highs and higher lows — coiled, ready to break either side
⚠️ FOMC incoming — possible volatility/surprise rate cut rumors
🎯 Trading Plan:
Short Setup:
If price spikes RH ($105,500) and H4 FVG (~$106,000), then re-accepts back inside the range
Entry on confirmation back below RH/FVG
Target: RL ($103,300) and $102,600
Stop: Above $106,300
Long Setup:
If RL ($103,300) or $102,600 gets swept then reclaimed (M15/H1 SFP or strong reclaim)
Entry on confirmation reclaim of RL/W
Target: RH ($105,500) and beyond
Stop: Below $102,200
🔔 Triggers & Confirmations:
Only enter trades on confirmed sweeps/reclaims or acceptance back inside after spike
No trade if price stays in chop between levels
📝 Order Placement & Management:
Sell Limit: $105,500–$106,000
🛡️ Stop: $106,300
🎯 Target: $103,300 / $102,600
Buy Limit (on sweep/reclaim): $102,600
🛡️ Stop: $102,200
🎯 Target: $105,500 / $106,000
🚨 Risk Warning:
Market coiled — can rinse either side
FOMC could be a catalyst; manage risk, don’t overtrade

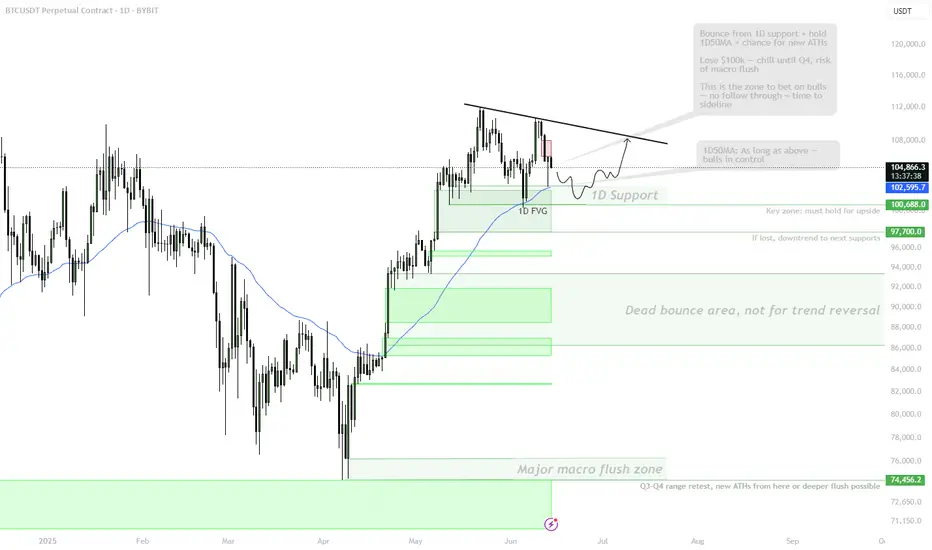
BTC | At the Line Between ATH Expansion or Macro FlushBINANCE:BTCUSDT Bulls need to hold the $102k–$100.8k support and 1D 50MA for a shot at new highs.
– Wick into 1D FVG ($98k) is fine, but no daily close below 50MA allowed.
– Lose $100k? Then it’s sideline season — next real support only at $93k/$87k, macro flush risk toward $75k–$58k if momentum fails.
– As long as above 1D support/MA, there’s a chance for a clean ATH breakout from the OB under the highs.
This is the zone to bet on continuation. If not, don’t fight the trend lower.