Take a look at how BTC will move this weekendToday your first target is 103,616.00 .
The next day second target is 101,150.00 .
BTCUSDT.5L trade ideas

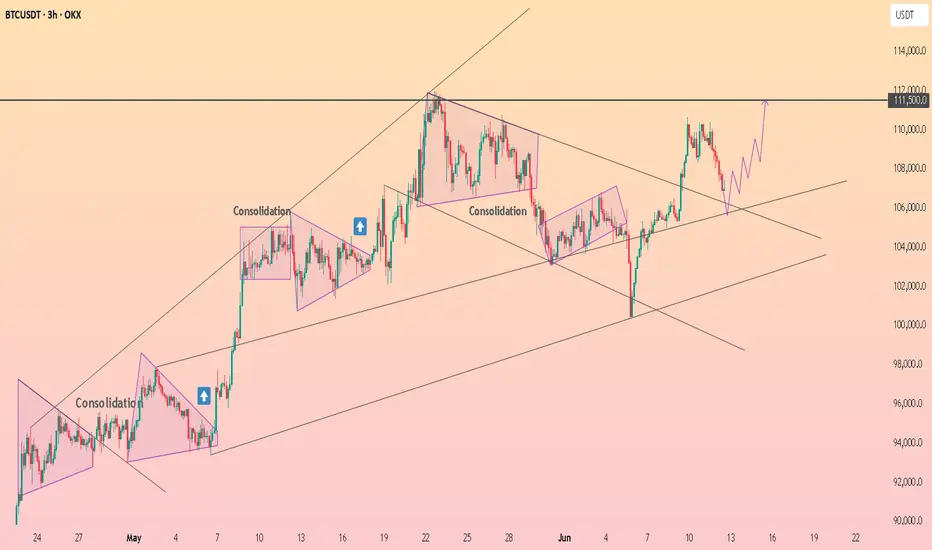
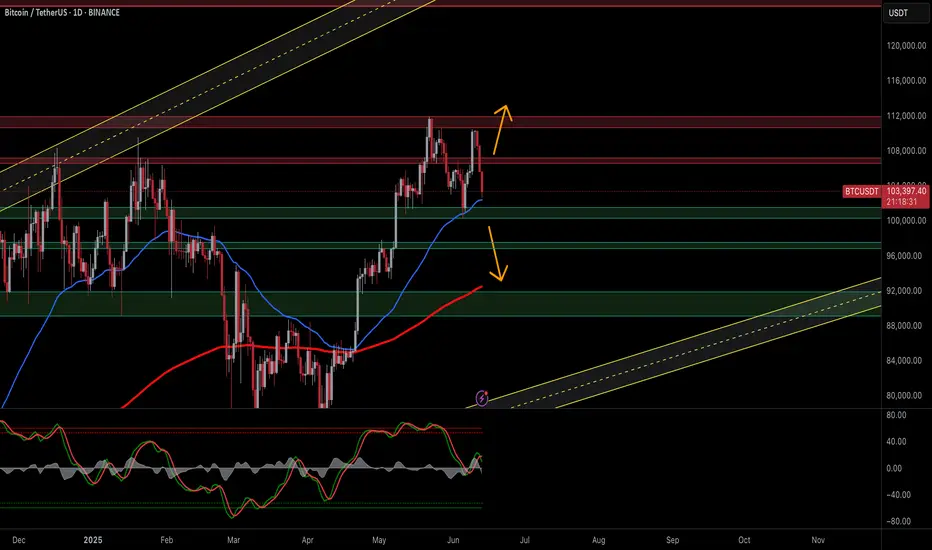
Bitcoin (BTCUSDT) - Price Consolidating Inside Sym. Triangle - DBITCOIN (BTCUSDT) price has recently bounced up from above the 50EMA (yellow line).
Since May 2025, price has been consolidating sideways and has now formed a symmetrical triangle (blue lines). 10% to 20% volatility could be incoming for Bitcoin this summer.
The key resistance prices that Bitcoin has yet to breakout above are: $110000, $112000, $115000, and $120000+.
Support prices are holding at this time, such as $105000, $104000, $102000, and $100000, $95000.
If price holds above $100,000 to $105,000, there is still a chance that Bitcoin can continue to uptrend and rally higher this year in 2025.
However, if $100,000 price and support levels are lost, a new downtrend could occur and price could possibly test the 200EMA zone (red line).

BITCOINThe Federal Reserve is likely to interpret the June 2025 University of Michigan (UoM) consumer sentiment and inflation expectations data as mixed but cautiously encouraging, with implications for monetary policy:
Key Data Points
Consumer Sentiment: 60.5 (vs. 53.5 forecast, prior 52.2) – a sharp rebound to the highest level since mid-2023.
1-Year Inflation Expectations: 5.1% (vs. 6.6% prior) – a significant decline, nearing pre-tariff levels.
Fed Interpretation
Improved Consumer Sentiment:
The jump to 60.5 signals renewed optimism about the economy, likely driven by reduced trade tensions (e.g., tariff pauses) and stable labor markets. This aligns with recent upward revisions to April and May sentiment data.
The Fed will view this as a sign of economic resilience, reducing urgency for near-term rate cuts to stimulate growth.
Sharply Lower Inflation Expectations:
The drop to 5.1% (from 6.6%) aligns with the New York Fed’s May 2025 survey showing declining inflation expectations across all horizons.
This suggests consumers are growing more confident that the Fed’s policies (and tariff adjustments) are curbing price pressures, easing fears of a wage-price spiral.
Policy Implications:
Dovish Tilt Supported: Lower inflation expectations reduce the risk of entrenched price pressures, giving the Fed flexibility to cut rates later in 2025 if growth slows.
No Immediate Cuts Likely: Strong sentiment and a resilient labor market (unemployment at 4.2%) justify maintaining rates at 4.25–4.50% in July.
Focus on Tariff Risks: The Fed will remain cautious about potential inflation rebounds from Trump’s tariffs, which could add 1.5% to prices by late 2025.
Market Reactions
DXY (Dollar Index): Likely to dip modestly as lower inflation expectations boost rate-cut bets, but sentiment-driven growth optimism may limit losses. Key support at 98.00–98.20.
Bonds: 10-year yields may edge lower (toward 4.00%) on reduced inflation fears, though strong sentiment could cap declines.
Equities: Stocks (especially consumer-discretionary sectors) may rally on improved economic outlook.
Conclusion
The Fed will likely view this data as validating its cautious stance: inflation expectations are cooling, but strong sentiment and labor markets argue against premature easing. A September rate cut remains the base case, contingent on continued disinflation and no tariff-driven price spikes. Traders should watch for June CPI (July 11) and Q2 GDP to confirm trends.
#bitcoin #dollar

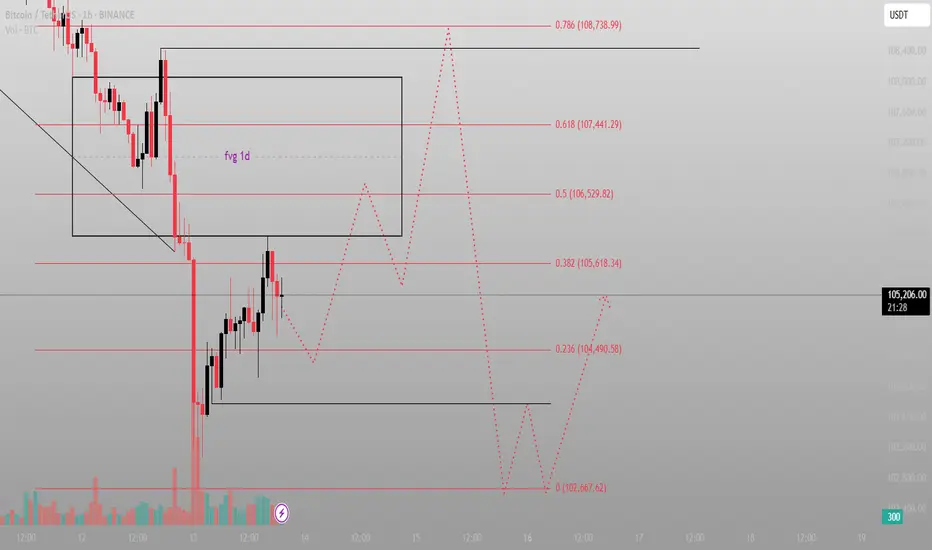
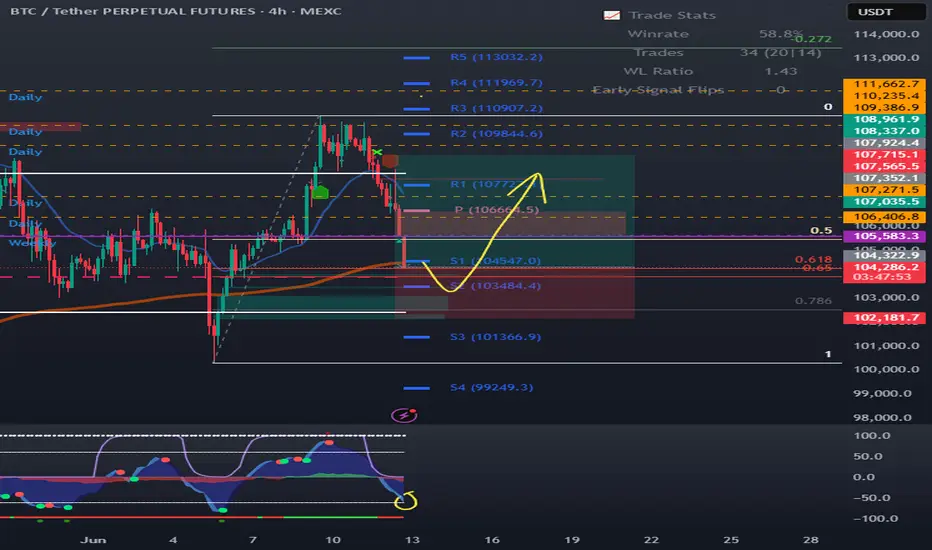
The FVG above isn’t the target. It’s the bait.This is a classic Smart Money sequence. Most are watching the imbalance at 106.5k–108.7k and expecting immediate delivery. But that’s not how this game works.
The setup:
Price broke down violently, then reversed with momentum — stopping right beneath the daily FVG block. That alone tells me it’s not ready. It’s gathering.
Below? Multiple fib levels that haven’t been tested — 104.4k (0.236), 102.6k (0.0), and a volume-backed rejection wick that still holds weight.
The market is likely to dip again — pull into deeper discount, reset the low timeframe narrative — and only then attack the FVG and upper sweep zones.
What I expect:
Sweep of 102.6k (final liquidity run)
Reaction → reclaim 104.4k
Push into the FVG toward 106.5k (0.5) and possibly 107.4k (0.618)
No emotional reaction to the red candles — this is structure playing out, not weakness unfolding.
Plan:
Ideal Entry: 102.8k–103.2k range
SL: Below 102.6k
TP1: 105.6k
TP2: 107.4k
Final: 108.7k clean inefficiency fill
Let it dip. Let it breathe. That’s where conviction is built.
Final thought:
“The real move starts when they convince you it’s done.”
Bitcoin to $100k Soon. The End of Bitcoin Bear Markets? In this chart we explore the batshit idea that we'll never have another bitcoin bear cycle ever again due to macro conditions and supply shock from no one needing to sell.
Not investment advice obviously.
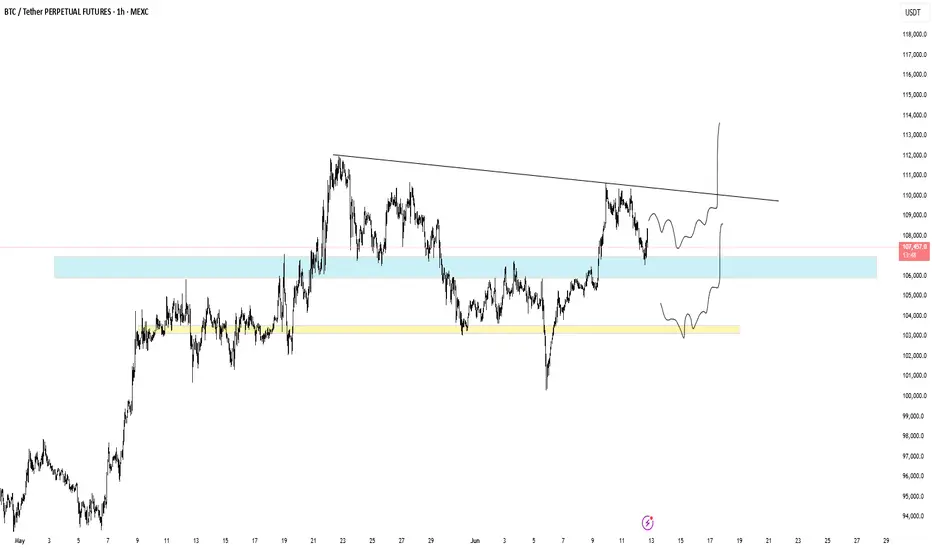
#BTC is approaching the S/R conversion zone📊#BTC is approaching the S/R conversion zone⚠️
🧠Yesterday's long orders were swept after moving up the SL, because the support zone near 106500-107500 was broken, and the support zone turned into a resistance zone.
➡️If the price rebounds here again, it may be resisted. Therefore, we can look for some short signals to participate.
➡️If we still want to continue to rise, we can only remain optimistic after breaking through the support-resistance conversion zone and stabilizing.
🤜If you like my analysis, please like 💖 and share 💬
BITGET:BTCUSDT.P

A possible 100k scenario?Good day!
Its been a while since a bloodbath. And there is another possible cycle down to 100k. Will this continue?
#NFA
#TYOR

HolderStat┆BTCUSD local correctionBINANCE:BTCUSDT
→ Price coils between rising-channel mid-line & descending cap
↳ 108 k lid: clear it to unlock 112–117 k upper rail
⇢ Hold 105 k mid-rail to keep staircase intact
⤴ Drop < 104 k flips bias to 102 k base
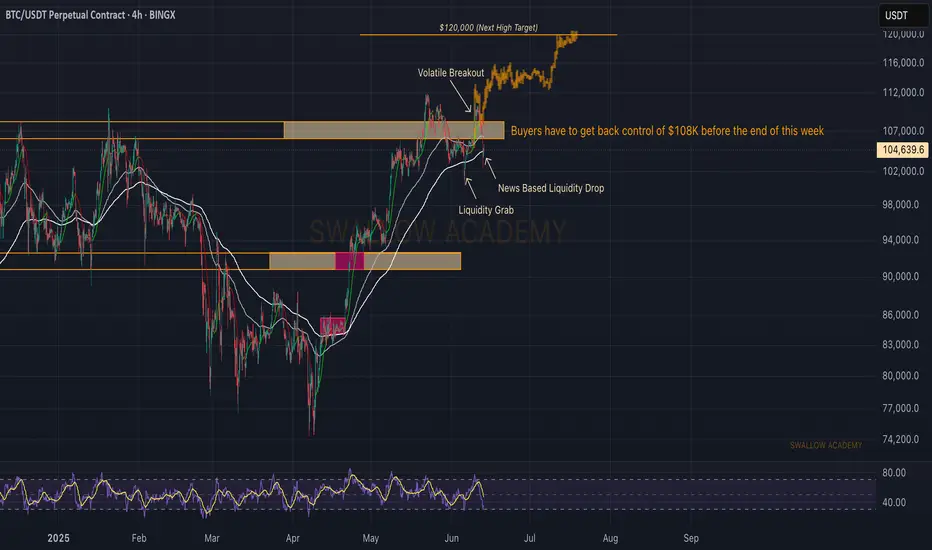
Bitcoin (BTC): Strong Selloff | Sellers Taking OverBitcoin is bleeding due to the economic news. Escalating tensions between Iran and Israel, with reports of Israel possibly preparing military action against Iran, have triggered a strong selloff on BTC, which might send the price back below the 100K area if buyers do not manage to take back control over the $108K area.
We are in a big tension zones currently so we will be waiting to see how everything escalates. If buyers fail to show dominance anytime this week, we will be switching our view to bearish.
Swallow Academy
Bitcoin just gave a masterclass on Effort vs. Result.War news? Massive sell volume? No breakdown.
✅ Held and reclaimed the 200 EMA
✅ Price stayed elevated despite heavy effort to push it down
This is bullish divergence in action:
Big effort, little result = strength.
🎯 If this holds: $71.8K → $73.6K → $75K are in play.
Bears failed. Structure stands. Follow price, not panic.

btc movement in 45minAfter the formation of strong bullish candles, in my opinion, an upward movement can be expected. The targets are shown on the chart.
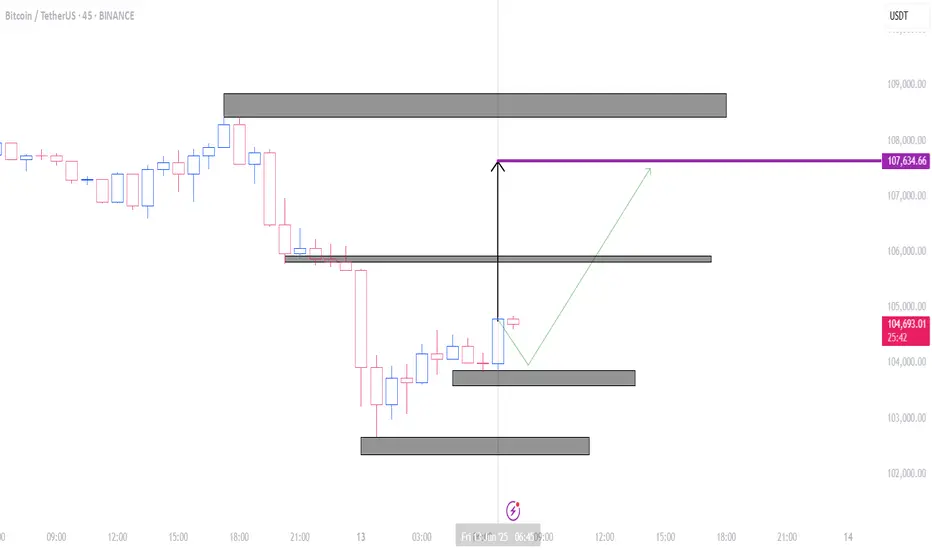
BTC - setupWe’ve just broken through the trend reversal zone.
My buy order got triggered, which means my $BTCV position — initially opened at $101.000 — has now been scaled up.
My stop-loss is set just below the 0.786 level, around $102.000
LFG 🚀
$BTC/USDT 1D Quick Analysis$BTC/USDT 1D Quick Analysis
Bitcoin is under pressure after rejecting the $112K–$113K resistance zone. It’s now testing key demand at
$ 101,000–$ 104,000.
If bulls defend this zone, a short-term bounce toward $ 107,000–$ 109,000 is possible.
But if $101K breaks, BTC may correct deeper toward $91K.
The structure has turned bearish.
Watch this demand zone closely.
DYRO, NFA

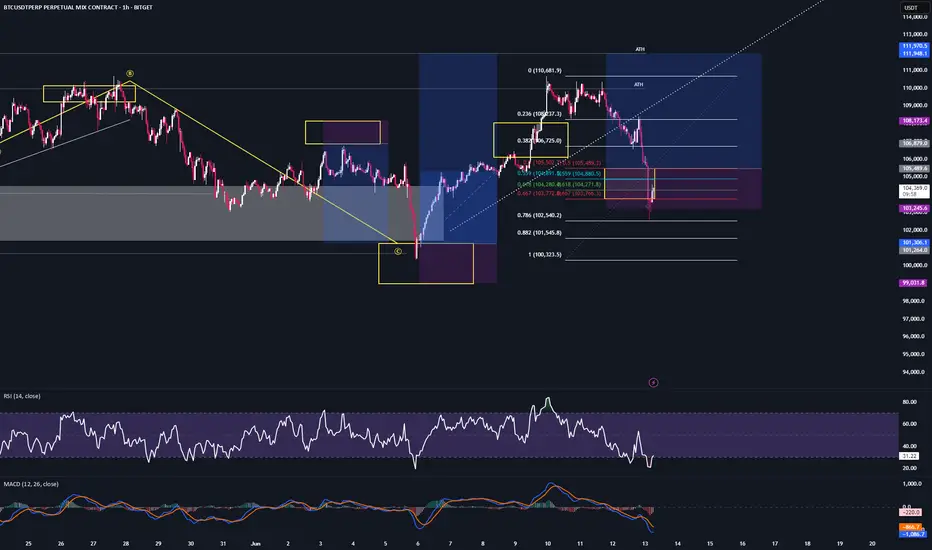
Bitcoin Key Market Structure Update
🔑 ZemoG Trading — Bitcoin Key Market Structure Update
As outlined in our previous analysis, a decisive close below 109.6k signaled the start of Bitcoin’s anticipated decline, pushing price action toward completing the right side of the unfolding market structure cycle.
BTC has now tapped 103.6k, a significant wick level and established point of control — areas where liquidity hunts and sharp reversals are not only possible but expected.
Whenever price strikes these structural pivots, the market seeks to rebalance by sweeping residual wicks before resuming the primary trend.
🔍 What’s Next?
For our upcoming short entry opportunities, we are watching for precise reactions and rejection patterns at the following upper wick clusters:
104.6k
105.3k
105.8k
106.4k
107.1k
108.2k
108.8k
🎯 Short-term Downside Targets:
102.3k (interim support)
101.4k (secondary profit zone)
100.6k (key structural break level)
A confirmed close below 100.6k will validate further downside continuation and unlock the next leg of the sequence.
🧭 Key Takeaway:
Patience and precision are your greatest allies. Wait for the key levels and execute with discipline.
1️⃣1️⃣
♾️ Trust the sequence. Respect the reversal. Repeat the mastery.
— ZemoG Trading

BTC Reacts to Iran–Israel Escalation: Risk-Off Sentiment GrowsBitcoin (BTC/USDT) — Caught Between Fear & Fundamentals
Technical Outlook — 13 June, 2025
Current Market Condition:
Bitcoin has dropped to $103,818 after facing rejection from the $106.8K–$108K resistance zone, coinciding with heightened geopolitical stress following renewed military escalation between Iran and Israel. Traditional markets are showing signs of risk aversion, and while Bitcoin is often seen as a hedge, the current flight to USD liquidity and defensive assets is putting pressure on high-beta instruments like crypto.
The psychological $100K support zone, which aligns with the EMA 50 and a key Fib level, is the immediate area to watch. A failure here could expose Bitcoin to deeper retracement toward $96,800 and potentially $92K, especially if global tensions worsen or investors rotate further into cash and gold.
Key Technical Highlights:
Rejection at supply zone near $106,888–$108,000.
Support at $100K holds structural and psychological importance.
Stochastic shows bearish momentum crossover, increasing downside probability.
EMA 200 at $92K could act as ultimate cushion in a full-blown correction.
Volatility likely to remain elevated amid Middle East conflict and global uncertainty.
Trade Plan:
🔼 Bullish Relief Bounce (Long Bias):
Trigger: Reclaim and hold above $106,888 with rising volume
Target: $108K → $112K → $116K
Stop Loss: Below $103,500
🔻 Geopolitical Risk Sell-Off (Short Bias):
Trigger: Break and close below $100,000
Target: $96,816 → $92,000 → $88,000
Stop Loss: Above $102,500
📉 Dip Buy Strategy:
Trigger: Price stabilizes at $96.8K with divergence and calming geopolitical headlines
Target: $103K → $106K
Stop Loss: Below $95K
🛡️ Risk Management Note:
With geopolitical risk driving short-term sentiment, expect volatility spikes, whipsaws, and fake breakouts. Remain nimble and manage exposure carefully — especially during weekend sessions when crypto trades unhedged and news developments can occur without warning.
📢 If you found this analysis valuable, kindly consider boosting and following for more updates.
⚠️ Disclaimer: This content is intended for educational purposes only and does not constitute financial advice.
BTC 4hr POC, 200EMA, Golden pocket confluenceBTC 4hr POC, 200EMA, Golden pocket confluence.
Looking at smaller timeframes for bullish divergence for entry.
This could be the bounce to test new ATH.
Break of all these support will be a big drop.
BTC bearish outlook going as planned Just as analysed , by is dropping, I would want to see price take out his 4h low , and also ,mitigate the 95k level

bitcoin for long *The content on this analysis is subject to change at any time without notice, and is provided for the sole purpose of assisting traders to make independent investment decisions.

Fasten your seatbelts, we're going for $120,000.#BTCUSDT If the double bottom pattern has completed its evacuation, a strong bull market is expected.
BTC losing momentum but support needs to holdBTC is showing some bearish signs. However, as long as the price can stay above $101k, the bias is still up.
Full TA: Link in the BIO

Signs of reversalBTC hit its technical target after breaking below its range at the resistance of the January ATH. The hourly RSI is showing signs of reversal.
btcwill be looking on long on BTC using 2 confluence.
1 is under nearest resistant that turn to support
or the
0.75 confluence