It Is Belief That Keeps Bitcoin Alive Above $100,000In recent weeks, following Bitcoin’s surge beyond the $100,000 threshold, a new collective sentiment has taken shape. Each rally strengthens the conviction of long-term holders, and each correction plants new seeds of optimism.
The true battle lies not in price fluctuations, but in ideology. For many, Bitcoin represents far more than a tradable asset it's a paradigm shift. They see institutional adoption, such as government-backed ETFs, not as a luxury but as a necessity. In contrast, short-sighted voices focus solely on speculative price gains, missing the broader vision.
What truly fuels this market is collective belief in the future. The steadfast resistance against recent sell-offs reveals a deep and growing confidence not shaken by volatility but shaped by it.
As the saying goes: For the believer, the struggle is not a barrier it is the path.
BTCUSDT.5L trade ideas

BTC Triple JumpRSI Fired ✔ Breakout Above $110,200 Next ➜ Targeting 140K
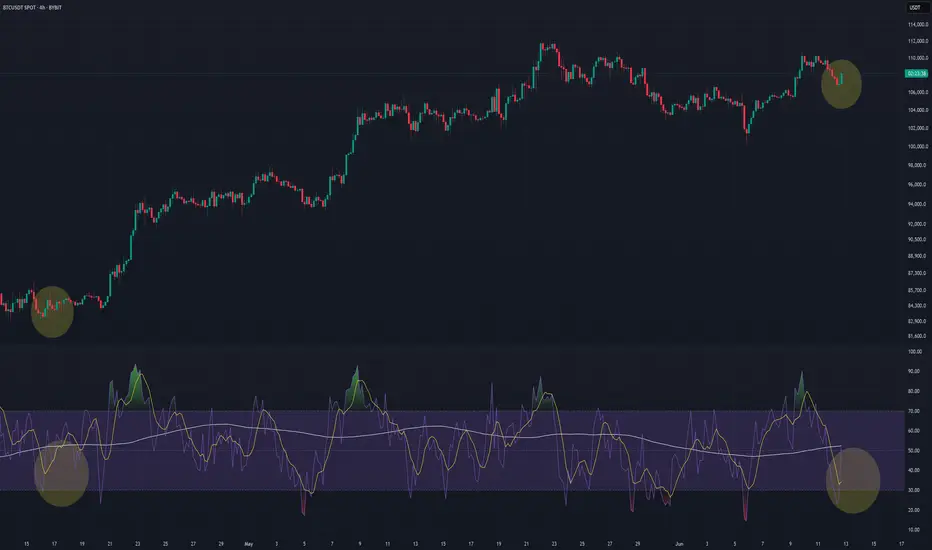
BTC is entering a critical phase on the 4H chart, and this setup looks remarkably similar to previous moments that led to sharp bullish continuation. Price is steadily forming higher lows and now pressing right up against the key resistance at $110,200 — the last confirmed swing high. 🧱
What makes this moment particularly interesting is what’s happening beneath the price: momentum is quietly shifting. Using a custom triple RSI setup — with short, medium, and long lengths — I’m seeing a familiar pattern unfold. The white line (longer-term RSI) has already crossed above the 50 level ✅, a strong signal of building trend strength. Meanwhile, both the short and medium RSIs are deep in the oversold zone 🔻 — a dynamic that, in the past, has front-run explosive rallies.
This exact structure has preceded multiple breakout moves over the past months. The RSI alignment acts as an initiative confirmation, and now price is approaching the final confirmation level: a break and 4H close above $110,200. If that happens, I expect a swift push toward $112,500–$114,000, with potential for much more.
🔥 This aligns perfectly with my previous idea, where I laid out a case for a major breakout in June that could drive BTC toward $140K. That outlook was based on higher-timeframe expansion patterns and macro structure — and what we’re seeing now could be the moment where it all starts.
As of now, it’s too early to talk about invalidation. The structure remains intact. Momentum is shifting. All that’s left is the breakout.
If you haven’t seen my 140K projection yet, check it out — this could be the first real ignition point. 🚀
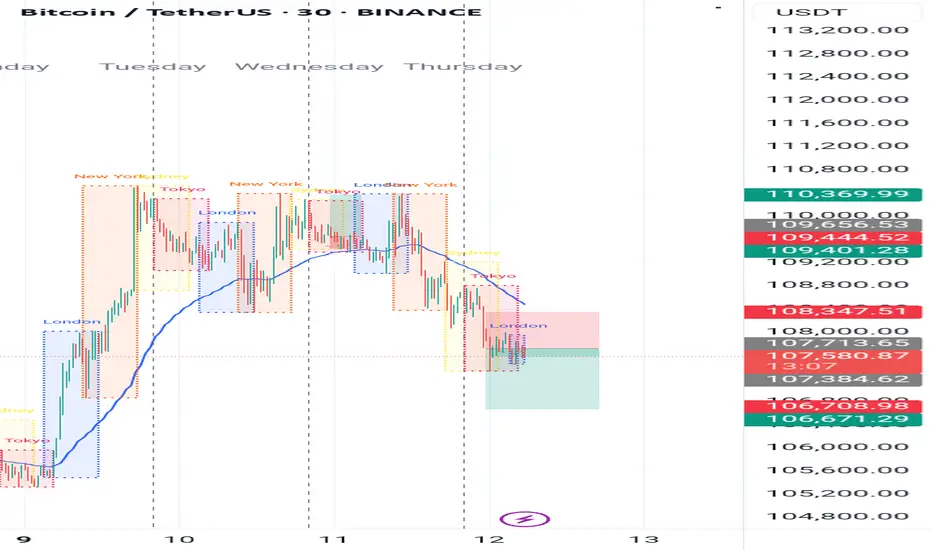
While they panic at 0.618, I loadThis is the type of setup that filters out noise traders. Four-hour price delivered into a stacked FVG zone — aligned with equilibrium, and structured to reprice.
Here’s the logic:
After taking out short-term highs near 111.9k, price repriced sharply — not randomly, but with algorithmic precision — into a series of untouched 240min FVGs.
Price tapped the upper imbalance, hovered at the 0.618 fib retrace (107.3k), and held. That’s not weakness. That’s orderflow.
Below this sits the final FVG + golden 0.786 (106.4k) and round number zone near 105.2k. That’s your invalidation layer. Anything inside it? Still Smart Money accumulation.
Above? The draw remains clear: inefficiency fill to 110.6k and liquidity resting above 111.9k.
My framework:
Bias: Bullish unless 105.2k gets violated with intent
Entry: 107.3k–106.4k
TP1: 108.5k (fib 0.382)
TP2: 110.6k (inefficiency fill)
Final objective: 111.9k raid
Volume confirms the handoff — sellers are trapped chasing the leg, Smart Money has already shifted to accumulation.
Final thought:
I don’t wait for signals. I wait for price to make sense. And here, it’s giving every reason to load.
“Fear at 0.618 is the edge of amateurs. Patience at imbalance is where precision lives.”

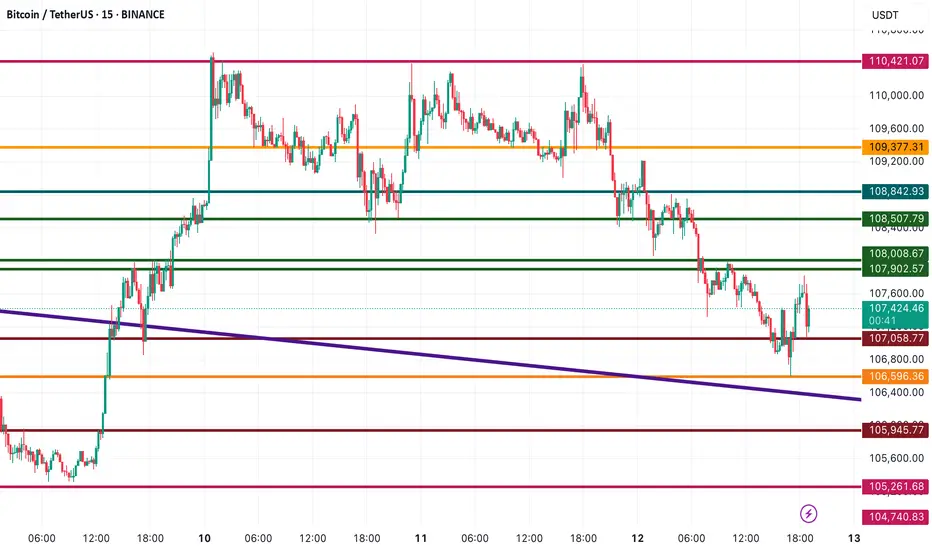
Bitcoin Technical Analysis📊 Bitcoin Technical Analysis | BTCUSDT – 1H Timeframe
Key support and resistance zones have been carefully mapped out in this chart — use them as a guide for smart entries and profit targets in your trades.
🔼 If BTC breaks above the key resistance at 107,902, the next targets will be 108,507, 108,842, and potentially 109,377.
🔽 However, if price gets rejected from the 107,902–108,000 zone, watch for support around 107,058, followed by 106,808 and 105,945.
📌 These levels have shown strong reactions in the past and continue to act as key zones for Bitcoin’s movement.
👉 Save this chart and follow for more high-probability setups and live updates!
BTC Long Setup (Short-Term)🚀 BTC Long Setup (Short-Term)
Bitcoin is showing bullish momentum and holding key support levels.
I’m eyeing a short-term long position with a target at 108,294.
If momentum continues, this could be a strong push toward the next resistance zone.
📈 Stay sharp and follow the levels!

BTC/USDT Analysis: Local Downtrend
Hello everyone! This is a daily analysis from a trader-analyst at CryptoRobotics.
Yesterday, despite a positive chart structure, Bitcoin broke out of the accumulation zone to the downside. This move was influenced by the escalation of the conflict in the Middle East and extreme FOMO among retail traders.
The main expectation is a decline toward the nearest buyer zone at $105,800–$104,500 (accumulated volumes), where we will look for long entry opportunities. This zone is very strong and is likely to hold with a 90% probability. An additional confirmation is the presence of predictive liquidations of long positions within this zone, which could serve as fuel for a reversal.
During the decline, two new resistance zones were formed. In the short term, short positions from these areas can be considered until the support is tested.
Sell Zones:
$107,900–$108,500 (strong seller activity)
$109,000–$110,000 (accumulated volumes)
Buy Zones:
$105,800–$104,500 (accumulated volumes)
$101,600–$100,000 (zone of previous pushing volumes + current buyer defense)
$98,000–$97,200 (local support)
Level at $93,000
$91,500–$90,000 (strong buying imbalance)
This publication is not financial advice.

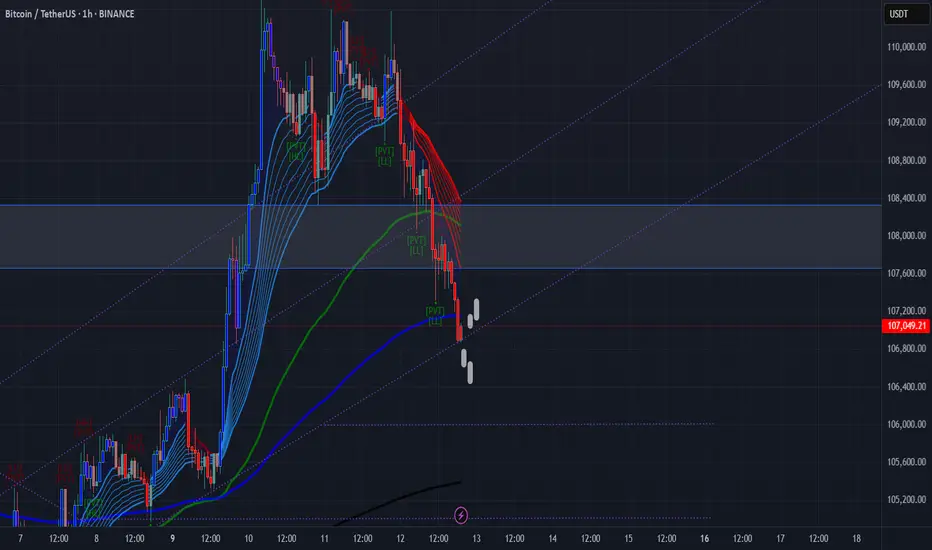
[DYOR] BTCUSDT – Rejected from Supply, Watch 200 EMA BreakdownBTCUSDT failed to continue upward and broke below the ascending structure. Now testing key support at 106.9K–107K and the 200 EMA.
📉 Sell on pullback around 108.2K–108.6K
📉 Alternative: Sell stop at 106.3K if breakdown continues
📈 Aggressive bounce possible at 106.9K, but high risk
SL & TP based on key S/R zones
Always apply solid risk management 🚨
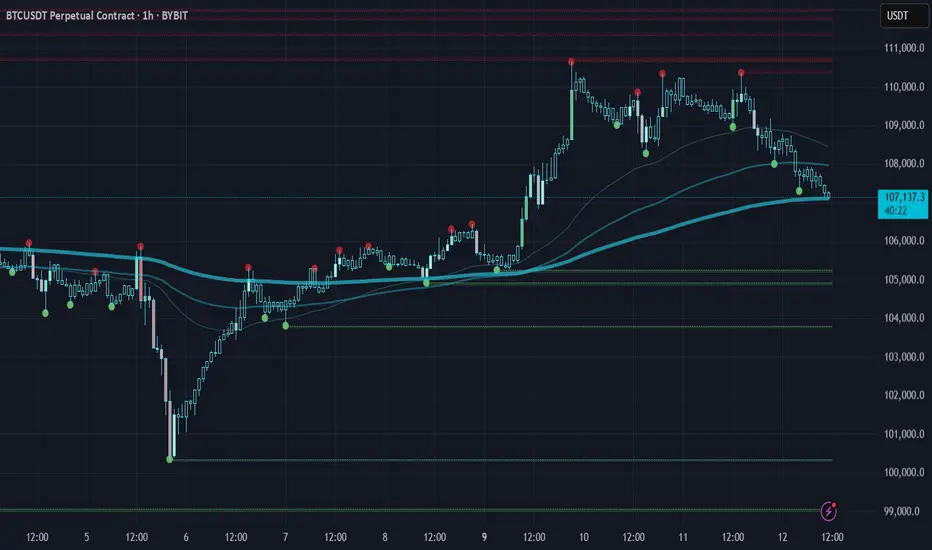
Bitcoin H1 BreakdownPrice swept 110K with weak volume → no follow-through → sharp rejection.
Now testing 200 EMA near 107K.
Lose it → 105.2K / 103.7K next.
Hold it → bounce to 110.6K likely.
Classic liquidity trap + momentum unwind.
Bitcoin Showing Bullish Intentions as Selling Pressure Weakens📈 Bitcoin Showing Bullish Intentions as Selling Pressure Weakens
In the last three 4H candles, we’ve seen a decline in volume alongside smaller candle bodies, even as the price has moved slightly lower. This typically signals weakening selling pressure and increasing bullish interest.
As long as price doesn't print a lower low below $105,500 and fails to break above $110,246, Bitcoin is likely building structure for a potential bullish breakout. If the current level holds and BTC begins to rally from here, the new higher low would likely be around $107,000 — reinforcing the bullish trend structure.
🧠 Key Insight: Wait for a clear long trigger before entering; the market is currently in a cool-off phase, not a reversal.

Btcusd sellBtcusd sell
Use proper risk management
Trump and Elon musk
#btcusd #trump #Elon
Falling low from initiate head and shoulder.
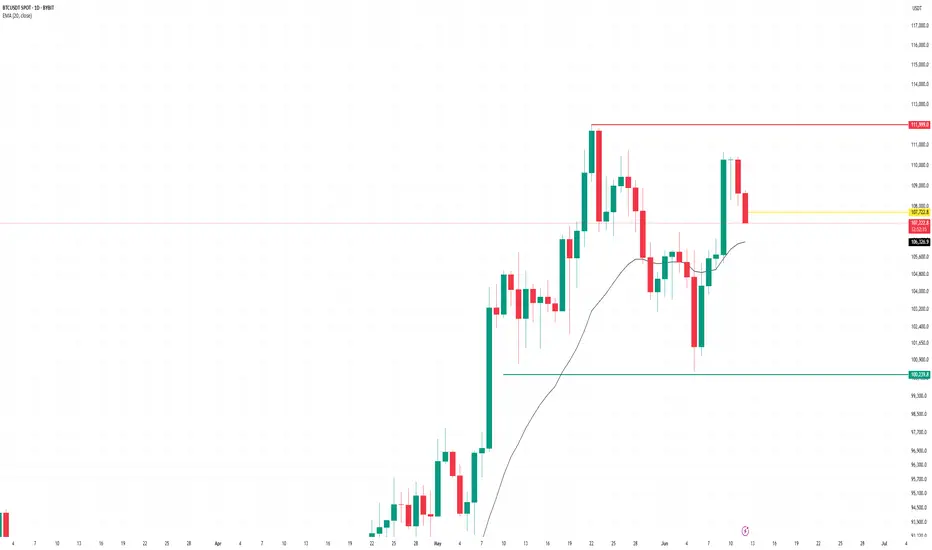
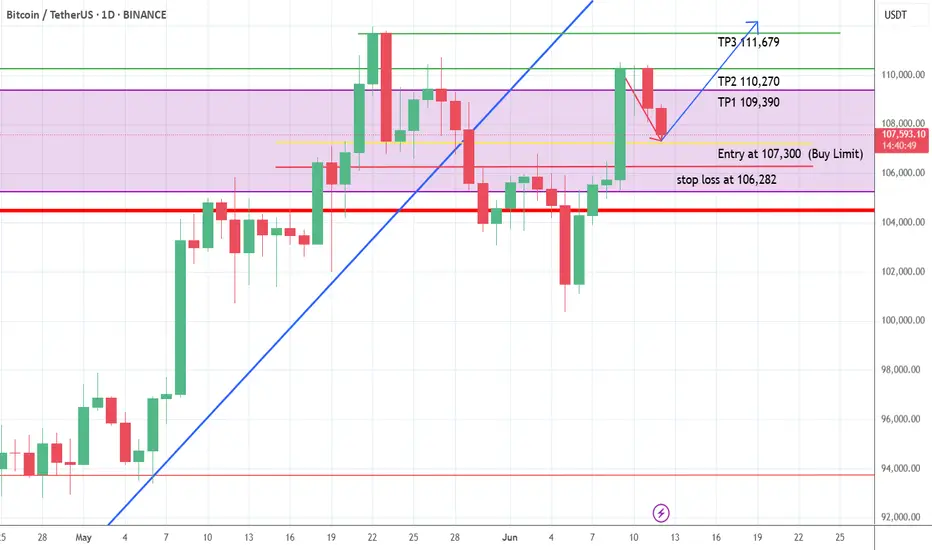
The Next BTCUSDT Bullish Rally Setup (Buy Limit Order)BTCUSDT has been in a long-term bullish trend and continues to maintain its upward momentum. Currently, the price is undergoing a minor pullback as it retests a key resistance level. Once it reaches the previous minor support zone, I expect the bullish trend to resume.
To take advantage of the next bullish move early, consider placing a buy limit order at that earlier minor support level. For proper risk management, set a stop loss slightly below the support area.
Everything is clearly illustrated on the chart provided.
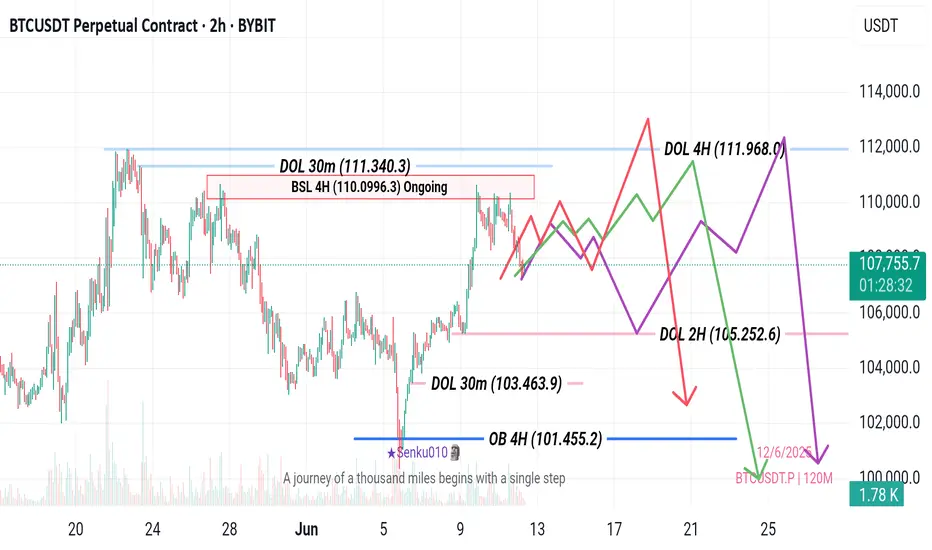
BTC Bias Update tug-of-war between key liquidity zones
• Liquidity Magnets:
• Upside: Identified Draw on Liquidity (DOL) at higher levels (e.g., 111,968.0 (4H), 111,340.3 (30m)) and an "Ongoing" BSL 4H at 110,0996.3 present resistance and potential targets for bullish moves.
• Downside: Prominent DOLs (e.g., 105,252.6 (2H), 103,463.9 (30m)) and a critical SSL zone between 100,500.0 - 100,000.0 (4H, 2H, 1H) act as significant downside targets.
Bias Assessment:
• Bearish Bias: 65%
• The immediate price action suggests a likely "Draw on Liquidity" towards the substantial Sellside Liquidity (SSL) zone around $100,000, consistent with recent minor bearish momentum.
• Bullish Bias: 35%
• The bullish case hinges on a potential strong reversal from the confluence of the $100,000 SSL and the powerful Bullish Order Block, which could then target the overhead Buyside Liquidity.
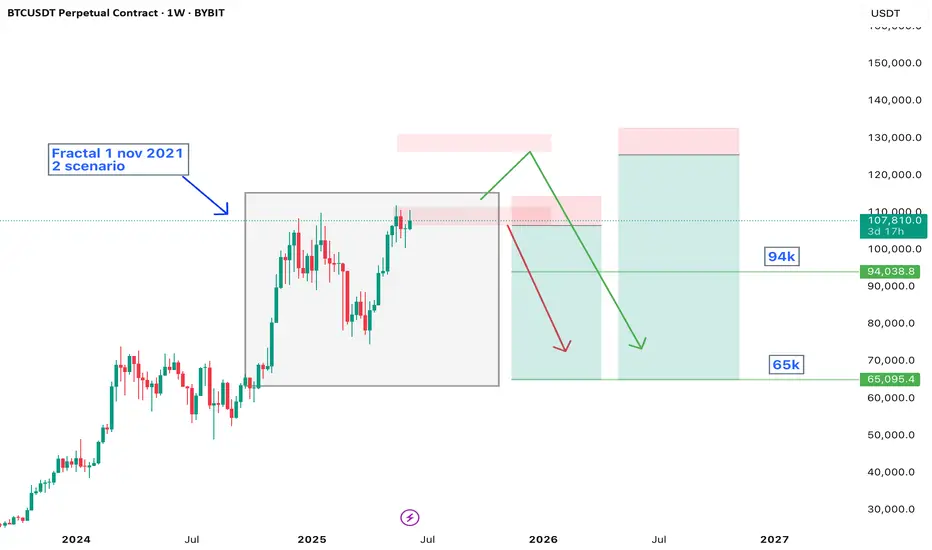
BTC game plan. 65k soon?This is my gameplan to trade Bitcoin.
Technically, there's 2 key zones to short with a nice Risk-Reward.
It's minimum profit reward on 94k, and possible to see 65k breakeven free trade.
Subscribe to earn more
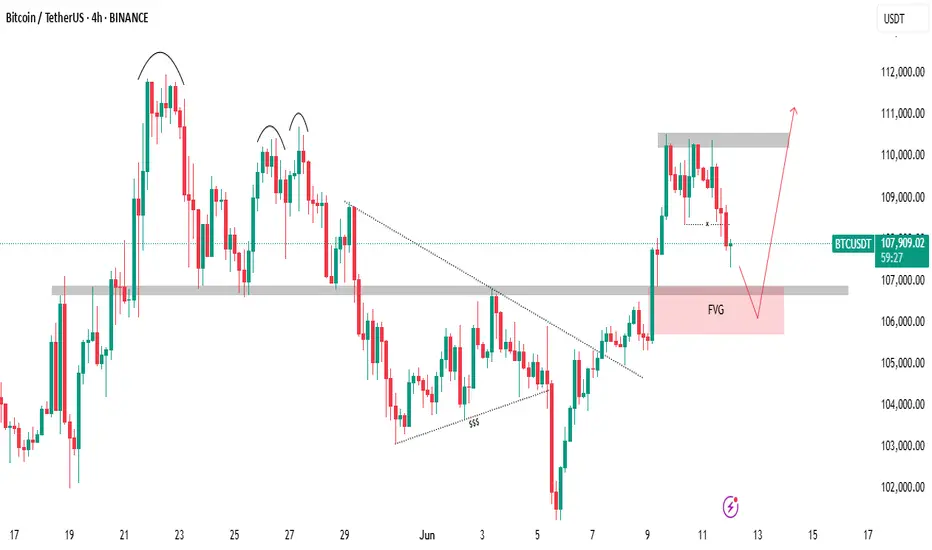
Last week Bitcoin created massive liquidity at a key resistance!🚨 Bitcoin Update – A Bullish Storm Is Brewing? 💥
Last week, Bitcoin created massive liquidity at a key resistance zone, and guess what? That liquidity is still untouched. The market hasn’t fully tapped into it yet — and that’s a big deal.
Recently, BTC smashed through resistance and even left behind a Bullish Fair Value Gap (FVG), signaling strength. But hold on—after this breakout, the market is showing signs of a minor pullback, likely to retest its marked IRL (Important Reaction Level).
📉 It’s cooling off temporarily... but don’t blink. This zone could act as a springboard for the next big leg up.
💡 Here’s the kicker: there’s still a ton of liquidity waiting above. If the market wants it—and it usually does—there’s a high probability (80%+) of another bullish push.
👀 Watch this area closely. It’s a make-or-break zone.
📊 Do Your Own Research (DYOR) – this is not financial advice, just a friendly nudge from the charts.
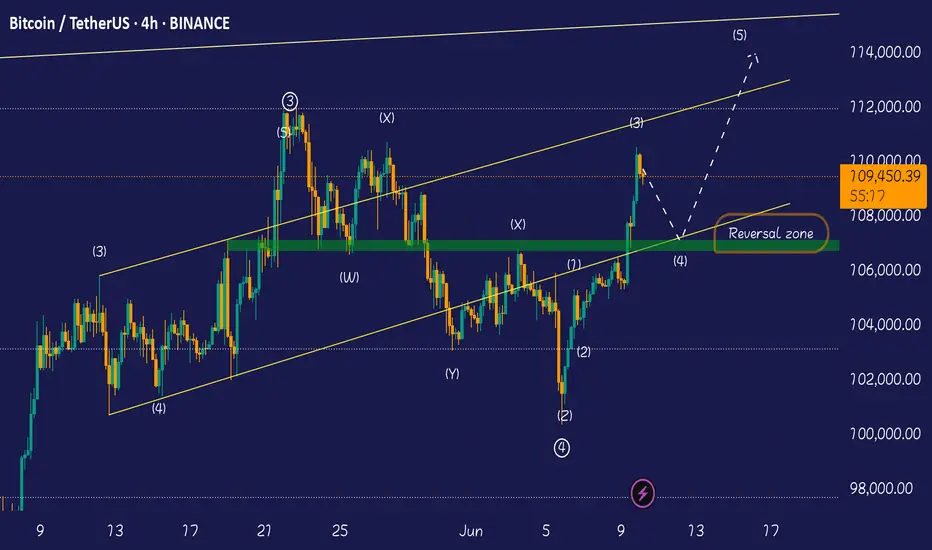
BTC CAN PUMP AGAIN AFTER A SHORT REST Bitcoin had a very strong pump from the 101 to 110k range. In my opinion, the third wave that I identified on the chart is complete and now the price can start pumping again by returning to 107k. The 107k range is an important range because the bottom of the main channel is at this price and it is also a good range for the fourth Elliott wave.
a scalp long opportunitya scalp long opportunity- btc forming a downle bottom a small scalp opptunity to 109500 and if possible 110000. lets see
Bitcoin at the Crossroads: Will BTC Breakout or Retest SupportBitcoin (BTC) – Testing Resistance, Ready for Reversal or Breakout
Technical Outlook — June 11, 2025
Current Market Condition:
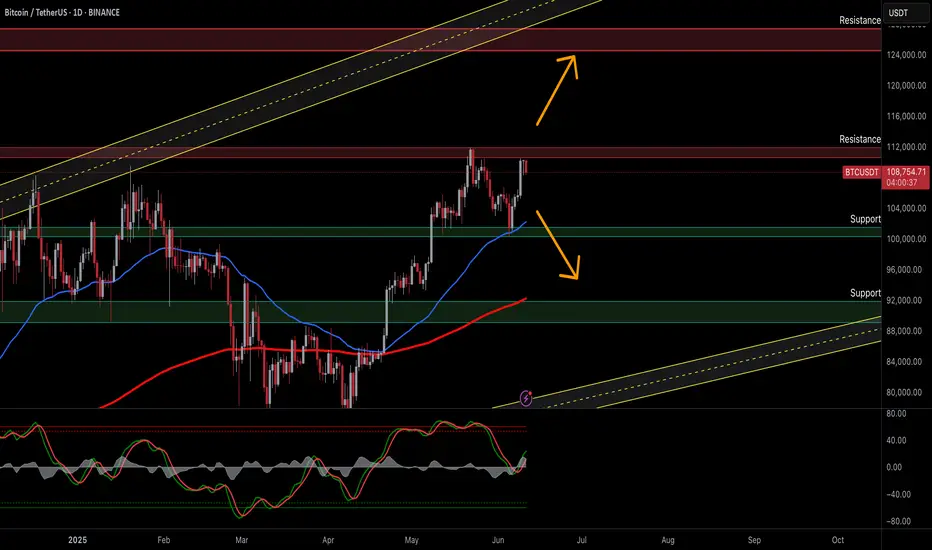
Bitcoin (BTC/USDT) is currently trading around $108,644 following a modest decline of -1.48% on the daily chart. After a bullish recovery from the $92,000–$96,000 zone, BTC has approached a strong resistance band near $112,000. The current structure suggests the market is in a critical phase — either poised to break higher or risk a deeper retracement toward key demand levels.
Key Technical Highlights:
Price is trading above the 50 EMA (blue) and the 200 MA (red), suggesting a bullish short- to medium-term bias.
The $112,000 zone is acting as a strong resistance, where BTC has previously faced rejections.
The ascending yellow parallel channel outlines the broader uptrend structure — BTC remains well within bounds, showing potential for continuation.
The Stochastic Oscillator is climbing, indicating building bullish momentum but nearing overbought territory, which could trigger short-term pullbacks.
Immediate supports are found near $104,000 and $96,000. A failure to hold above $104,000 could trigger downside pressure.
Trade Plan:
✅ 1. Bullish Breakout (Long) – Most Probable Scenario
Trigger: Daily close above $112,000 with strong volume and momentum
Target: $122,000 - $125,000
Stop Loss: Below $109,000
⚠️ 2. Bearish Rejection (Short) – Possible Scenario
Trigger: Bearish reversal candle at $112,000 or daily close below $106,000
Target: $102,000, then $92,000
Stop Loss: Above $111,000
📉 3. Dip Buy Setup – Last Scenario
Trigger: Price retests and holds $96,000 or $92,000 with a bullish reversal signal (e.g., pin bar, hammer)
Target: Immediate resistance at $104,000, then $112,000
Stop Loss: Below $91,000
Risk Management:
Always apply proper risk management, including clear stop-loss placement and responsible position sizing. Bitcoin can react aggressively to macroeconomic events and regulatory news — monitor sentiment closely when near major technical levels.
📢 If you found this analysis valuable, kindly consider boosting and following for more updates.
⚠️ Disclaimer: This content is intended for educational purposes only and does not constitute financial advice.
Bitcoin's Support in Focus: Stay Alert for Candle Closes
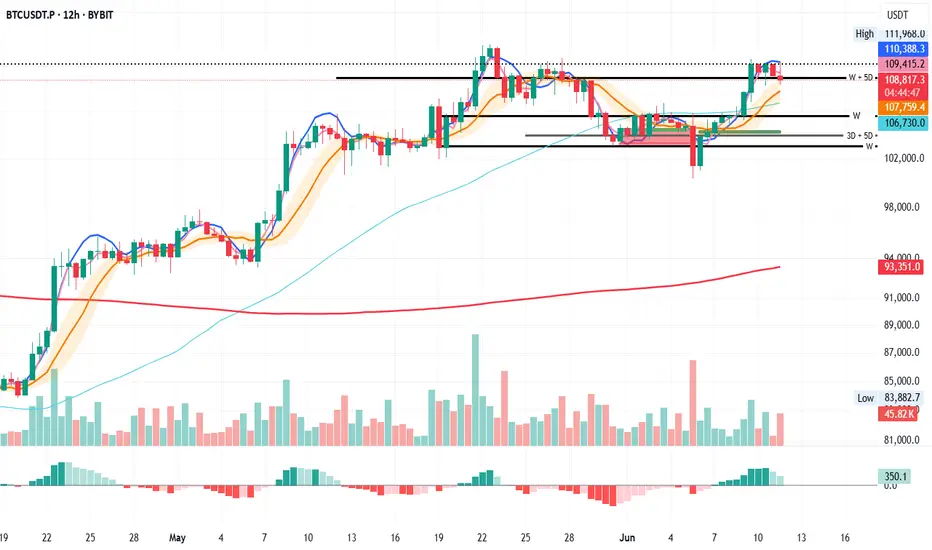
BTC on the 12H looks ready to close below the recently claimed W + 5D support.
It’s a signal to stay sharp and stick to a solid plan: but not a call to action just yet.
Let’s see how the next 3 to 5 candle closes unfold.
Always take profits and manage risk.
Interaction is welcome.
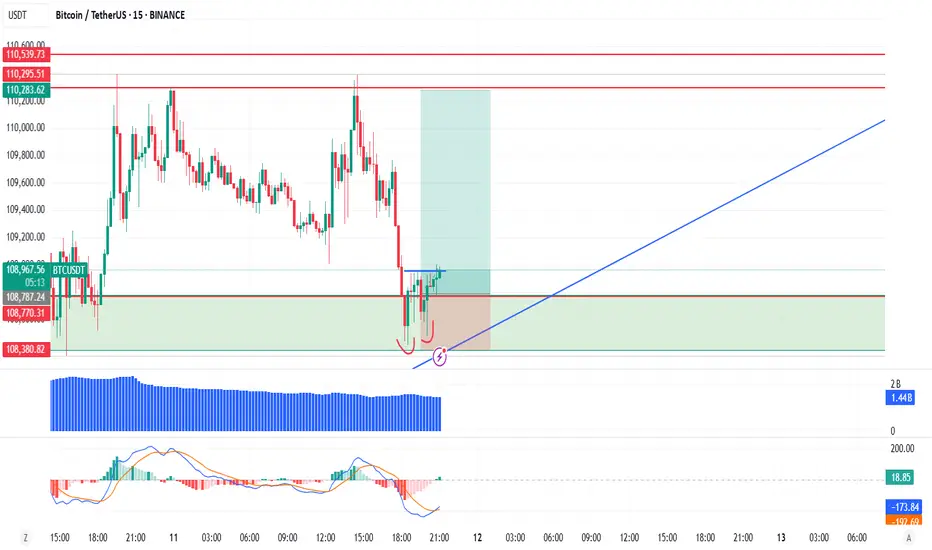
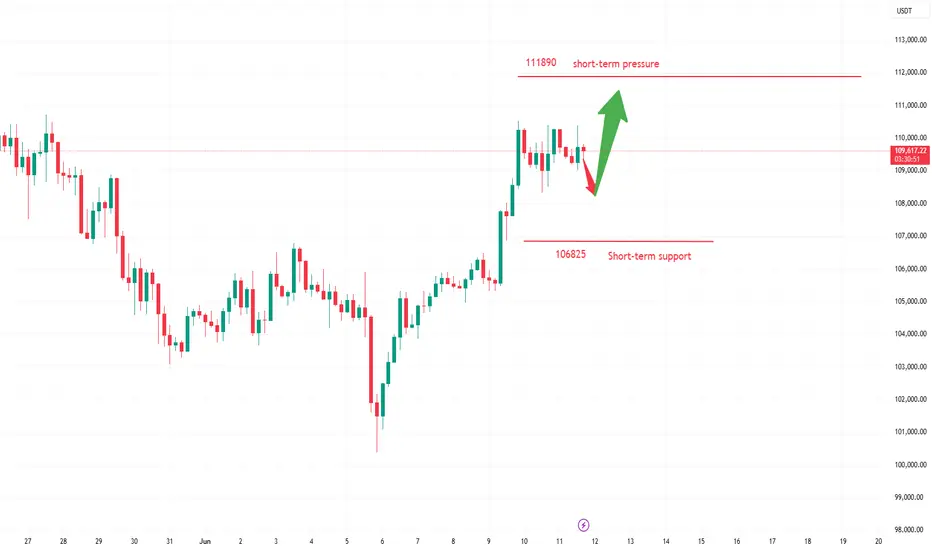
"Accumulation Phase for Breakout"Bitcoin underwent high-level consolidation on June 11, with intraday volatility ranging from $108,800 to $110,200. It failed to effectively break through the previous high of $111,980. The 24-hour global liquidations amounted to $210 million (half of the previous day), with short positions accounting for 62%, indicating that bears still dominate short-term sentiment.
The Sino-US high-level talks in London originally scheduled for June 11 have been postponed to June 15, and the details of tariff reductions remain unclear, leading to a decline in risk asset appetite. The US Dollar Index rebounded by 0.8%, suppressing Bitcoin's breakthrough momentum. Bitcoin is currently in a accumulation phase for breaking through all-time highs, with policy regularization and institutional increasing holdings forming long-term support.
Humans need to breathe, and perfect trading is like breathing—maintaining flexibility without needing to trade every market swing. The secret to profitable trading lies in implementing simple rules: repeating simple tasks consistently and enforcing them strictly over the long term.
Trading Strategy:
buy@108000-108500
TP:110500-111000
BTCUSDT – Strategy and Trend Probabilities for 2025In my opinion, Bitcoin (BTC) has become less interesting — there isn’t much room left for significant movement, and most of the “cream” has already been skimmed off. However, since it's essentially the index of the crypto market, I’m sharing this trading idea for context - to show where we currently are and what scenarios might unfold.
The price is globally moving within an ascending channel.
A secondary triangle pattern is forming.
Within this triangle, we can see the outlines of an inverse head and shoulders pattern - or possibly a cup and handle - both aligning with the channel’s resistance.
Potential scenarios:
a) Price breaks out of the triangle.
b) Price moves toward the triangle’s support, forming another wave inside it.
c) Price moves to retest the main ascending channel’s support.
d) Price fluctuates within the central range of the channel.
There aren't many options, and none of them would break the primary trend. Altcoin movements will largely depend on BTC’s behavior.
Therefore, it’s crucial to build a trading strategy that considers both the likely and less likely (but possible) outcomes.
Looking at the broader picture:
The previous minor altseason (winter 2024) was short and weak, except for a few coins.
There was no real secondary altseason in spring 2025.
Statistically, summer tends to be quiet - due to holidays and so on.
The first two points contradicted the expectations of most traders - so we’ll see how things play out with the third. If there's no altseason in summer either, then logically, winter might turn out to be quite aggressive.

BTC/USDT Analysis: Unproductive Selling Pressure
Hello everyone! This is a daily analysis from a trader-analyst at CryptoRobotics.
Yesterday, Bitcoin once again tested the sell zone at $110,000–$110,600 (profit-taking by a large player) and moved into another correction.
Looking at the current accumulation, we’ve noticed strong market selling pressure that so far hasn't led to any significant result. The seller’s momentum is weak, so most likely we’ll see another upward impulse and a test of the all-time high (ATH).
Buy Zones:
$105,800–$104,500 (accumulated volumes),
$101,600–$100,000 (zone of previous pushing volumes + current buyer defense),
$98,000–$97,200 (local support),
Level at $93,000,
$91,500–$90,000 (strong buying imbalance).
This publication is not financial advice.

Bitcoin - Price Reversal AreaAny price increase in the market must be accompanied by a price correction and a temporary decrease, and only in the currency markets of countries with weak economies can currencies be found that always move in the same direction against strong currencies. This rule is the same in digital currencies and the crypto market. Supply and demand, fear and greed, cause increases and decreases. These drops are not a reason for a permanent decrease, and increases will definitely begin in the next few days. If the price of Bitcoin decreases again, you can use the specified support area to enter a new purchase.
Sasha Charkhchian
