Bitcoin’s Next Big Move? Watch This Before It Happens!In today’s class, we broke down the next key Bitcoin setups. We analyzed past price action to help predict future moves, and we're patiently waiting for bullish continuation – but we’re also staying cautious of a possible range deviation from Monday’s high.
Stay sharp and be prepared for both scenarios!
Follow to stay on top if the curve.
BTCUSDT.5L trade ideas

$BTC - Top Down BYBIT:BTCUSDT.P Top Down (10/06/25)
V-Levels Bias
Weekly = Bullish
Daily = Bullish
10-Hour = Bullish
1-Hour = Bullish
V-Levels Momentum
Weekly = Bullish
Daily = Bullish
10-Hour = Neutral
1-Hour = Neutral
Analysis & Insights
DeCode Market Breakdown
Macro Context
Overall, the Weekly structure remains bullish — both in bias and momentum. We’re trading below a key level at $111,968.0, and continuation is likely unless we see a clear Failed Auction at that level.
That would trigger some serious red flags and force a reevaluation of the directional bias.
Daily Chart
Daily structure is extremely bullish at the moment.
The price recently showed a Failed Auction around the $102,000.0 V-structure Higher Low — indicating aggressive absorption and buyer strength.
As long as price holds above that area, the priority is to stay on the long side.
⸻
10-Hour Chart
Still holding a bullish structure overall.
One thing I’ll be watching closely: the price reacting to the previous High at $110,660.8.
If we get a rejection + Failed Auction at that level, that opens up the possibility for intraday shorts; as a short-term shift in momentum and local resistance kicks in.
1-Hour Chart
📈 Long Setup: Waiting for a clean entry from an OTE / Fib zone + Over/Under structure.
📉 Short Setup: Watching for a sweep of the current highs + a clear Failed Auction (ideally with footprint confirmation).
There’s visible compression between $104k and $105k, so price might look to grab liquidity there first before any real move upward.
10-Min Chart
Currently, no clear trade setups on the 10M.
The 1H hasn’t reached optimal trade zones yet. I’ll be watching closely for any structure shifts or setups aligning with the macro bias.
⸻
🔍 Trading Plan Summary
Bias: Bullish (Weekly + Daily)
Look for longs aligned with HTF support + intraday confirmation
Short opportunities only if we get clear rejection from $110,660.8 + footprint signals
The bulls' strong momentum drives a new all-time high.hour gain stands at 4%, and the weekly increase expands to 6.7%. The total market capitalization has rebounded above $2.5 trillion. Three major positive factors have resonated: the expectation of (eased) Sino-US trade tensions, the SEC's policy shift to support on-chain innovation, and the continuous inflow of institutional capital (notably, Ethereum ETFs have seen 15 consecutive days of net inflows).
For the next 24 hours, the focus will be on the breakthrough of the all-time high at $111,980. The first resistance level is $112,500 (a dense short liquidation zone).
Humans need to breathe, and perfect trading is like breathing—maintaining flexibility without needing to trade every market swing. The secret to profitable trading lies in implementing simple rules: repeating simple tasks consistently and enforcing them strictly over the long term.
Trading Strategy:
buy@107000-107500
TP:109000-1095000
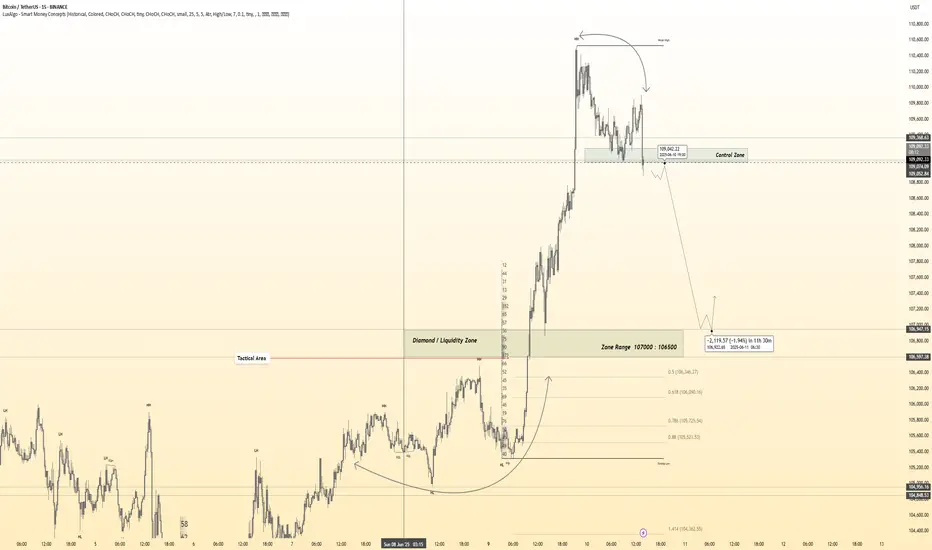
Hanzo / BTC 15 Min ( Accurate Tactical Bearish Breakout )🔥 BTC – 15 Min Scalping Analysis
⚡️ Objective: Precision Breakout Execution
Time Frame: 15-Minute Warfare
Entry Mode: Only after verified breakout — no emotion, no gamble.
👌Bearish Break : 109000
Price must break liquidity with high volume to confirm the move.
☄️ Hanzo Protocol: Dual-Direction Entry Intel
➕ Zone Activated: Strategic liquidity layer detected — mapped through refined supply/demand mechanics. Volatility now rising. This isn’t noise — this is bait for the untrained. We're not them.
🩸 Momentum Signature Detected:
Displacement candle confirms directional intent — AI pattern scan active.
— If upward: Bullish momentum burst.
— If downward: Aggressive bearish rejection.
🦸♂️ Tactical Note:
The kill shot only comes after the trap is exposed and volume betrays their position.
Bitcoin done and next target - $96,000⚡️ Hello everyone! Bitcoin reached $110,000 and everyone started celebrating. The market also rebounded slightly. But is everything really that great, and what's next for BTC?
Let's take a look:
Bitcoin is now undergoing a correction after reaching the $110,000 level. The rest of the market looks more buoyant than the first cryptocurrency. ETH is already trading at $2,700, pulling many altcoins with it. Apparently, position fixing in Bitcoin and liquidity spillover into altcoins have begun.
➡️ There is practically no liquidity left at the top. At the $110,000 level, only 100 million shorts were liquidated. According to the liquidation map, if the price drops to $100,000 right now, more than $10 billion in longs will be liquidated!
➡️ Two gaps have also formed below us: 102,800 - 96,990 and 93,310 - 88,470. And as we know, in 99% of cases, gaps close sooner or later.
⚙️ Metrics and indicators:
Money Flow - liquidity inflow is still positive overall. However, since May 22, profit-taking has continued and liquidity has been decreasing.
Volume - divergence in volumes. Purchasing power is weakening as prices rise, which means that there is little chance of moving much higher from these levels. There is still a lack of liquidity in the market.
Liquidation Levels - there are two more obvious short stop zones above. But globally, there is now much more liquidity below than above. So if we fail to consolidate above the $108,600 level, the market is likely to go lower.
DSRZ - the nearest strong support level is at 99,800 - 99,900. This is the first zone of potential price reversal back to growth in the event of a correction.
📌 Conclusion:
I continue to say that it is summer now and liquidity in the markets will be decreasing. No matter how good things look now. At the first signs of weakness, positions will be closed instantly. No one wants to spend their vacation days watching the market.
Especially in a market where any news from Trump can cause prices to drop by several percent in the blink of an eye.
⚠️ I see two options:
It will be an exceptional summer. Bitcoin will spend it in the range of 108,000 - 88,000. And in the fall, when everyone expects growth, it will begin to decline. This cycle is already different from others, so I wouldn't be surprised by that.
It will be a standard summer, and by July we will begin a slow and dull correction. To return to growth in the fall.
Write your opinion and have a good week, everyone!

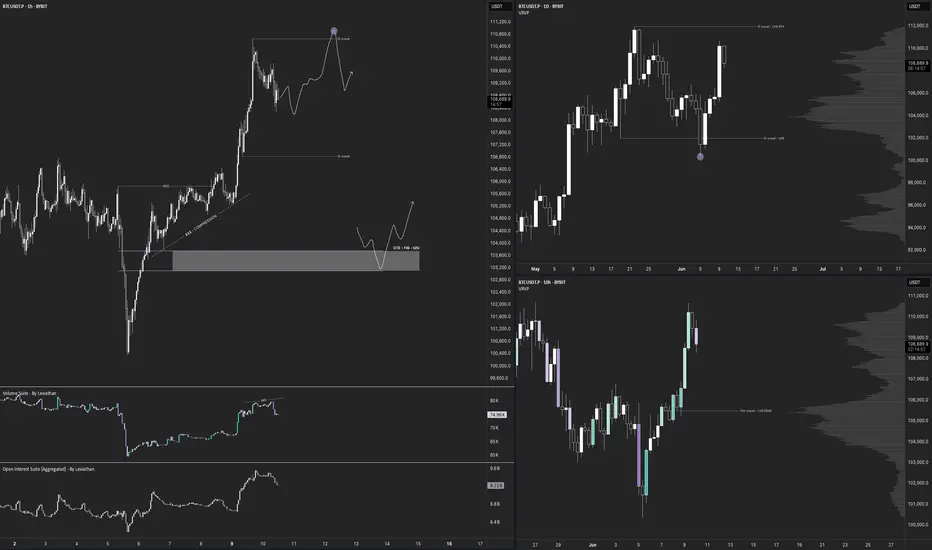
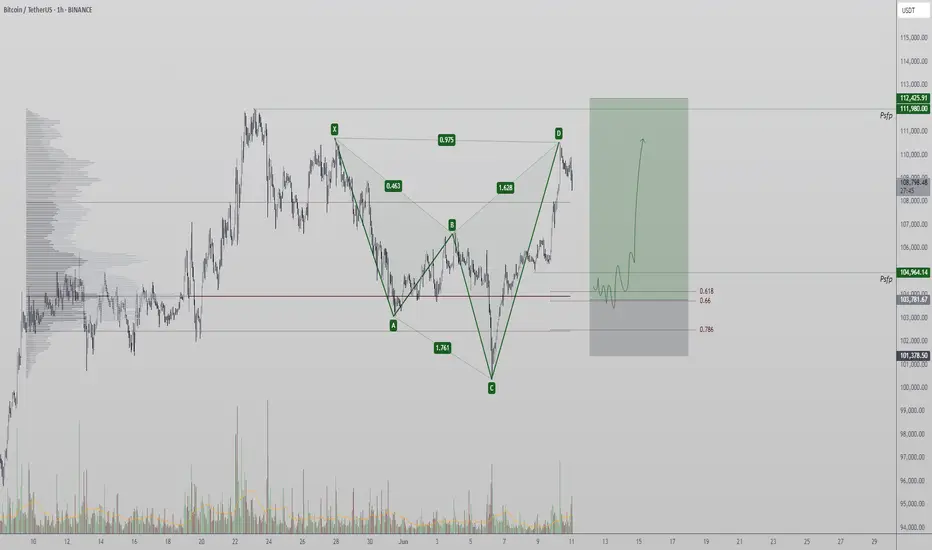
Bearish Shark Harmonic: Bitcoin Faces Potential PullbackBitcoin has confirmed a bearish shark harmonic on the intraday timeframe, indicating potential for a short-term correction. Volume remains average, with no signs of a short squeeze behind the move, increasing the likelihood of a reversal back into key volume zones.
Key Highlights:
Price testing the Value Area High — a key inflection level
Downside targets: Point of Control and 0.618 Fibonacci retracement
No short squeeze detected — risk of long squeeze triggering range rotation
Today's Bitcoin Signal: Time to be braveHello friends🙌
Given the good price movement from support and buyers entering, now we can enter the position with capital and risk management and move with it to the specified targets.
🔥Join us for more signals🔥
*Trade safely with us*

Waiting for confluence on PAR & TSI before entering a tradeWaiting for confluence on PAR & TSI before entering a trade. Put SL over swing high or low

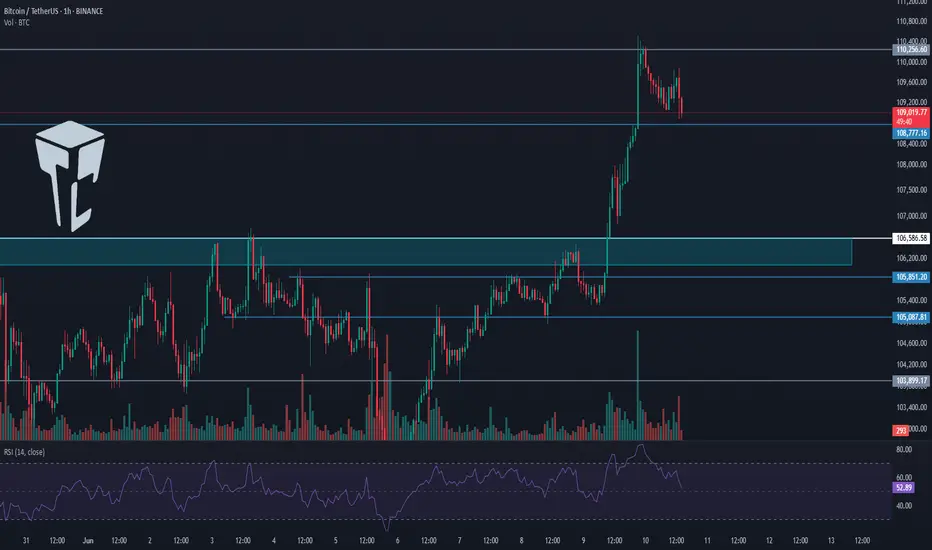
TradeCityPro | Bitcoin Daily Analysis #113👋 Welcome to TradeCity Pro
Let’s dive into the Bitcoin analysis and key crypto indexes. As usual in this analysis, I’ll walk you through the futures triggers for the New York session.
⏳ 1-Hour Timeframe
As you can see in the one hour timeframe, Bitcoin has continued its upward movement and reached the 110256 level and is now undergoing a correction.
✔️ If the price continues correcting, the next support level will be 108777. In case of a deeper pullback, the next area to watch is 106586.
📈 For a long position, our first trigger level is 110256, with a target of 111747.
📊 Market volume is currently increasing, and if this inflow of buy volume continues, the probability of a bullish move increases.
💥 The RSI oscillator has dropped below the 70 level. If RSI reenters the overbought zone, we’ll also get a strong momentum confirmation.
👑 BTC.D Analysis
Let’s take a look at Bitcoin Dominance. Today, it finally closed below the 64.49 level and has dropped to 64.12.
⚡️ This drop has allowed capital to flow into altcoins, and many of them are moving upward today. If 64.12 breaks, the downtrend may continue.
📅 Total2 Analysis
Moving on to Total2, this index finally broke above the 1.21 level and is now heading toward 1.24.
💫 At the moment, there is no major resistance preventing the market from continuing its upward trend. But there’s an important point regarding USDT Dominance, which I’ll cover below.
📅 USDT.D Analysis
During this bullish move in the market, the dominance of Tether hit the support at 4.56, while other indexes and most altcoins activated their triggers.
🔑 The key point here is that Tether Dominance has such a significant influence on the market that the inability to break this support has caused the entire market, including Bitcoin, to start correcting.
🔽 The 4.56 level in USDT Dominance is very important and will be the key to triggering the next bullish leg.
❌ Disclaimer ❌
Trading futures is highly risky and dangerous. If you're not an expert, these triggers may not be suitable for you. You should first learn risk and capital management. You can also use the educational content from this channel.
Finally, these triggers reflect my personal opinions on price action, and the market may move completely against this analysis. So, do your own research before opening any position.
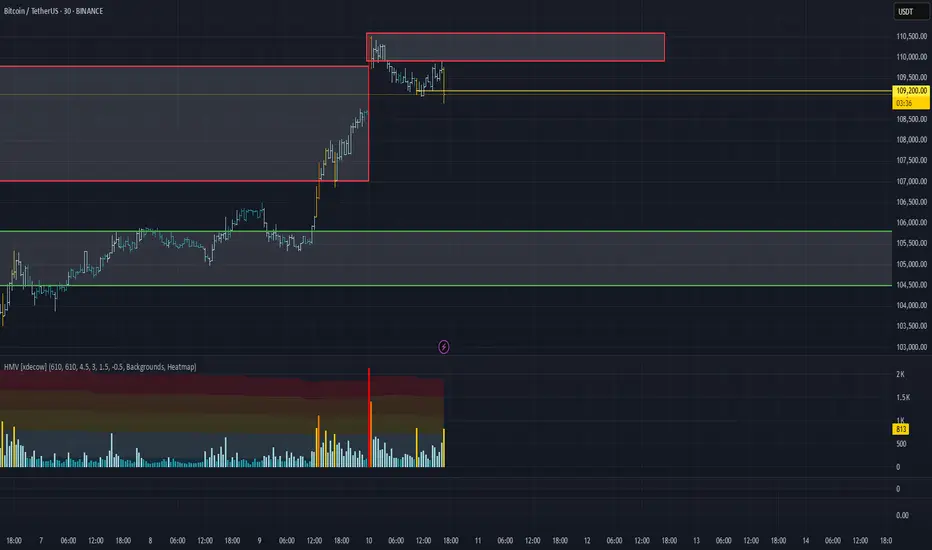
BTC/USDT Analysis: Best Long Entry Zones
Hello everyone! This is a daily analysis from a trader-analyst at CryptoRobotics.
After a strong breakout through the high-volume zone of $104,500–$105,800 and a full trend reversal to the upside, Bitcoin has reached its resistance zone at $107,000–$109,800 (accumulated volumes). At the upper boundary of this range, strong volume anomalies and profit-taking were recorded. The global trend remains bullish, but currently, there is a possibility of a strong correction down to the $105,800–$104,500 zone (accumulated volumes), which also roughly coincides with predictive liquidations that act as a magnet for the price.
An initial correction has already begun, but strong absorption of selling pressure has appeared around ~$109,200. If this level is breached without a renewed defense, the likelihood of further decline increases.
Sell Zone:
$110,000–$110,600 (profit-taking by large players).
Buy Zones:
$105,800–$104,500 (accumulated volumes),
$101,600–$100,000 (zone of previous pushing volumes + current buyer defense),
$98,000–$97,200 (local support),
Level at $93,000,
$91,500–$90,000 (strong buying imbalance).
This publication is not financial advice.
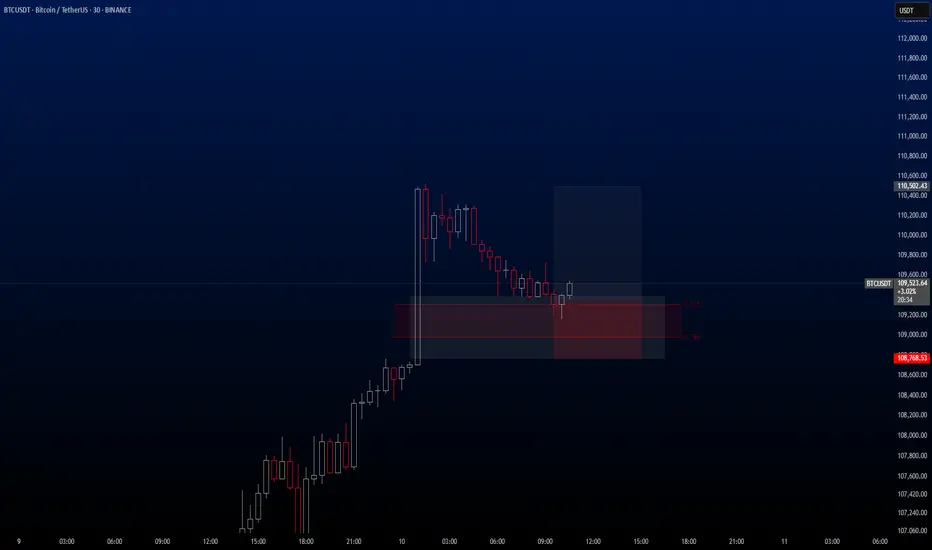
BTCUSDT Hello traders. I’ve spotted an ideal entry opportunity on the BTCUSDT pair. I’ve taken the trade and wanted to share it with you as well.
🔍 Trade Details
✔️ Timeframe: 15-Minute
✔️ Risk-to-Reward Ratio: 1:2
✔️ Trade Direction: Buy
✔️ Entry Price: 109,357.89
✔️ Take Profit: 110,502.43
✔️ Stop Loss: 108,768.53
🔔 Disclaimer: This is not financial advice. I’m simply sharing a trade I’ve taken based on my personal trading system, strictly for educational and illustrative purposes.
📌 Interested in a systematic, data-driven trading approach?
💡 Follow the page and turn on notifications to stay updated on future trade setups and advanced market insights.
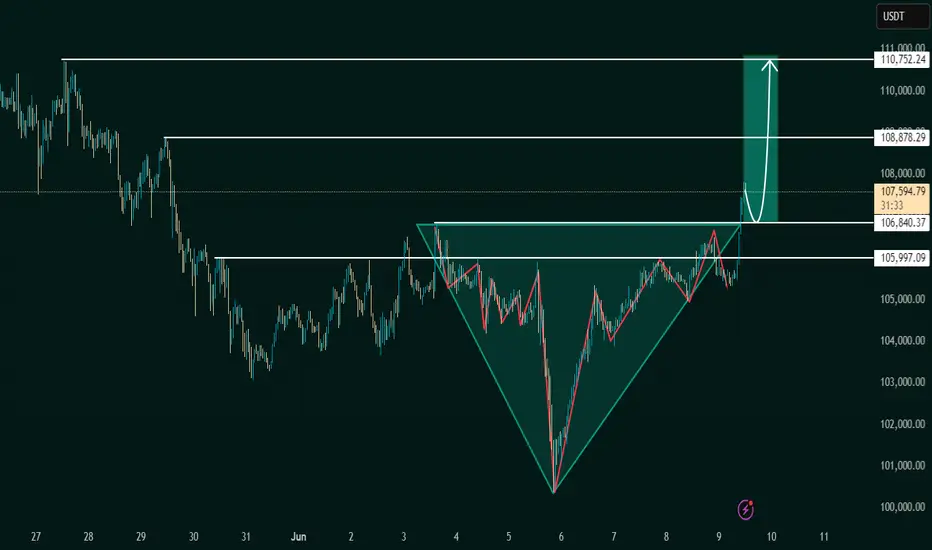
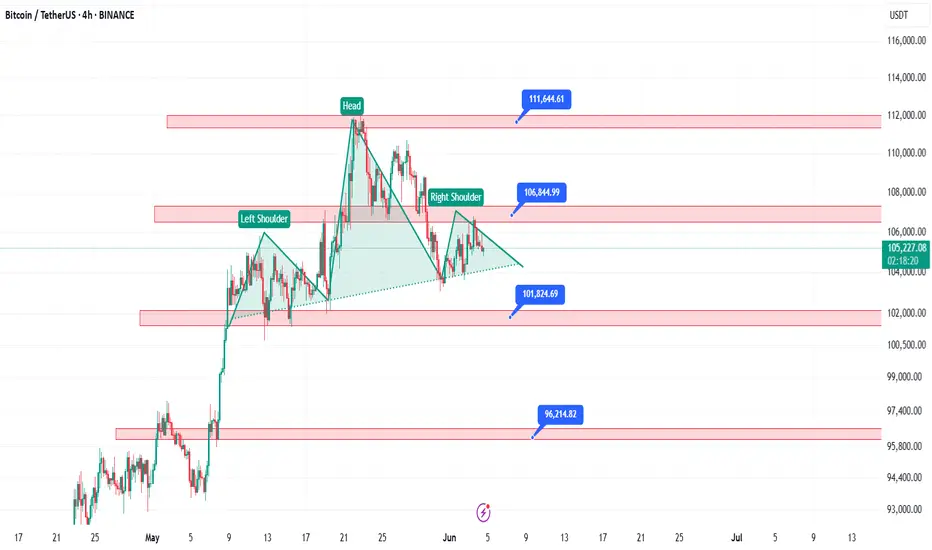
Inverse Head and Shoulders Breakout Signals BullishThe chart under review presents a classic Inverse Head and Shoulders pattern, a reliable and widely recognized bullish reversal formation in technical analysis. This structure typically forms after a downtrend, indicating a potential shift in market sentiment from bearish to bullish.
The pattern is composed of:
Left Shoulder: A modest price decline followed by a temporary upward correction.
Head: A deeper price decline forming the lowest point in the pattern.
Right Shoulder: A higher low that mirrors the left shoulder, followed by another upward movement.
The neckline, which acts as a critical resistance level, is clearly illustrated at approximately 106,840.37 USDT. A confirmed breakout above this neckline suggests the completion of the reversal pattern and validates the potential for a sustained bullish movement.
2. Breakout Confirmation
The current price action confirms a successful breakout above the neckline, with the market currently trading around 107,586.58 USDT. This breakout is a key signal for bullish continuation, provided it is supported by increased volume and follow-through price action.
From a technical standpoint, the breakout is reinforced by:
A clean violation of neckline resistance
Price consolidation near breakout zone before a strong upward thrust
Higher lows preceding the breakout, indicative of growing buying pressure
This confluence of technical signals strengthens the case for an upward price trajectory in the near term.
3. Projected Price Targets
Upon confirmation of the Inverse Head and Shoulders breakout, target levels can be derived using the measured move technique. This involves projecting the vertical distance from the head to the neckline upward from the breakout point.
Target 1 (Initial Resistance):
108,878.29 USDT – This level represents a potential short-term resistance where price may consolidate or retrace slightly before continuing.
Target 2 (Measured Move Completion):
110,752.24 USDT – This is the ultimate price target derived from the height of the head-to-neckline structure. Reaching this level would represent the full realization of the reversal pattern.
4. Key Support and Risk Levels
Risk management is a critical component of any trading strategy. The following support levels should be closely monitored:
106,840.37 USDT (Neckline Support):
Former resistance turned support. Holding above this level post-breakout is essential for sustaining bullish momentum.
105,997.09 USDT:
Acts as a secondary support level and potential stop-loss region for conservative traders.
If price fails to hold above the neckline and falls back below these levels, the breakout could be classified as a false breakout, warranting caution.
5. Strategic Implications for Traders
This setup provides a favorable risk-to-reward ratio for long entries, particularly for traders seeking to capitalize on momentum-based patterns. An optimal trading approach could involve:
Entry: Near the neckline breakout or on a minor retest of 106,840.37 USDT
Stop-Loss: Below 105,997.09 USDT or under the right shoulder to account for volatility
Take-Profit Zones: Partial profits near 108,878.29 USDT, with final target at 110,752.24 USDT
6. Final Remarks
This chart illustrates a textbook example of a bullish reversal pattern in play. While the technical outlook is favorable, traders should remain cautious of potential invalidation scenarios, especially in highly volatile or news-driven markets. Confirmation through volume analysis and supportive macro/fundamental conditions can further enhance confidence in the bullish thesis.
Overall, the current setup indicates a well-structured opportunity for upward price movement, with a clearly defined entry, risk, and reward framework.
Let me know if you'd like this tailored for a trading journal, client report, or automated strategy setup
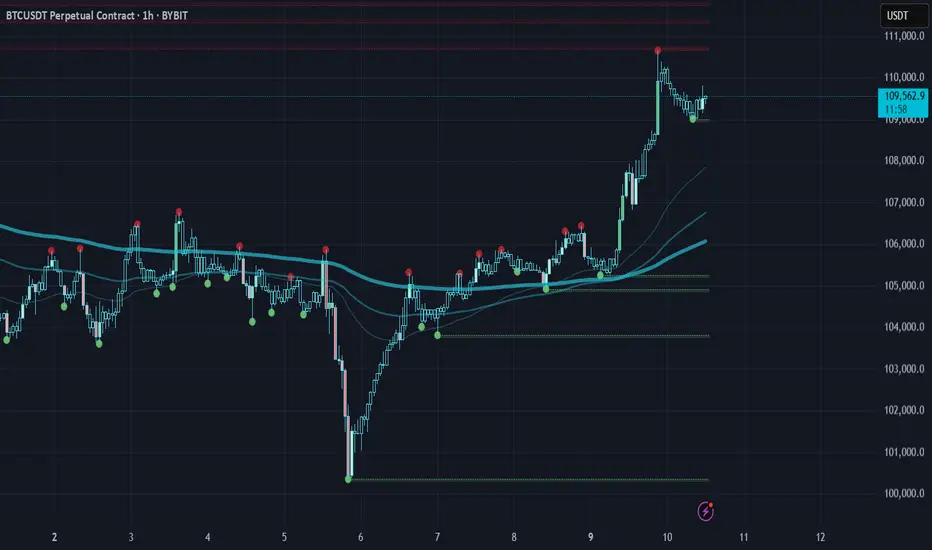
Bitcoin H1: Effort vs Result Breakdown!Massive selling volume spikes near the last swing low, but price reversal came in strong! 📉➡️📈
The law of Effort vs Result at play:
Effort: Sellers dumped hard, but the result? A bullish reversal 🚀
Result: Price back above key levels and closing near $109.5K. 💥
🔮 Price Target:
→ Immediate Resistance: $110K
→ Next Extension: $112K
This move shows that even with high volume sell-offs, buyers are in control. 🚀💰
BTC - TradeRight now, we're seeing resistance at the former ATH.
If we manage to break out of this area, I think we’ll likely shoot past the current ATH, possibly into price regions of .
But nobody knows the exact price.
LFG!

BEARS INTO MARKET FOR BTC SELL COMINGHi Guys Expecting some sell for BTC
I can see some Seller walk into market thats possible will sell next few days
Lets see what happens
Best of luck

BTC: Strong bullish trend, key resistance 111–112k in focus__________________________________________________________________________________
Technical Overview – Summary Points
__________________________________________________________________________________
Strong bullish momentum across all timeframes (1D to 15min).
Major supports: 100335, 104940, 106743 – multi-timeframe confluence, natural risk management levels.
Key resistances: 109952 – 111949 (historical pivot zones).
Risk On / Risk Off Indicator clearly favoring "Risk On" (strong buy). Tech sector in leadership mode, favorable context.
Volumes normal to moderately elevated, no major behavioral anomalies (ISPD DIV neutral).
No significant divergence between technical and behavioral indicators detected.
__________________________________________________________________________________
Strategic Summary
__________________________________________________________________________________
Overall bias : firmly bullish, but tactical caution just below 111,000–112,000.
Opportunities : prioritize buys/reloads on pullbacks to 104,900–100,300.
Risk zones : clean break below 103.7k ⇒ risk of acceleration to 95.6k; invalidation if daily close <103,700$ or >2 sessions <97,100$.
Macro catalysts : Fed decision (06/18), US CPI (06/12), Trump speech (06/10); anticipate higher volatility.
Action plan : engage tactically below resistance; recommended swing stop-loss at $97,000; active management after each catalyst event.
__________________________________________________________________________________
Multi-Timeframe Analysis
__________________________________________________________________________________
1D : Massive support 100k-103k, critical resistance 111–112k. Robust momentum and context, no behavioral overheating.
12H : Steady staircase progression, intermediate supports respected (104940–106743), healthy volumes, ongoing up-trend.
6H : Bullish background, no excessive flow or defensive behavioral signals.
4H : Resistance zone test (111949–109952), structure remains solidly up, no reversal detected.
2H : Slightly rising volumes on resistance test, no behavioral excess. Positive momentum.
1H : Active resistance test, moderate volumes. Bullish structure intact.
30min : Micro-consolidation below resistance, no excessive volume/behavior. Trend up.
15min : Volume spike on last upward move, rapid normalization. Reload possible if breakout above 110k is confirmed.
Multi-timeframe summary : Bullish confluence, no strong reversal signal as long as support at 103.7k holds.
Risk On / Risk Off Indicator : Strong buy, tech sector leading, no structural risk detected in capital rotation.
__________________________________________________________________________________
Synthesis & Decision-Making
__________________________________________________________________________________
Dominant structure : BTC market structurally bullish, supported by multi-timeframe converging supports and solid tech sector.
No behavioral anomaly (ISPD DIV neutral); volumes under control; only vigilance below 111–112k due to matured seller pressure.
Macro context : Fed’s rates unchanged expected, major catalysts nearing with potential for significant volatility.
On-chain analysis : active distribution from long-term holders, critical area 103.7k–97.1k, demand must absorb “long-duration” supply.
Trading recommendation : favor buys/reloads on pullback (104,900–100,300); tactical caution under 111–112k; swing stop-loss at $97,000 advised.
BTC structurally bullish, but approaches a critical phase: robust multi-timeframe supports, positive macro momentum, no excessive behavioral exuberance. Heightened vigilance required below 111–112k due to pressure from long-term holders; dynamic risk management needed around major macro events.
__________________________________________________________________________________

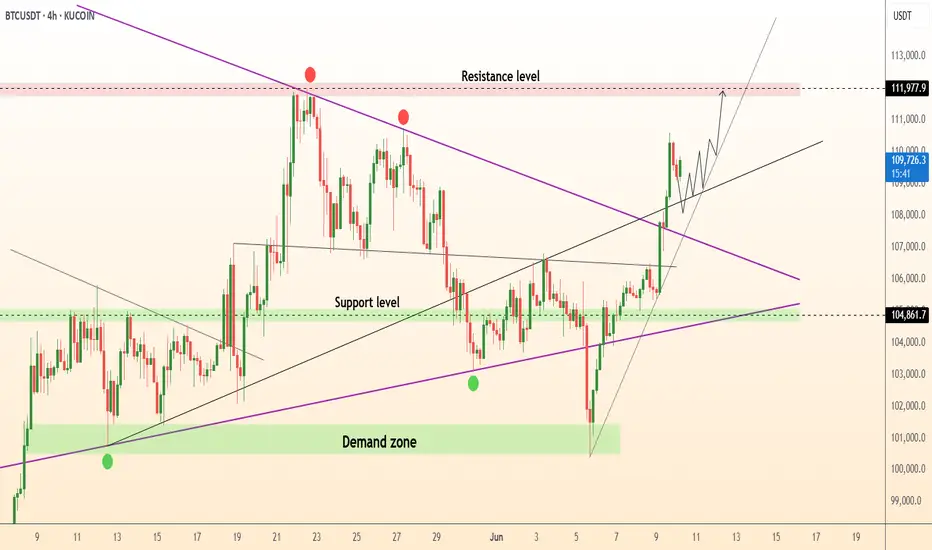
DeGRAM | BTCUSD fixed above the downtrend line📊 Technical Analysis
● Bulls pierced the descending purple trend-line and closed two candles above the 106 k pivot, confirming a pennant breakout and resetting higher-lows along the black mid-channel.
● Re-test of 104.8 k demand (green band) held as support; the new up-sloping flag projects to the 111.8 k-112 k red supply at the channel roof, with dynamic backup now rising to 103.8 k.
💡 Fundamental Analysis
● U.S. CPI whispers point to a softer June headline while spot-ETF cohort added another 3 200 BTC in two sessions and exchange reserves keep declining, underscoring supply squeeze amid easing rate fears.
✨ Summary
Long 104.8-106 k; sustained trade >107 k targets 111.8 k → 115 k. Bull thesis void on a 4 h close below 99 k.
-------------------
Share your opinion in the comments and support the idea with a like. Thanks for your support!
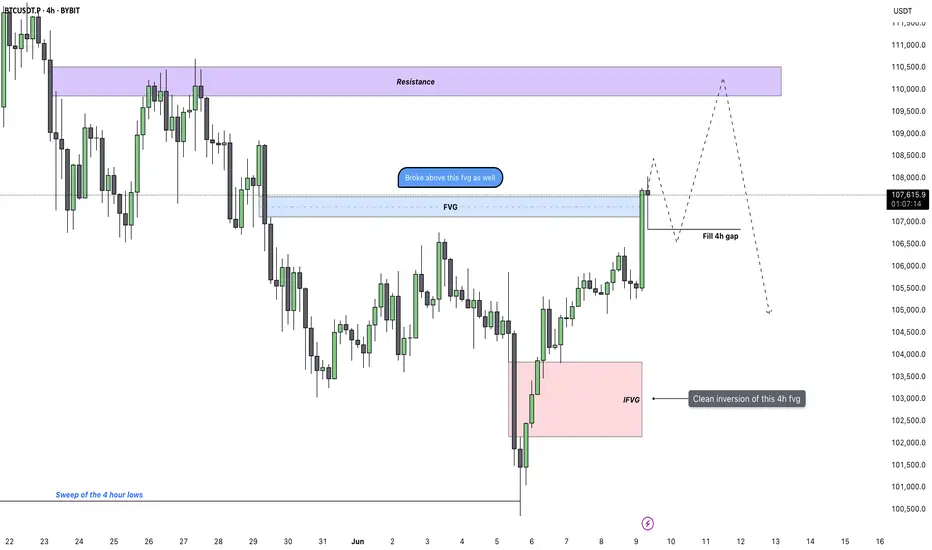
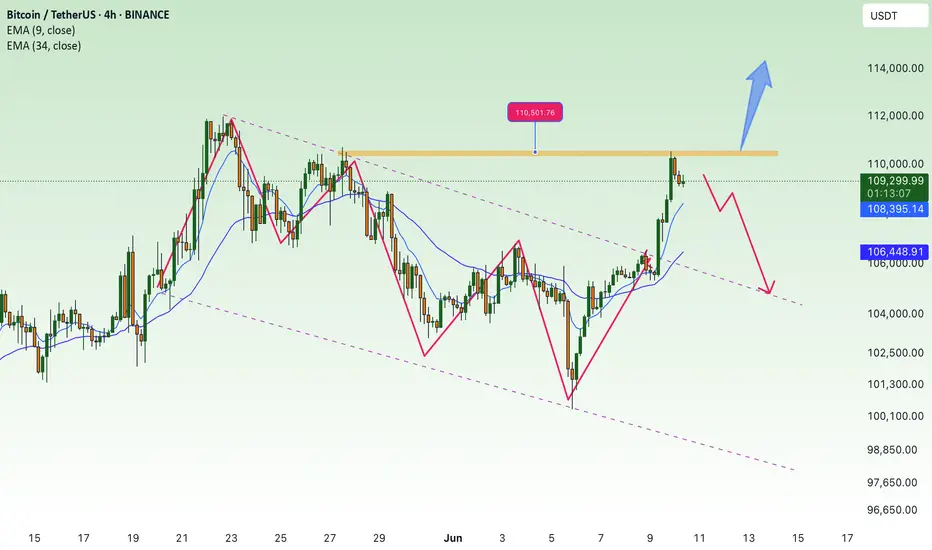
Bitcoin - Bulls in Control: Aiming For $110kBitcoin has just confirmed a strong bullish breakout after consolidating beneath a prior fair value gap. The market not only broke out of that zone cleanly but did so with conviction, creating a new inversion fair value gap (IFVG) along the way. This type of structure often indicates a shift in sentiment, especially when paired with increasing volume and impulsive candles.
Fair Value Gap Break and Continuation Context
Following the breakout, price surged straight through another 4H FVG overhead, flipping it with strength and no hesitation. That kind of move shows clear intent. The market didn't pause or stall at resistance, which increases the probability that the same pattern could play out again, clean break, shallow pullback, and continuation. The breakout level now holds as short-term support.
Near-Term Expectations – FVG Fill Before Higher
With this latest 4H candle close, I’m now expecting a short pullback to fill the newly created 4H FVG below. This would provide the market with the fuel it needs to continue higher without leaving inefficient price action behind. The structure is setting up a classic breakout-fill-continue sequence, and the next key objective sits just below a clear resistance zone overhead.
Conclusion
Bitcoin broke out of a compression zone, formed an IFVG, and followed up with a strong push through the next fair value gap. I’m expecting a controlled retracement to fill the new 4H imbalance, after which price could continue pushing toward the major resistance area. The momentum is clean and structured—until that changes, continuation remains the more likely path.
___________________________________
Thanks for your support!
If you found this idea helpful or learned something new, drop a like 👍 and leave a comment, I’d love to hear your thoughts! 🚀
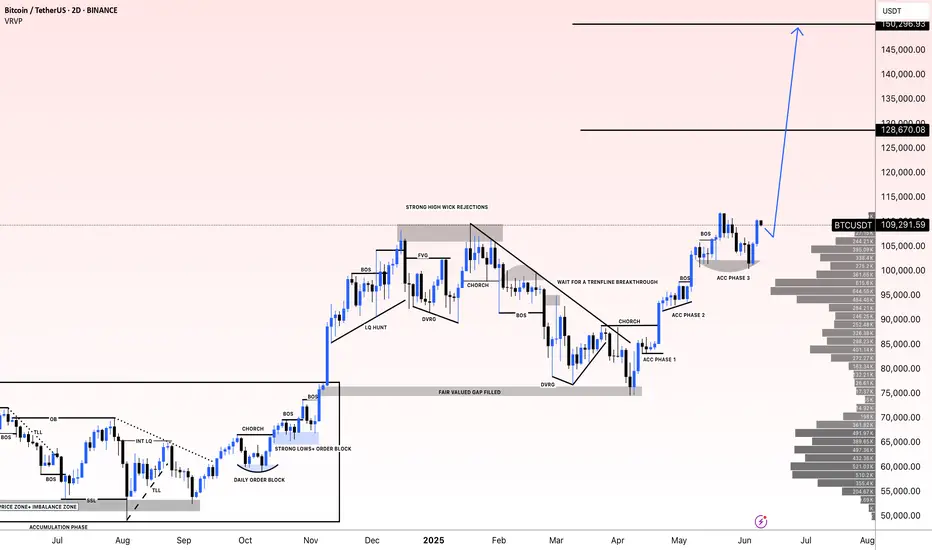
#BTCUSDT(BITCOIN): Two Targets First $130,000 And Then $150,000Bitcoin is poised for significant distribution, with a potential price surge to $130,000, followed by a swing target of $150,000. The current accumulation phase is poised to transition into a substantial bullish move. We anticipate a surge in bullish volume in the coming days or weeks. Our analysis anticipates this transition to be completed by the end of the year or sooner.
It is important to note that this analysis does not guarantee a specific price movement and is provided solely for educational purposes.
We extend our best wishes for your successful trading endeavours. If our analysis has been of assistance, we would appreciate it if you could express your gratitude by liking and commenting.
For further insights, please follow our account.
Team Setupsfx_
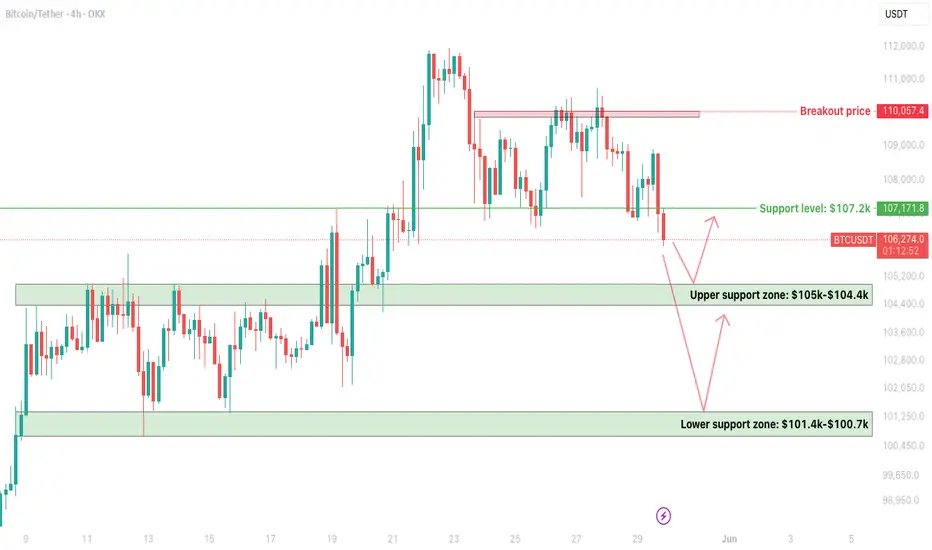
BTC 4H – Critical Support Zones Being TestedCRYPTOCAP:BTC is currently retesting its $107.2k support, which has now turned into resistance after a decisive breakdown.
Support Levels to Watch:
- Upper Support Zone: $105k – $104.4k
- Lower Support Zone: $101.4k – $100.7k
Bounce from $104.4k–$105k will be a temporary relief, but it needs strength to reclaim $107.2k.
If the upper zone is not held, the next leg will be towards the lower zone, near $101.4k—$100.7k.
Breakout confirmation only above $110k (previous rejection zone).
The market is showing signs of weakness, especially with increased selling around resistance. Avoid rushing into trades—better setups may come if key zones hold or break.
Tip: Watch for bullish divergences or strong volume at the lower support for potential reversal setups.
BTC Returns to Highest ATH💎 Update Plan BTC (June 10)
BlackRock’s spot Bitcoin ETF has made history, becoming the fastest-growing exchange-traded fund (ETF) ever by surpassing $70 billion in assets under management (AUM).
The iShares Bitcoin Trust (IBIT), launched in January 2024, has achieved this milestone in record time, reflecting surging demand for Bitcoin exposure through regulated, mainstream investment vehicles. IBIT’s exceptional growth trajectory has outpaced all previous ETFs, eclipsing even established funds like the SPDR Gold Shares (GLD) in terms of asset accumulation speed.
The ETF recently returned to net inflows — posting a $274 million single-day increase — following a brief period of outflows during a broader market pullback. This rebound signals renewed investor confidence, with capital flowing in from both institutional players and retail investors alike, underscoring Bitcoin’s growing role in diversified portfolios.
Technical analysis angle
Congratulations to investors when the Plan transaction has detected the bottom of 100k and is currently the highest at 110.5k. It is a prosperous signal for investors who are holding this power currency
Another good news is that the organizers have breaked out of the decrease price channel to confirm the trend of increasing and confidence in the price increase continues to be enhanced by the Buyer.
Currently, the BTC price area is slowed by the resistance level with Fibo 0.786 around the 110k price area. We expect the adjustment of the investors to collect goods before the price area goes further around 111.5k even 115k
At this time, whether new or old, should spend more time to practice, load more knowledge about the PTKT, as well as find knowledge posts at the channel ..., to strengthen the solid foundation, as well as avoid losing money at this time offline
==> Comments for trend reference. Wishing investors successfully trading
BTCUSDT UPDATEBitcoin's likely move scares me. Let's be careful. Bitcoin dominance could also move with this decline.
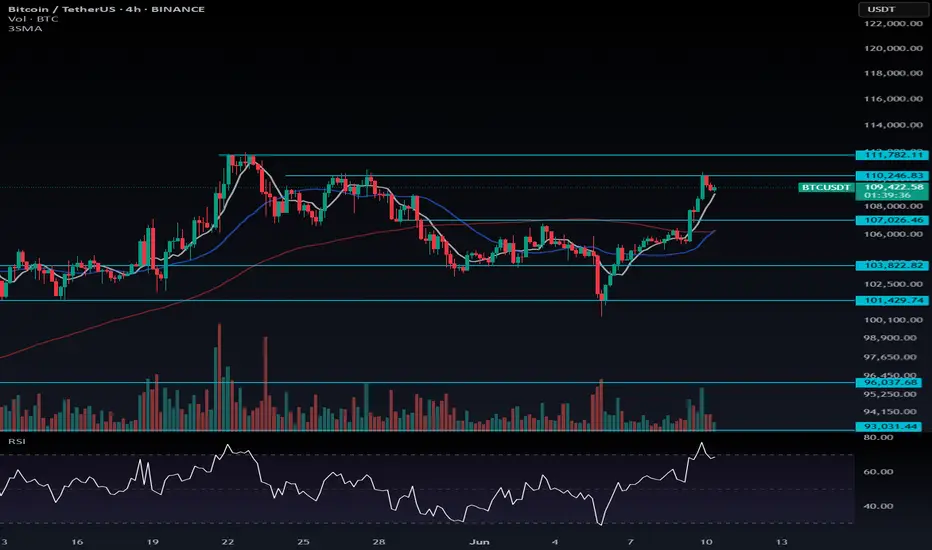
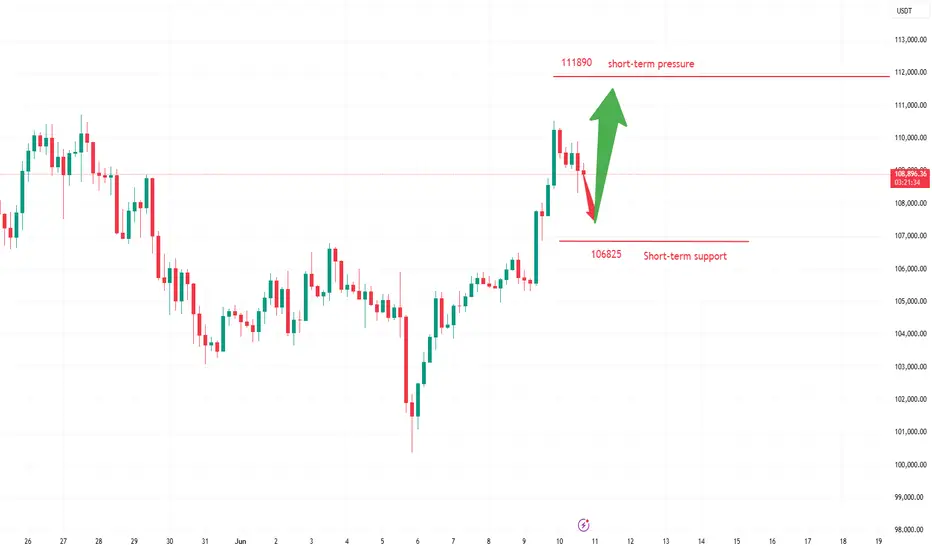
Bitcoin Price Update📊 Bitcoin Price Update: Key Resistance Zone Between $110K and $111.7K — Range-Bound Potential Ahead
As previously mentioned, Bitcoin's price action suggests that a break above $106,355 would signal the start of a bullish trend, and so far, we've seen upward momentum maintained while staying above $107K.
Now, Bitcoin has reached a critical resistance zone between $110,246.83 and $111,782.11. This area presents a potential for market hesitation, as it aligns with a strong resistance level. Given the significant movement over the past few days, it’s possible the market may enter a range-bound phase as it consolidates and structures itself for the next move.
---
📉 Possible Short-Term Range:
Range Between: $110,246.83 to $111,782.11
Expect possible sideways consolidation before continuing the trend
---
📈 Bullish Continuation:
As long as Bitcoin remains above $107K, the bullish trend remains intact
Break above $111,782.11 may signal continuation toward higher targets