BTC: Decision Time Ahead! A Quick Update!!Hey Traders!
If you’re finding value in this analysis, smash that 👍 and hit Follow for high-accuracy trade setups that actually deliver!
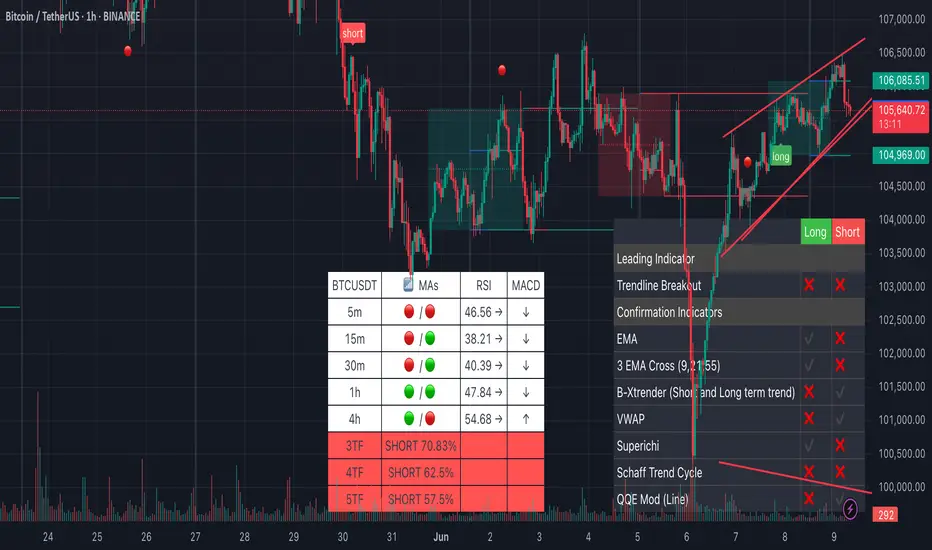
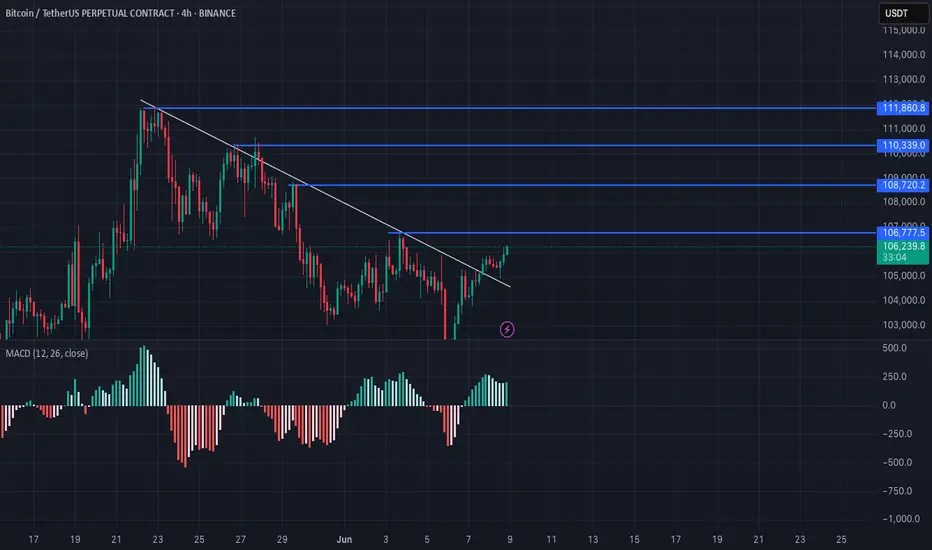
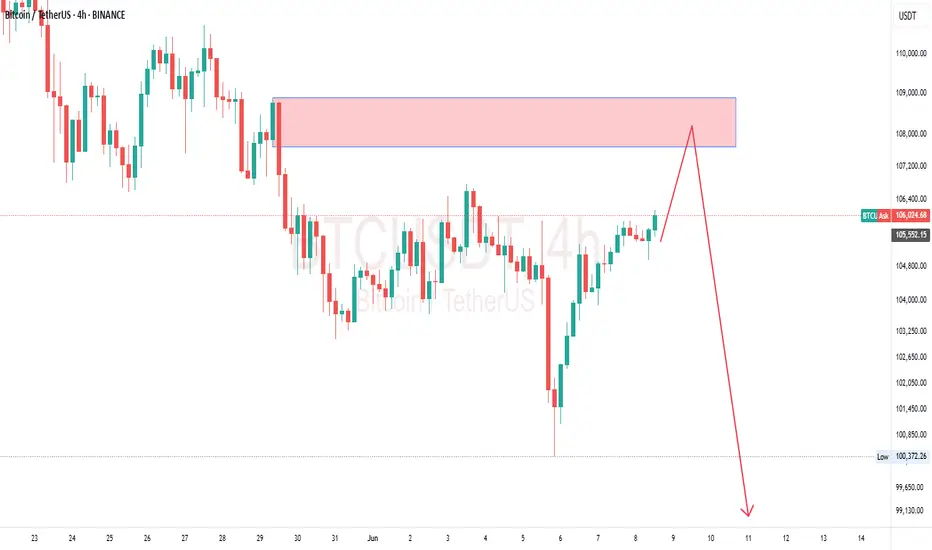
Bitcoin is once again testing the descending trendline resistance on the 4H chart.
We're currently at a make-or-break level:
A clear breakout above the trendline could trigger a bullish move toward $110K+
A rejection here might push BTC back to the $100K–$98K support zone
📍The green zone remains key — last time, it held as strong support.
But without a breakout above $106.5K, bulls are on the defensive.
Watch price action closely here — the next big move could start from this very point.
What’s your take? Bullish breakout or another dump loading?
BTCUSDT.5L trade ideas

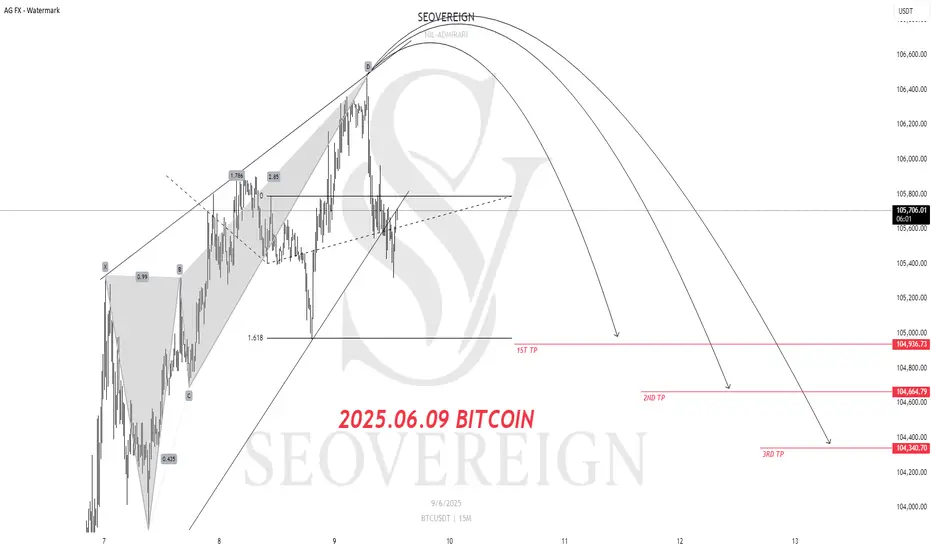
BITCOIN Short Position Update – June 9, 2025We are the SeoVereign Trading Team.
With sharp insight and precise analysis, we regularly share trading ideas on Bitcoin and other major assets—always guided by structure, sentiment, and momentum.
🔔 Follow us to never miss a market update.
--------------------------------------------------------------------------------------------------------
Bitcoin (BTC) Short Position Strategy
Position Basis: Expected decline after touching the upper diagonal trendline, with additional confirmation from the Deep Crab pattern
1st Target: 104,936
Analysis Summary:
Currently, BTC is likely to face selling pressure after touching the upper trendline of the ascending diagonal pattern. In addition, the formation of the Deep Crab pattern, one of the harmonic patterns, further strengthens the technical basis for a bearish reversal.
The targets are set based on key support zones, and a partial take-profit strategy may be effective depending on market conditions. Setting a stop-loss to prepare for pattern invalidation and sudden rebounds is an essential element of risk management.
BTC Dominance, Alt CAP (in BTC) and BTCBTC Dominance, Alt CAP (in BTC) and BTC
This chart compares those three trends and their relationship between them

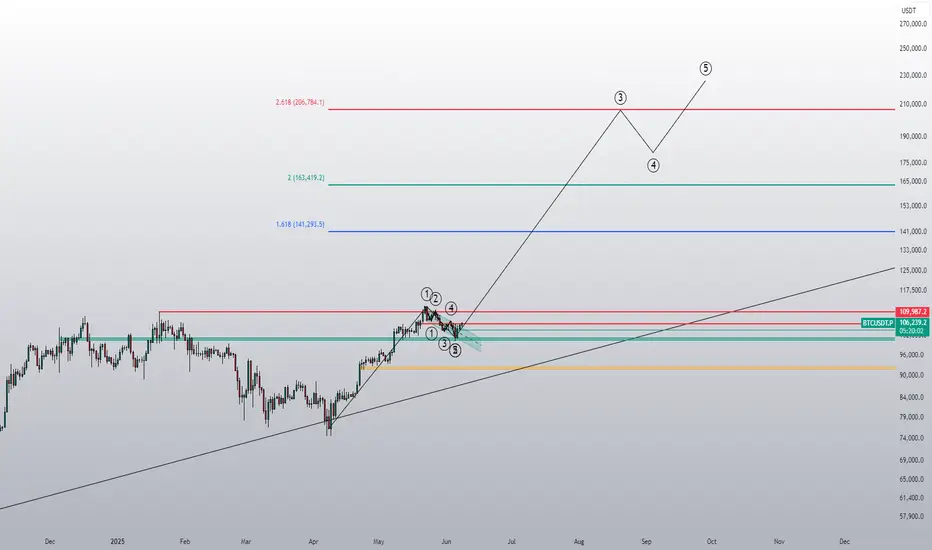
Bitcoin Overall: aiming higher--may test supportWhile I believe BTC is heading higher (not ATH highs yet) after ending at least pt 1 of a larger corrective phase, if it breaks the current near-term trend but falling below the indicated wick, I think there's a good chance of reaching the first indicated support. Upon which there should be a long to the short region indicated.

2025/06/09 BTCUSDT Raising wedge patternChart is running in rising wedge pattern.
I expect it is break and retest 100K in this week.
Entry at 105k and SL at 107k
TP at 100.x K
Bitcoin's Next 20% Move? My Plan Unveiled Bitcoin (BTC) - Navigating Key Levels & Potential Paths
Technical Outlook — 8 June, 2025
1. Current Market Context:
Price Action: Bitcoin is currently trading around the $106,000 mark after a recent retracement from higher levels. We've seen a significant rally from the April lows, and the market is now consolidating.
Key Levels: The chart highlights several important resistance and support zones that will likely dictate future price movements.
2. Key Observations & Potential Scenarios:
Resistance Levels:
Immediate Resistance: ~$108,000 - $112,000. This zone has acted as resistance previously and is currently being tested.
Next Major Resistance: ~$124,000 - $128,000. This is a crucial zone from previous highs and a potential target if the current resistance is overcome.
Support Levels:
Immediate Support: ~$96,000 - $100,000. This zone aligns with previous price consolidation and is the first line of defense if the price drops.
Strong Support: ~$92,000 - $88,000. This area previously acted as significant support and could be a strong bounce zone.
Lower Support/Trendline: ~$76,000 - $80,000. This aligns with the lower boundary of the broader ascending channel/trendline.
Highlighted Paths (Orange Arrows): The chart suggests two potential paths:
Scenario A (Bullish Continuation): A break above the $108,000-$112,000 resistance, leading to a push towards $124,000-$128,000. This would likely follow a slight dip or consolidation before the breakout.
Scenario B (Retracement & Bounce): A deeper retracement towards the $96,000-$100,000 or even $92,000-$88,000 support zones, followed by a bounce and subsequent rally towards the higher resistance levels. This scenario aligns with the idea of a healthy correction before further upward movement.
3. Trading Plan:
A. Bullish Entry (Aggressive / Confirmation Trade):
Trigger: Clear daily candle close above the $112,000 resistance level with strong volume.
Entry: Upon confirmation of the breakout.
Target 1: $124,000
Target 2: $128,000
Stop Loss: Below the newly formed support level (e.g., $105,000 - $107,000, depending on the breakout structure).
B. Long Entry (Dip Buy / Value Trade):
Trigger: Price retests and holds either the $96,000 - $100,000 support zone or the $92,000 - $88,000 support zone. Look for bullish reversal candlesticks (e.g., hammer, bullish engulfing) on the daily timeframe.
Entry: Upon confirmation of support holding and a bullish reversal signal.
Target 1: $108,000
Target 2: $112,000
Target 3: $124,000 - $128,000 (if momentum continues).
Stop Loss: Just below the tested support zone (e.g., $95,000 for the first support, or $87,000 for the second support).
C. Bearish Outlook (Short-Term / Risk Management):
Trigger: A clear daily candle close below the $88,000 support level, invalidating the current bullish structure.
Action: Consider exiting long positions or being prepared for further downside towards the $76,000 - $80,000 level. This would suggest a breakdown of the overall uptrend.
4. Risk Management:
Position Sizing: Only risk a small percentage of your trading capital on any single trade (e.g., 1-2%).
Stop Loss: Always use a stop loss to limit potential losses.
Profit Taking: Consider taking partial profits at target levels to secure gains.
Market Volatility: Bitcoin is highly volatile. Be prepared for rapid price movements.
5. Additional Considerations:
Volume: Always pay attention to trading volume. Strong volume on breakouts confirms the move, while weak volume may suggest a false breakout.
If you found this analysis valuable, kindly consider boosting and following for more updates.
Disclaimer: This content is intended for educational purposes only and does not constitute financial advice.

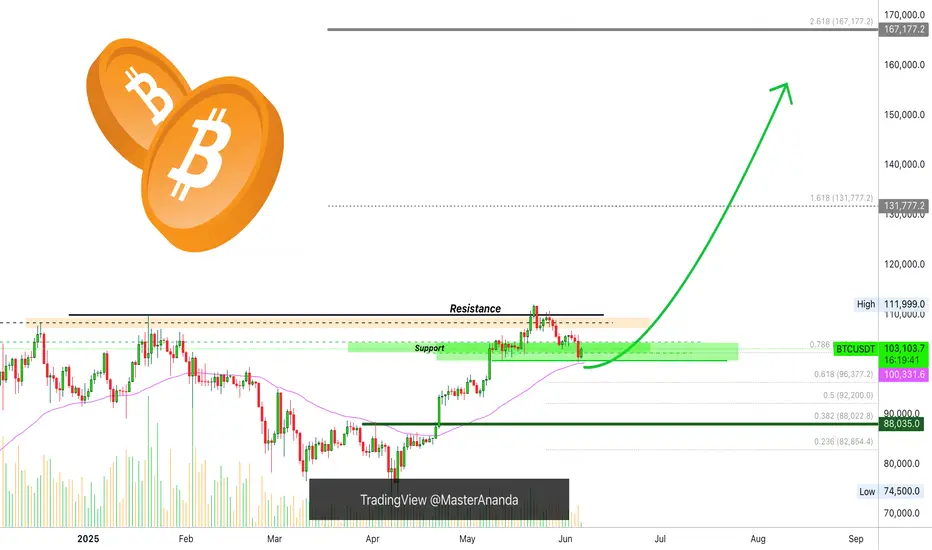
Bitcoin, Fast & Easy. $100,000 Support Holds +AltcoinsThe main support is not $100,000 but $102,000, so we make this a range. Yesterday, for the first time this range was tested and it holds easily... We are strongly bullish above $102,000 and Bitcoin is already trading above 103K.
This is really good news but we are not fully in the green yet. Bitcoin can continue sideways, consolidation, and only after closing above $106,000 we are looking for higher prices. Once $110,000 gets conquered, we can start talking about new all-time highs and sustained bullish growth. Meanwhile, the altcoins grow.
So we are not there yet but this is the best ever. For Cryptocurrency to thrive we need a strong Bitcoin and Bitcoin right now is very strong. Are you trading any altcoin? If you are, feel free to accumulate, load-up, buy and hold.
As for Bitcoin, here is a very easy trading approach:
While above $100,000, ALL-IN bullish confirmed.
If it goes below $100,000, stay out and wait to see what the market does. As soon as there is a support level created, we go LONG. If it goes below $100,000 just to recover the next day, we are again ALL-IN as soon as Bitcoin starts trading above 100K.
This process can be repeated many times but once Bitcoin takes off, buying below $110,000 is a major win because soon Bitcoin will be trading above $150,000. We have targets around $180,000 and even beyond $200,000 is possible this same year. Never forget the bigger picture.
The bigger picture is bullish for Bitcoin and the altcoins, the short-term can create confusion because the chart, market conditions, can change within hours.
But there can be a drop, a retrace or a market flush, but knowing that Bitcoin will be trading above $150,000 soon turns such an event into a non-event, it makes it into a simple hold.
The action on the side of the altcoins confirms that Bitcoin will continue to grow. Short, mid and long-term.
There is no retrace, there is no correction, only a small consolidation phase in anticipation of the next bullish wave. You already know this. If you didn't, now you know.
In 2025, Bitcoin will continue to grow. Just as it grew in 2023 and 2024.
We are entering bull market season. Bullish momentum will only start to gain force.
Namaste.
BTC SHORTI hope it plays as we predict, Market sentiments are really volatile we might get squeezed.
The trade setup is on the chart..
DYOR
BTC long in play BTC has broken the range and going up, trading idea and range in consideration. #BTC #ETH #Crypto
2nd Tiqgpt signal for BTCUSDT todayMARKET NARRATIVE: The analysis of BTC/USD across multiple timeframes reveals a consistent narrative of smart money accumulation and price advancement. Starting from the 1-hour chart, we observe a significant upward movement marked by a series of bullish candles, indicating a strong buying interest. This movement is characterized by the formation of a robust Order Block (OB) around the $106,300 level, which acts as a foundational base for subsequent price ascents.
Drilling down to the 15-minute timeframe, the continuation of bullish sentiment is evident as price action maintains above the previously established 1-hour OB, suggesting sustained institutional buying pressure. The price structure here shows a series of higher highs and higher lows, indicative of a Break of Structure (BOS) to the upside, confirming a bullish market structure shift.
On the 5-minute chart, the granularity increases, and we see more detailed interactions around key liquidity zones. The price action around these zones suggests that smart money is actively managing the ascent, possibly accumulating more positions on minor pullbacks. Each pullback into short-term mitigation blocks is met with a swift response, propelling prices further up.
The 1-minute timeframe provides the closest look at the micro-movements and shows the precision with which institutional players are operating. Notably, there is a slight pullback to a mitigation block near $106,318, which could be an inducement for further buying activity. This level aligns closely with the OBs identified in higher timeframes, reinforcing its significance as a strategic entry point.
INSTITUTIONAL THESIS: The consistent demand across all observed timeframes and the strategic positioning around key OBs suggest that smart money is targeting higher liquidity zones above the current price levels. The intent appears to be to drive prices towards the next significant liquidity pool, potentially around the $107,000 mark, where previous highs and unmitigated OBs converge.
LEARNING POINT: The interaction between multi-timeframe OBs and the execution of trades around these zones exemplifies the smart money concept of using lower timeframe pullbacks to OBs as high-probability entry points in the direction of the prevailing market structure.

Uncontrolled Greed: Save Your Portfolio by these strategies Think fear is the only emotion causing big losses? Think again — this time, it’s all about greed .
🤯 That feeling when you don’t close a profitable position because you think it still has room .
📉 Let’s dive into the chart and see how even pro traders fall into the greed trap .
Hello✌
Spend 3 minutes ⏰ reading this educational material.
🎯 Analytical Insight on Bitcoin:
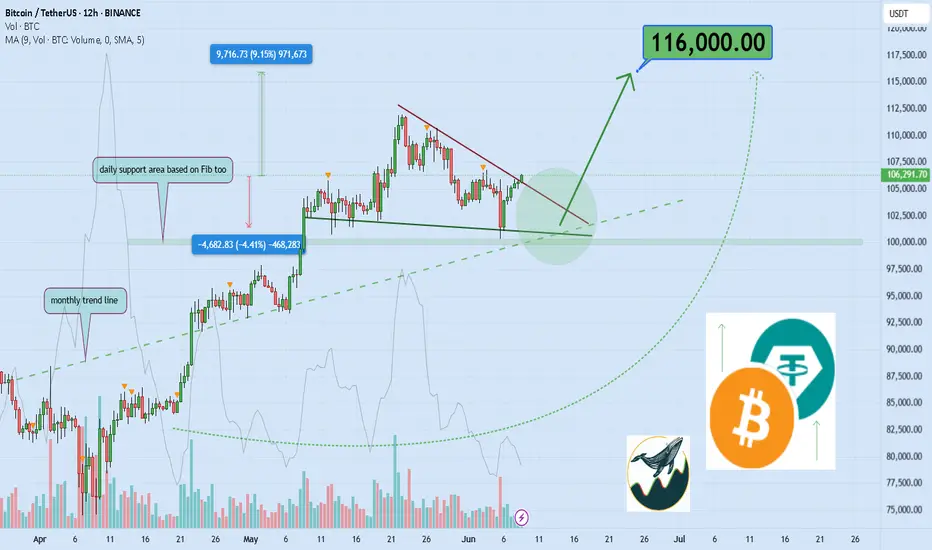
Bitcoin is currently testing a major monthly trendline alongside a key daily support zone, both aligning with Fibonacci retracement levels.📐 This confluence suggests a potential upside move of at least 9%, with a primary target projected near the $116,000 mark .📈 Market participants should watch this level closely as it may serve as a pivot for mid-term price action.
Now , let's dive into the educational section,
🧠 The Psychology of Greed in Trading
Greed speaks quietly but hits hard. It whispers: “Just a bit more. Let it run.”
But that’s the same voice that turns green into deep red. Markets don’t care about your dreams.
When a small win turns into a big loss — that’s greed in action.
No one knows the top. Trying to predict it out of emotion is how portfolios get wrecked.
Greed often spikes after multiple winning trades — when overconfidence kicks in.
That’s when you need data, not dopamine.
📊 TradingView Tools That Help Tame Greed
TradingView isn’t just a charting platform — if used right, it can be your emotional assistant too.
Start with RSI . When it crosses above 70, it signals overbought zones — prime time for greedy entries.
Volume Profile shows you where the smart money moves. If you see high volume at price peaks, it’s often too late to jump in.
Set up Alerts to get notified when your indicators hit key levels — avoid reacting in real-time chaos.
Use Replay Mode to rewatch old setups and identify where greed affected your past decisions.
Customize Chart Layouts per market type. Having a focused view helps you act based on logic, not emotion.
🛡 Strategies to Defeat Greed
Pre-define your take-profit and stop-loss before you enter. Non-negotiable.
Create a Psych Checklist: “Am I trading based on a missed move? Or a solid signal?”
After every trade, reflect on what drove your decisions — fear, logic, or greed?
Take a trading break after a streak of wins. That’s when greed loves to sneak in.
Withdraw a portion of your profits to reinforce the habit of securing gains.
Practice on demo during volatile days to build emotional discipline.
Never try to win back all losses in one trade — that’s greed’s playground.
If you're sizing up every position just because "the market is hot", pause.
Focus on surviving, not conquering. Long-term traders are calm, not greedy.
✅ Wrap-Up
In crypto's wild swings, greed destroys faster than any technical mistake.
Enter with a plan. Exit with purpose. Greed-based trades usually end with regret.
Emotional control equals long-term survival. Trade smart — not just hungry
📜 Please remember to do your own research before making any investment decisions. Also, don’t forget to check the disclaimer at the bottom of each post for more details.
✨ Need a little love!
We put so much love and time into bringing you useful content & your support truly keeps us going. don’t be shy—drop a comment below. We’d love to hear from you! 💛
Big thanks ,
Mad Whale 🐋
This could go very high!This looks incredibly like a full-send setup, which could blast Bitcoin up to 200k in a wave 3 of an Elliot wave pattern.
BTCUSDT: Sharing of the Latest Trading StrategyAll the trading signals today have resulted in profits!!! Check it!!!👉👉👉
Fundamental Analysis:
The U.S. Senate’s procedural vote on the GENIUS Stablecoin Act could inject significant 合规 capital into the crypto market if passed. Regulatory sentiment has improved following the Trump administration’s push to include Bitcoin in strategic reserves. Concurrently, Bitcoin ETFs recorded over $40B in inflows during May, while Coinbase’s inclusion in the S&P 500 has solidified crypto’s mainstream investment credentials.
Technical Analysis:
Bitcoin is consolidating above $100k, with MACD showing diminished but dominant bullish momentum. RSI at ~55 indicates balanced market forces. On-chain metrics reveal historically low distribution pressure from long-term holders and accelerating retail participation, forming a supportive backdrop for price appreciation.
Trading Recommendation:
Seek long entries on pullbacks. Light positions may be initiated between $103k-$104k.
Trading Strategy:
buy@ 103000–104000
TP:106000-108000
Share accurate trading signals daily—transform your life starting now!
👇 👇 👇 Obtain signals👉👉👉

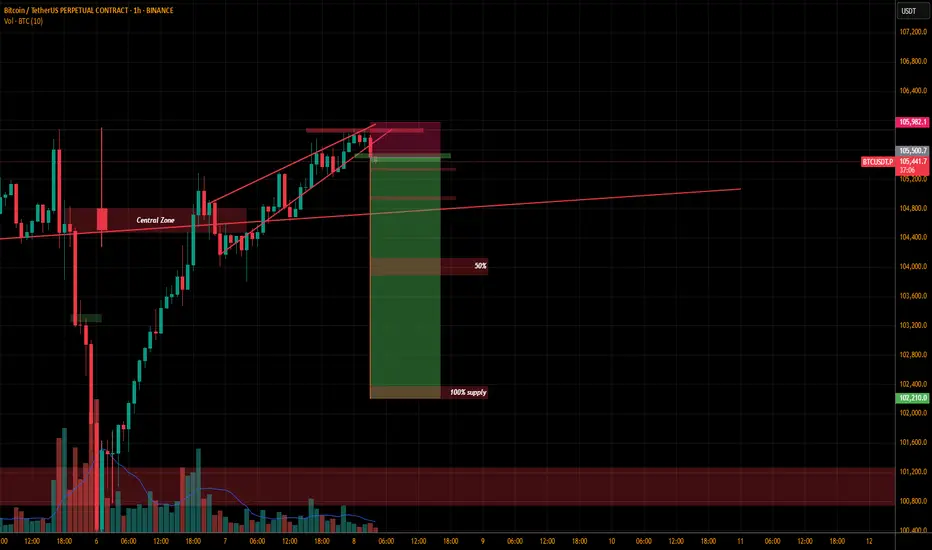
BTC V-Shaped Recovery in Play Range ]
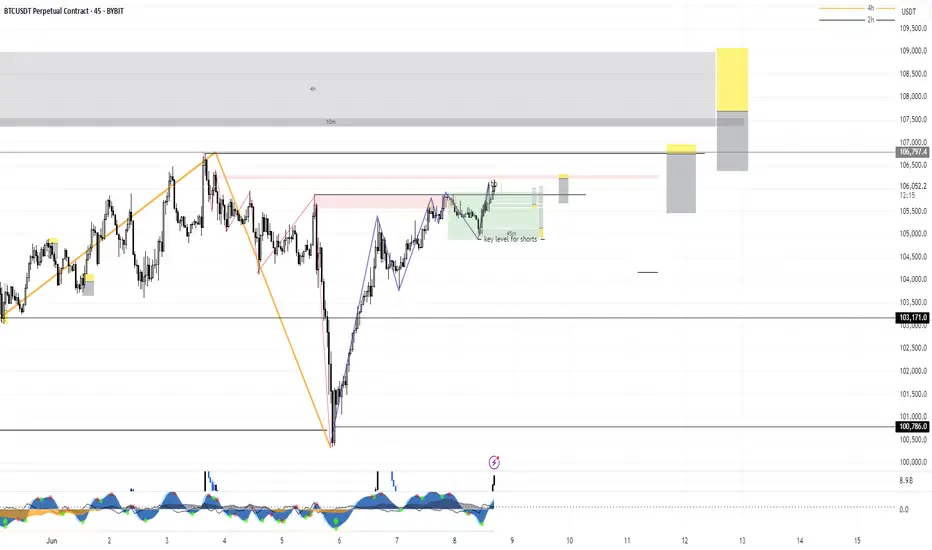
📊 Bitcoin 1H–4H Analysis: V-Shaped Recovery in Play — Range Still Holding Unless $106,355 Breaks
Bitcoin continues to consolidate within the range of $101,638 – $110,173, as previously anticipated. This range-bound movement remains valid unless price breaks above the $106,355 level.
On the 1H and 4H timeframes, a V-shaped recovery pattern is forming, which increases the likelihood of a bullish breakout. However, the orange trendline drawn from previous price action still holds as a key dynamic level — offering both technical structure and resistance.
---
🟢 Long Setup:
📍 Entry Trigger: Break and close above $106,355
📈 Momentum Confirmation: If RSI on the 1H timeframe closes above 67, it adds strong confirmation to the bullish bias
🛡️ Stop-loss: Around $104,950
---
⚠️ Range Context:
Current range: $101,638 – $110,173
As long as price stays inside this range, both breakout and breakdown setups remain valid
📉 Breakdown zone: Still watching $103,822.8 as bearish trigger (from earlier analysis)

NEW WEEK NEW TRADES! New Week. New Opportunities. 🚀
As we step into the second week of June, we’re fully prepared to take advantage of the markets — with both long 📈 and short 📉 setups ready in advance.
✅ We caught most of the major moves last week — now let’s see if the trading gods 🙏 are on our side again.
📊 Charts are ready — feel free to download them, and drop any trade setups you’re watching in the comments below.
🟠 BTC is on the road to redemption after the SFP at the daily higher low.
Will it break 4H structure? Or reverse back down? Either way, we’re prepared and positioned for both scenarios.
🗓️ This Week’s Schedule:
Classes are expected on Monday, Tuesday, and Friday.
⏰ Exact times TBC — stay tuned.
FREE MONEY! My next trade ideasNew Week. New Opportunities. 🚀
As we step into the second week of June, we’re fully prepared to take advantage of the markets — with both long 📈 and short 📉 setups ready in advance.
✅ We caught most of the major moves last week — now let’s see if the trading gods 🙏 are on our side again.
📊 Charts are ready — feel free to download them, and drop any trade setups you’re watching in the comments below.
🟠 BTC is on the road to redemption after the SFP at the daily higher low.
Will it break 4H structure? Or reverse back down? Either way, we’re prepared and positioned for both scenarios.
🗓️ This Week’s Schedule:
Classes are expected on Monday, Tuesday, and Friday.
⏰ Exact times TBC — stay tuned.

Bitcoin Trading Strategy for Monday's OpeningThe Bitcoin market as a whole showed a volatile trend this week. The price opened near $105,000 at the beginning of the week, and then fluctuated up and down under the combined influence of news and market sentiment. The highest touched $107,000, and the lowest fell to $101,000. From a daily chart perspective, the price hovered near key levels multiple times, indicating a fierce game between bulls and bears in the market. In terms of trading volume, it decreased compared to last week, suggesting that market participants have a certain wait-and-see attitude at the current price level.
Comprehensive analysis shows that the Bitcoin market will continue to maintain a pattern of multi-empty games next week. If macroeconomic data is positive, there are no major negative news on the policy front, and market sentiment remains stable, the Bitcoin price is expected to break through the short-term resistance level of $105,500 and challenge the resistance level of $107,000 or even higher.
Humans need to breathe, and perfect trading is like breathing—maintaining flexibility without needing to trade every market swing. The secret to profitable trading lies in implementing simple rules: repeating simple tasks consistently and enforcing them strictly over the long term.

Btcusdtbtc beat most of the traders expectation as btc did massive sell two days ago and pick up to seek higher price again...
so am still expecting btc to seek lower price even if is going to continue his bulish movement again. so the bias is to buy and to sell later

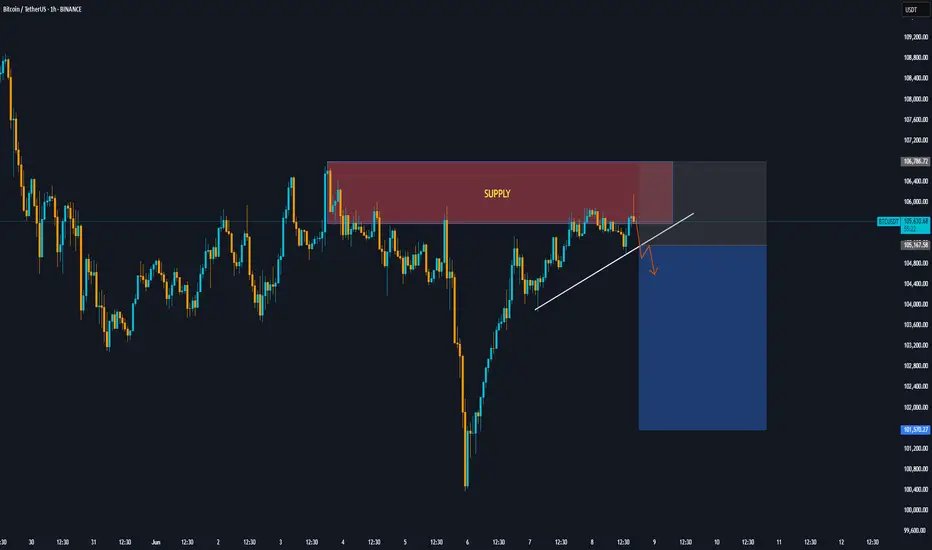
BTC H1 Short area Bitcoin is in a strong supply range, and breaking the trendline allows you to enter a sell position to lower demand areas.
enjoy traders :)
TradeCityPro | Bitcoin Daily Analysis #111👋 Welcome to TradeCity Pro!
Let’s take a look at Bitcoin and key crypto indicators. As usual in this analysis, I’ll review the futures triggers for the New York session.
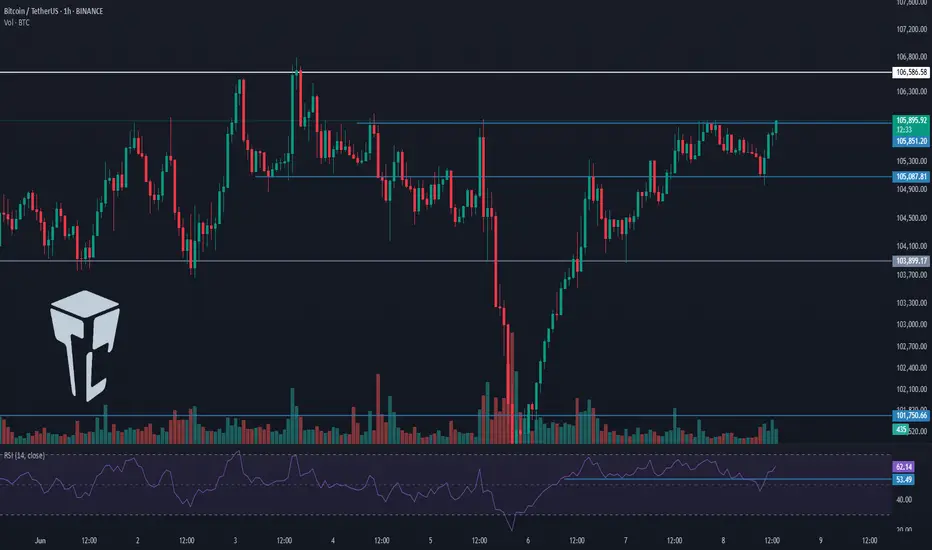
⏳ 1-Hour Timeframe
As you can see in the 1-hour timeframe, none of our triggers were activated yesterday and Bitcoin has been ranging.
⭐ There was an important RSI level at 53.49, which was tested multiple times. I mentioned that breaking this level could trigger a slight correction — and that’s exactly what happened. The price pulled back slightly to 105087, retested this zone, and now RSI has returned above 53.49. Price is also moving with strong bullish momentum toward the 105851 resistance.
📊 The buying volume entering the market is quite strong, and if this increase continues, the price could begin an upward move. So in terms of both momentum and volume, we have bullish confirmation and can enter a position if the triggers activate.
📈 For a long position, the trigger we’re watching is 105851. While the main resistance is at 106586, I prefer to take the risk and open the position earlier, because I think the 106586 break won’t provide a clean entry and would be harder to act on.
✨ So my chosen trigger for a long position is 105851. Given the rising volume and high RSI momentum, we have the confirmations needed to open this trade.
🔽 For a short position, the first trigger is the break of 105087. This is a risky position since we haven’t yet confirmed a trend reversal — this would be the first signal if a downtrend begins. Personally, I’ll wait for confirmation of bearish momentum before opening a short.
👑 BTC.D Analysis
Bitcoin Dominance is still below the 64.67 level and is ranging under this resistance.
🧩 A break above 64.67 would confirm a bullish move in dominance. A break below 64.49 would signal a bearish reversal.
📅 Total2 Analysis
Total2 is ranging below the 1.15 level. A break above this zone could initiate a bullish move.
🔔 On the bearish side, the current trigger is the 1.13 level. We need to wait for this level to be broken for a trend reversal confirmation.
📅 USDT.D Analysis
Tether Dominance stabilized below the 4.79 zone yesterday and has now pulled back to it, preparing for a possible second leg downward.
🔑 If that happens, the crypto market could move upward. However, if USDT.D rises back above 4.79, its uptrend could continue.
❌ Disclaimer ❌
Trading futures is highly risky and dangerous. If you're not an expert, these triggers may not be suitable for you. You should first learn risk and capital management. You can also use the educational content from this channel.
Finally, these triggers reflect my personal opinions on price action, and the market may move completely against this analysis. So, do your own research before opening any position.
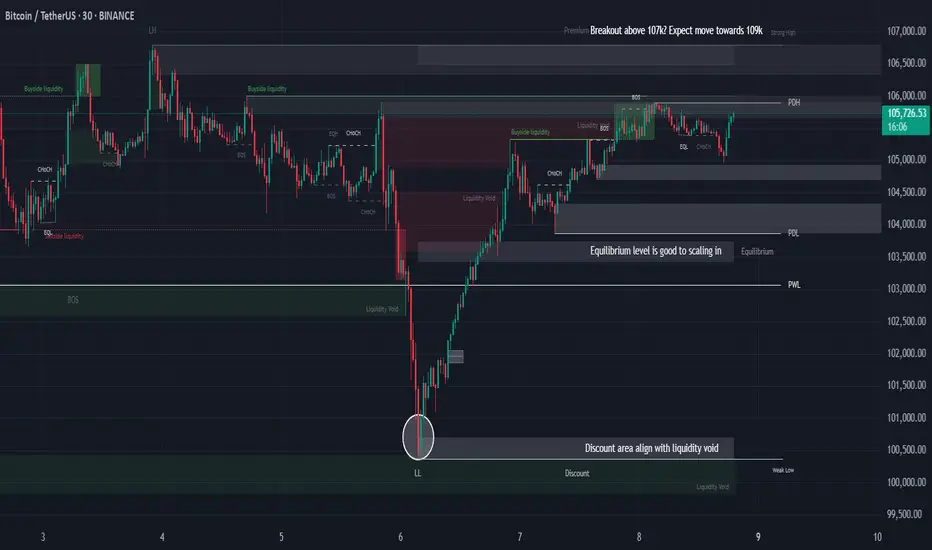
BTC at Resistance, Correction or Breakout to 109K?Yo traders! 😎 Here's a clean smart money breakdown of BTC/USDT on the 30-min chart. Be ready—this could be the calm before the pump or the trap before the dump 🧠⚡
🧠 Key Observations:
1. BTC is currently at a resistance zone, reacting near 107K, which is the Previous Daily High (PDH) 🧱 → Be cautious here—a rejection could trigger a correction.
2. If price successfully breaks above 107K, the next liquidity magnet is at 109K, right at a Strong High level. That’s where price might get drawn to 🚀
3. In case of rejection or correction, we’re watching the equilibrium zone (EQ) as a high-probability scaling-in area 🎯 → It gives a better risk-reward and aligns with the overall bullish structure.
4. Look how the discount zone aligns beautifully with a liquidity void 🤝 → Smart money loves these confluences. That’s where they often step in.
5. Previous structure shows a Lower Low (LL) followed by a strong displacement upward, indicating a potential Change of Character (ChOCH) ➡️ Bullish Bias 🔄🐂
6. We also got a clean sweep of sell-side liquidity before price pumped. This confirms accumulation by smart money below the EQ area 📉💰
⚡ Summary:
🔺 Above 107K = Breakout Potential → 109K Target
🔻 Rejection at 107K = Watch EQ zone for re-entry
⚠️ Don't rush in at resistance—wait for confirmation (BOS, retest, or signs of strength)
💬 What’s your take? Are you waiting for the breakout or prepping to buy the dip? Let’s chat below 👇
And make sure to follow for more clean, structured BTC updates like this 🔥📊
Bitcoin 4H – Battle at Resistance | Two Perspectives 🧪 1. 🐸 Miracle’s View – “Altcoins' Prophet” 🐸
"Yo fellow degenz! It's me – Miracle from the meme-coin clan, and I'm sniffing something bullish... but not so fast!"
Price is tryin’ to break out of a wicked resistance zone.
That red line? 🔴 It's not ketchup — it's the final boss trendline, and BTC must defeat it with volume ⚔️
Market sentiment is bullish, but Miracle says: "Wait for a clean break and retest — no fomo attacks!"
🔍 MA50 (gray snake) is curling up like a noodle of support. If we bounce off it again → 🚀 108.5K, 111K and beyond!
📉 BUT — if price gets rejected and drops below 105K… we might slide to 103.8K (or worse, the dungeon at 101.7K) 🕳️
📢 Miracle Rule: “Breakout without a retest is like a meme coin without a rug — rare!”
🔮 TL;DR:
🟢 Above 106.7K = Go time, ride the wave!
🔴 Below MA50 = Watch your bags, exit or short it with a stop above the resistance!
🔍 2. Unknown Analyst’s Neutral View (Clean & Pro)
BTC is challenging a major resistance zone between ~105.7K–106.7K.
A strong breakout above both the horizontal zone and descending trendline could initiate the next bullish leg.
MA50 and MA200 are offering dynamic clues:
MA50 holding = bullish confirmation if price closes above resistance
Failure to hold = a likely revisit to lower demand levels
Confirmation needed:
Clean candle close above resistance zone
Followed by a successful retest of the zone or MA50 as support
If rejection happens here → Potential retracement to 103.8K or lower (support & previous consolidation)
🎯 Targets on Breakout:
108.5K (local high)
111K (liquidity zone)
Extension possible if volume supports it
🧠 Dual Insight:
"Same chart. Two voices. One truth: Trade with logic — not emotion."
💬 Let us know in comments:
Are you team 🐸 Miracle or team 🧠 Unknown Analyst?
🎬 TradeWithMky – where altcoins speak louder than Bitcoin!
#Bitcoin #CryptoAnalysis #BTC #TradingView #TradeWithMky #MiracleShot #AltcoinArmy
