Technical analysis of BTC contracts (outlook for next week)Technical analysis of BTC contract on June 7 (next week outlook):
The weekly trend, after the price hit the high point of 112000 area, it retreated under pressure. The current K-line pattern is negative, but the price is still at a high level, which also exacerbates the overall trend of volatility. The daily price was fluctuating downward before Friday. The impact of yesterday's data caused the price to rise, which seemed to break this trend, and it also became contradictory. The technical indicators of the four-hour chart and the hourly chart changed very quickly, and there was no reference signal for the medium and long term; in general, the current trend will continue the oscillating pattern, with the upper pressure position in the 107000 area and the low point support position in the 100600 area;
BTCUSDT.5L trade ideas

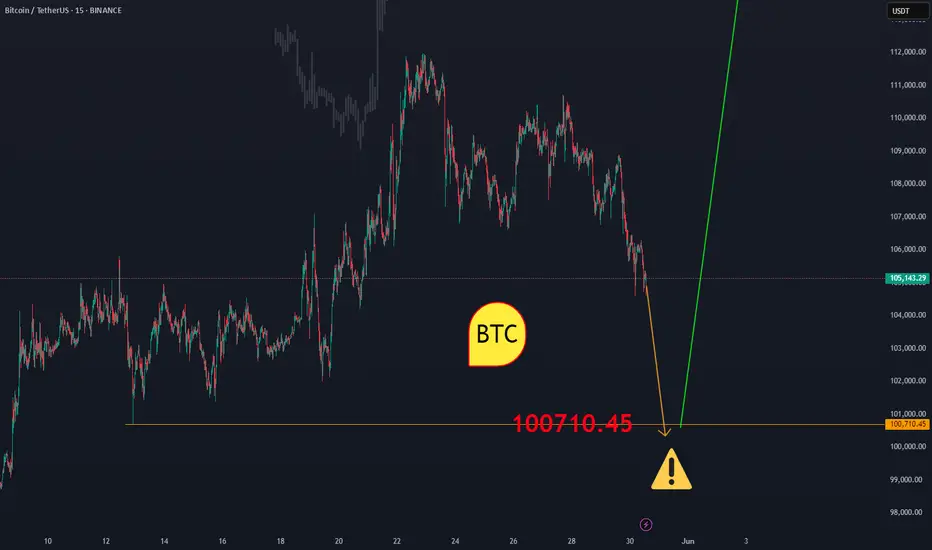
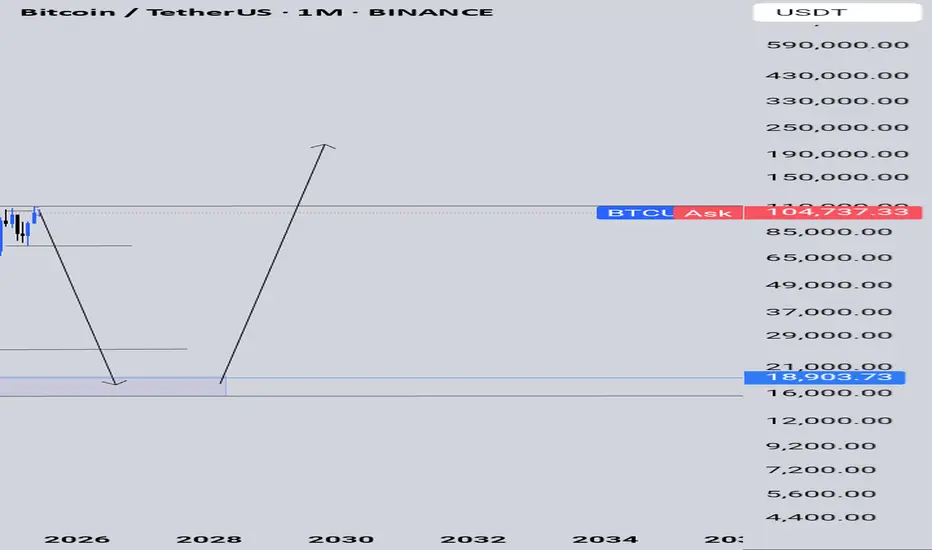
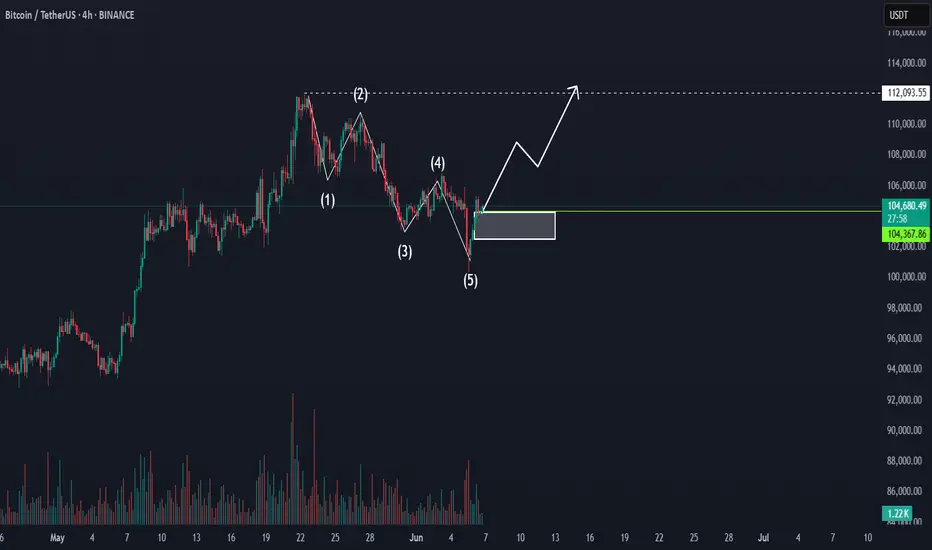
BTCUSDTBitcoin may be looking to complete the downward correction from the $101,000 price range to $99,000 and then begin a long-term upward trend. Pay close attention to the extent of the correction and don't give in to fear or greed.
In any case, it should go to $1300,000.
BINANCE:BTCUSDT
The market is still bullish. $BTCWe got out of the bear market cycle so quickly that I don't think anyone has understood yet...#BTCUSDT

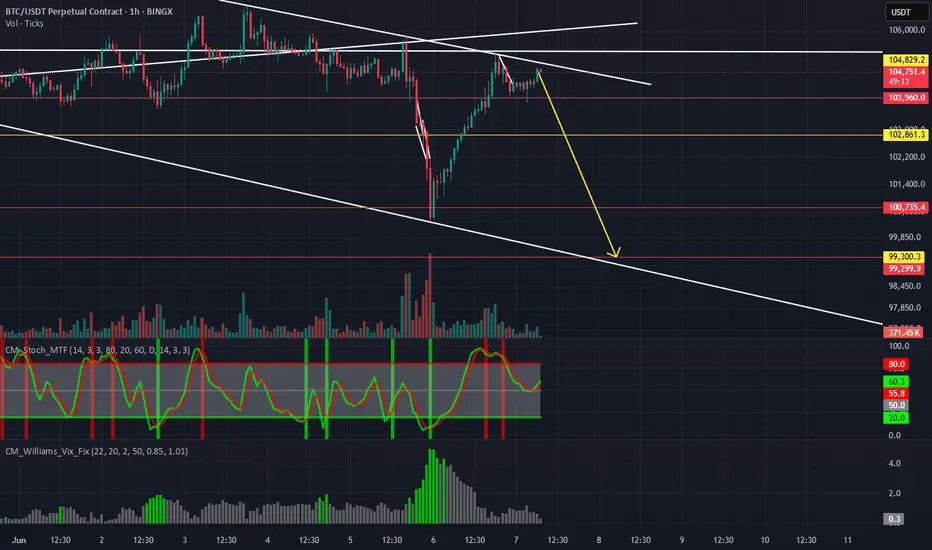
A Follow up to: “Adjustments for Better Readings & VSA vs BTC"When a trend approaches its end, we typically observe the formation of a buying or selling climax. That was certainly the case during Wyckoff’s era. Everything he described—market manipulation, signals, footprints—remains relevant today. But you know what that also means: if it's out there, it’s old news.
Yes, this is still happening, but we need to acknowledge that this information is no longer exclusive. And when a method becomes well-known—especially among retail traders—it can be used against them. Wyckoff himself hinted at this: the manipulators can and do use these same technical patterns to deceive. His real message?
“Keep an open mind.”
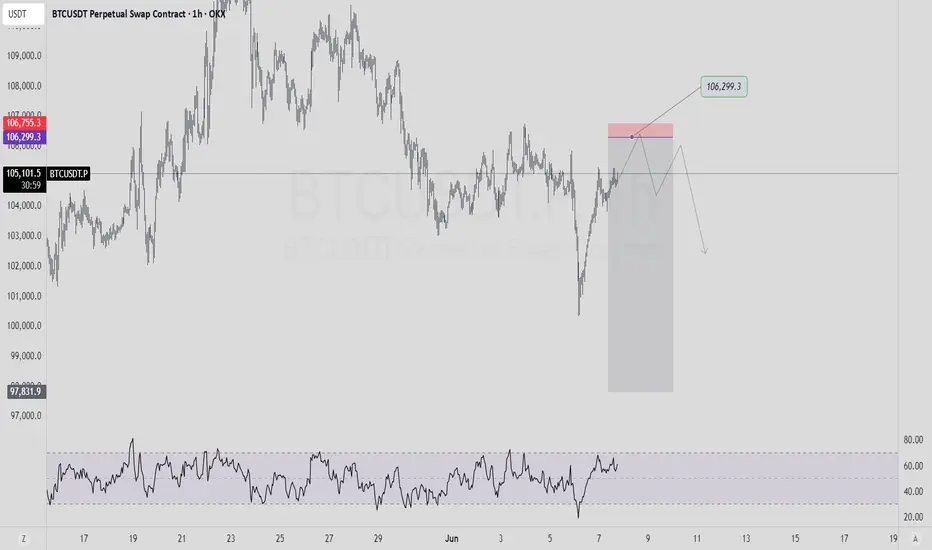
📉 In our current BTC chart, we’re seeing a textbook example of potential manipulation. A selling climax is visible—normally a sign of trend exhaustion and a bullish reversal. But is that really the case here? Did the downtrend truly end?
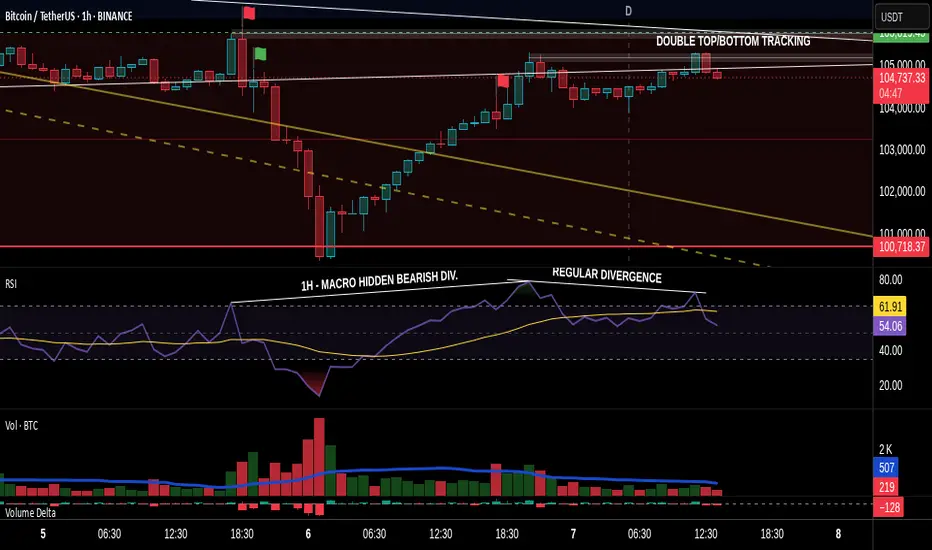
On the 1-Hour timeframe, both the RSI and volume indicators suggest otherwise: a bearish continuation seems more likely.
🧱 We're also witnessing a real-time formation of a Double Top pattern, taking shape since June 6. Measured by body candle spreads (excluding wicks), we observe four touches within a key price rectangle. These align with a known candlestick pattern: the Tweezer Top, commonly associated with bearish reversals.
What’s more, all of this is happening within a supply zone—actually three marked zones on the chart. The most recent zone shows signs of offloading pressure, amplified by both the Double Top and bearish candlestick formations.
And I haven’t even touched on the rejection wicks or how bearish volume spikes are gaining strength. That’s where the principle of Effort vs. Result comes in—remember, nothing in the market is free.
📊 In line with our past two posts, note how price action (PA) shows equal highs while RSI diverges, reinforcing earlier signals. The signs are stacking up.
So, the critical question now is:
Are we heading below the $100.718 level for a confirmed Head & Shoulders pattern?
Or is this just a retest before another move?
If this way of reading the market resonates with you and you want to go deeper—whether it’s building confidence or spotting signals before they play out—I work with a small circle of traders sharing TA privately on a daily basis. Feel free to reach out.
Till next time be well and trade wisely!
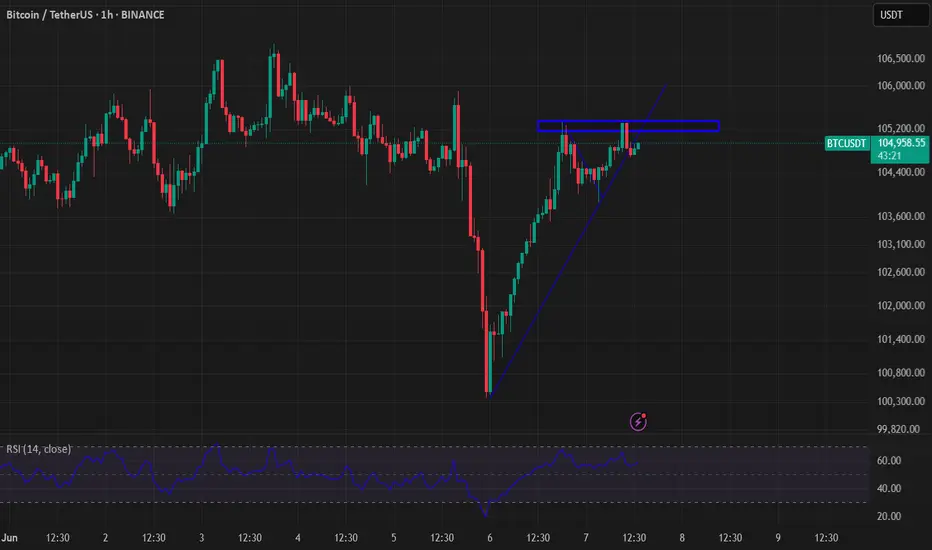
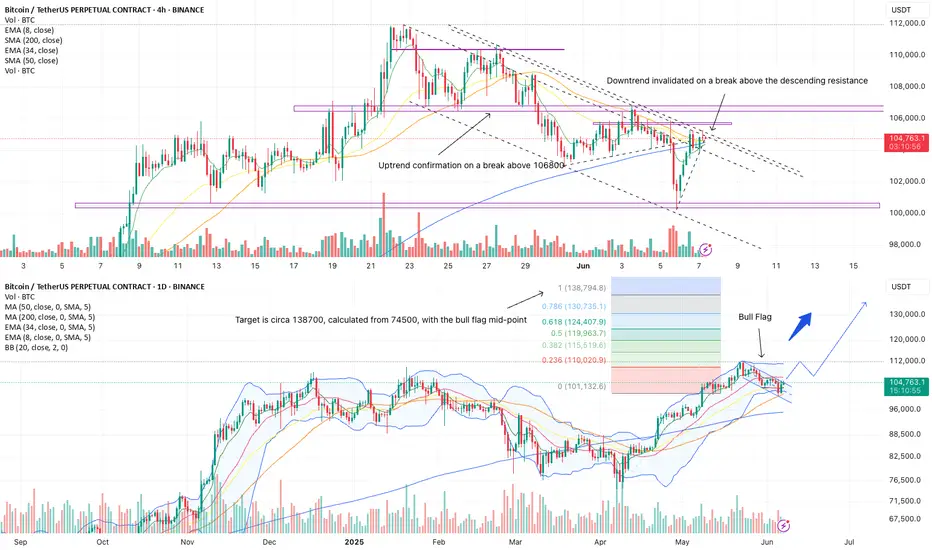
BTC Looking To Break Above Resistance Of Bull-FlagBTC showed a strong move off support at 100310 that is now looking to break above resistance of the bull-flag, which will signal the end of the decline. A daily break above 106800 is confirmation of the uptrend continuation, which should target ATH in the first instance. Following a pullback, BTC should then make its way to new highs, with a first target at 138000, which is a 100% extension from 74500, with a bull-flag mid-point.
Trades
Long on a break above the descending resistance (close on the 30min chart)
Add to long position on a break above 106800
Reduce position size at 112000, to allow for a brief pullback or potential consolidation at ATH
Return to 100% allocation on a solid close above 112000 or a pullback to 106800
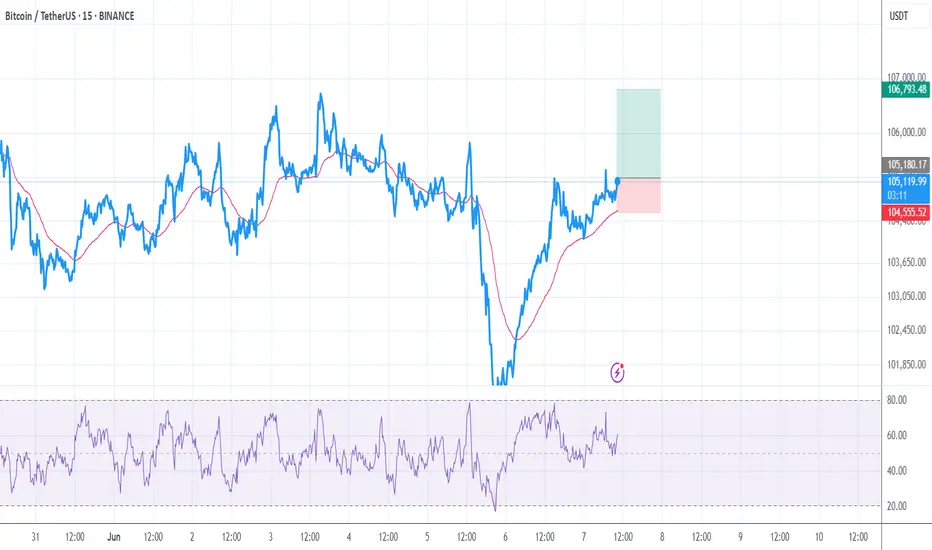
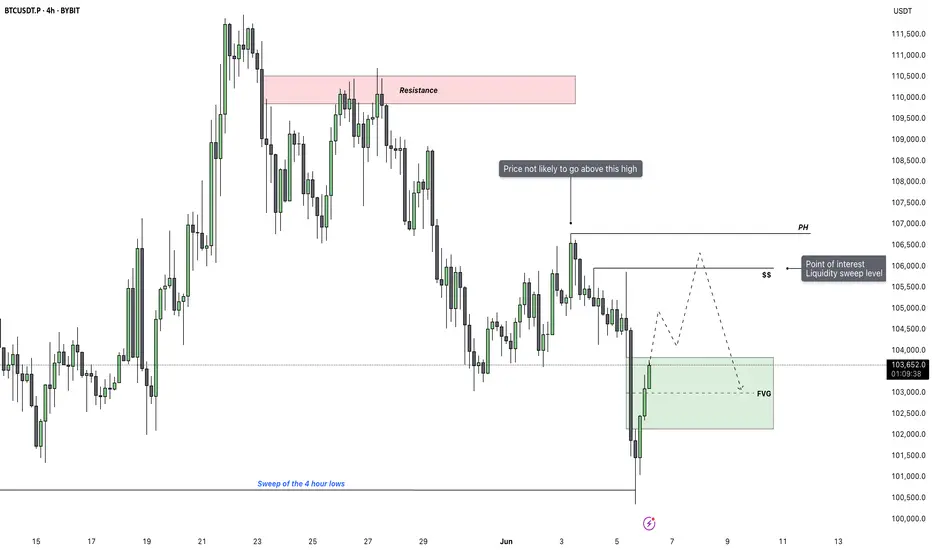
Bitcoin - Reclaim or Reject? Key 4H FVG Levels in FocusAfter an extended move lower, Bitcoin has just swept the major 4H lows and immediately bounced back with strength. This aggressive reaction suggests the sweep was likely a liquidity grab rather than a continuation. Price is now trading back inside a large 4H fair value gap, which could serve as a short-term magnet while market participants reassess direction.
Key Price Reaction and Fair Value Gap Context
The current rebound into the 4H FVG is notable. This zone holds significance because it's the last inefficiency left unfilled before the final leg down. If buyers manage to push through and close above this imbalance, it would indicate a short-term reclaim and open the door to a bullish liquidity sweep higher. The clean highs just above are marked by the $$ label, which align with a key inducement zone and should attract price if bullish momentum sustains.
Upside Scenario – Targeting the Liquidity Sweep
If we do see a clean move and close above the fair value gap, I’ll be looking for price to extend toward the highs just above it. These highs are likely to be the next target for liquidity collection, especially if short-term traders begin chasing strength. However, I’m not expecting price to trade beyond that zone. There’s a protected high resting above, and unless a significant fundamental shift occurs, it’s unlikely we break that structure.
Downside Risk – Failure to Hold Could Lead to 99K
If the market fails to close above the FVG or quickly gets rejected on a wick into it, the bullish scenario becomes invalid. That would confirm the move back up was simply a retracement after the sweep, setting the stage for further downside continuation. In that case, I expect the market to break lower and move toward 99K, which remains my downside target under bearish conditions.
Conclusion
Bitcoin just swept key 4H lows and is now testing a large imbalance. A close above could trigger a run on the $$ liquidity, but I do not expect price to move beyond that due to the presence of protected highs. On the other hand, failure to break and hold above the FVG opens the door for a deeper flush toward 99K.
___________________________________
Thanks for your support!
If you found this idea helpful or learned something new, drop a like 👍 and leave a comment, I’d love to hear your thoughts! 🚀
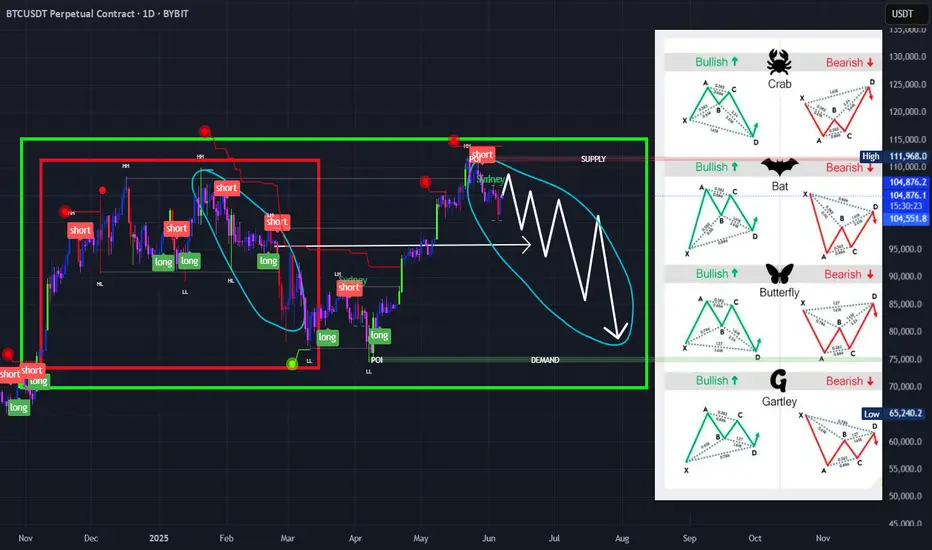
BTC harmonic patterns BITSTAMP:BTCUSD If you look on red rectangle there's similiar pattern to this forming on big green rectangle suggesting the same downward movement soon
BITCOIN 2024/2025THE current chart of btc shows a strong sign of recovery into 118k and 120k after updating 111k daily RED ascending supply roof of the structure, we need one more buy confirmation to see strong bullish healthy candles.
the bulls defended 100k level as that level represents a strong demand floor and break and a close below it will follow another layer of demand 96k zone
#btc #bitcoin

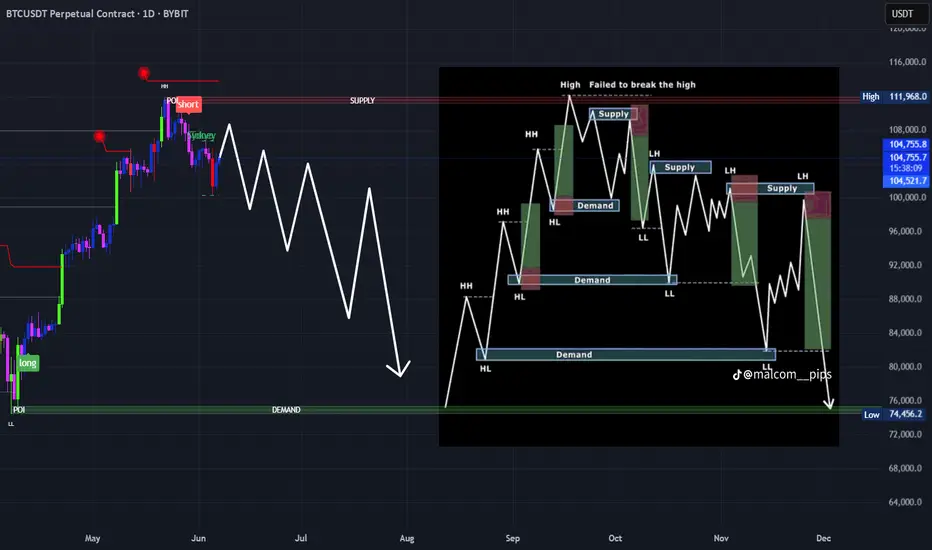
BTC SMC distribution BITSTAMP:BTCUSD That's my prediction about next BTC moves. It looks like classic SMC distribution phase. After reach ATH price failed to break it and fall. Soon I'm expecting move towards 108-110k before final strike down deeper than last time. According to my previous idea it was correct only I was wrong about top. Bearish harmonic pattern on daily time frame were correct
If you followed me you will be aware about thatGood afternoon everyone. About that Manipulation with Trump Elon Mask we know before its started. And its still not Finished yet. On this Chart you can found all need Price Information For today and this upcoming week.
BTC Showing Signs Of A Pullback In The Next 2 WeeksBTC is showing signs that it is getting ready for a temporary pullback. I suspect a descending triangle or pennant is forming on the 30min charts to signal the reversal and the best price to short will be between 109500-110000. This is confirmed with a daily close below 106300.

$BTC – Reclaim Test & Momentum Watch (4H)
📊 CRYPTOCAP:BTC – Reclaim Test & Momentum Watch (4H)
🔍 On the 4-hour timeframe, CRYPTOCAP:BTC is retesting the broken symmetrical triangle resistance. If price manages to reclaim this structure, it could open the gates for a bullish leg up.
🟠 At the same time, price is navigating within a descending channel. A clean breakout above the channel’s resistance — supported by strong momentum — would validate a potential trend shift and strengthen the bullish case.
⚠️ This dual structure — reclaiming the symmetrical triangle while challenging the descending channel — is critical for the next major move. If the reclaim fails, short-term bearish pressure could continue. However, if buyers step up, this could mark the start of a new impulsive wave.
👁️ Keep a close watch — the next move will shape market sentiment!

BTC bearish ideaBTC is still moving inside the downward channel and I don't expect it to break above, bitcoin will fall back down to the lower trendline.
BITCION TO $112,000Hello! Analyzing the Bitcoin price again. BTC's price action has remained in a very good consolidation zone, where it has shown strength and a real intention to remain bullish. Currently, Bitcoin is declining slightly, attempting to capture the latest liquidations to launch a strong bullish movement. The area of greatest interest is near the previous high. Volume and buying interest remain stable, and therefore, on a daily chart, the projection would remain bullish, without ruling out liquidity draws near $100,000.
Disclaimer: This is solely the opinion of a trader. It is not an investment recommendation.
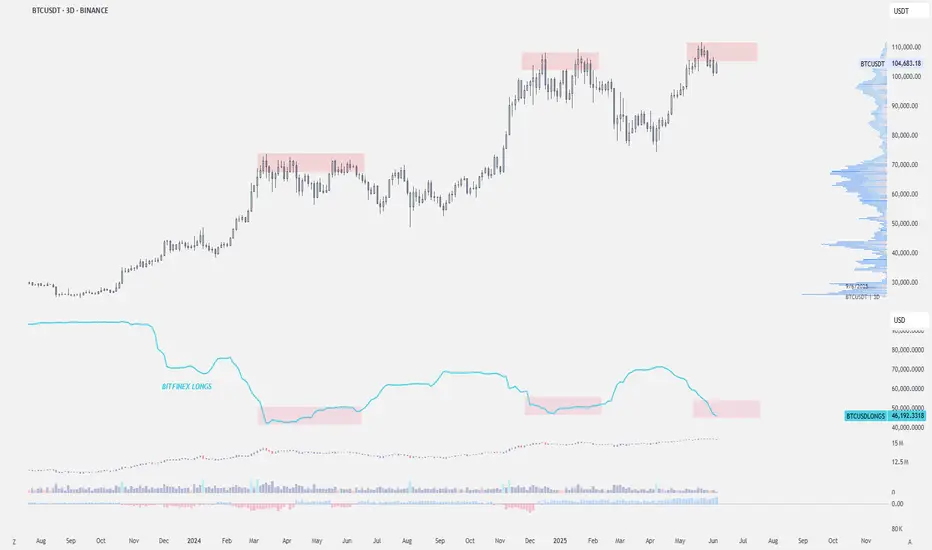
Bitfinex closed $BTC longs — local top?This Bitfinex Bitcoin long positioning is worth monitoring.
Each marked price top aligns closely with a local peak or plateau in Bitfinex longs, followed by distribution or a pullback.
Currently, Bitfinex longs have again plateaued or declined, just as BTC is forming a potential local top.
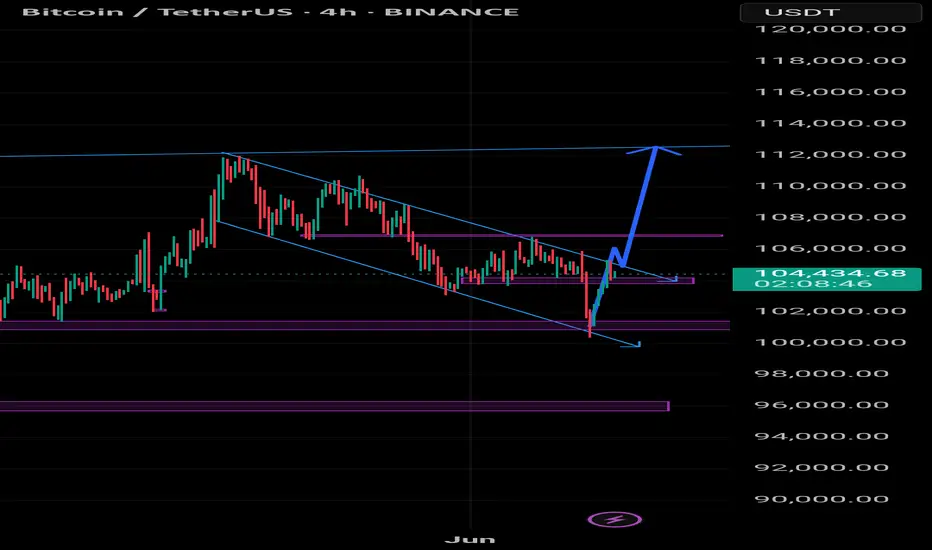
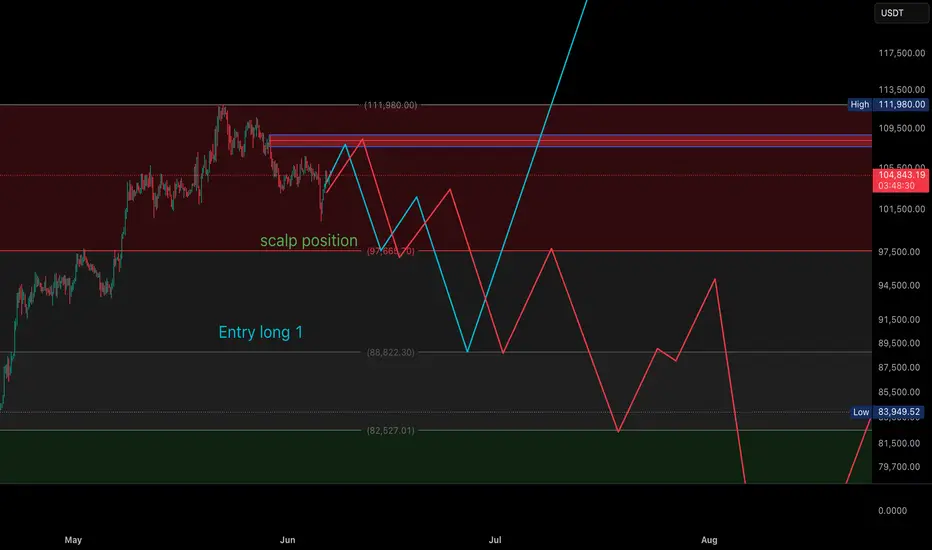
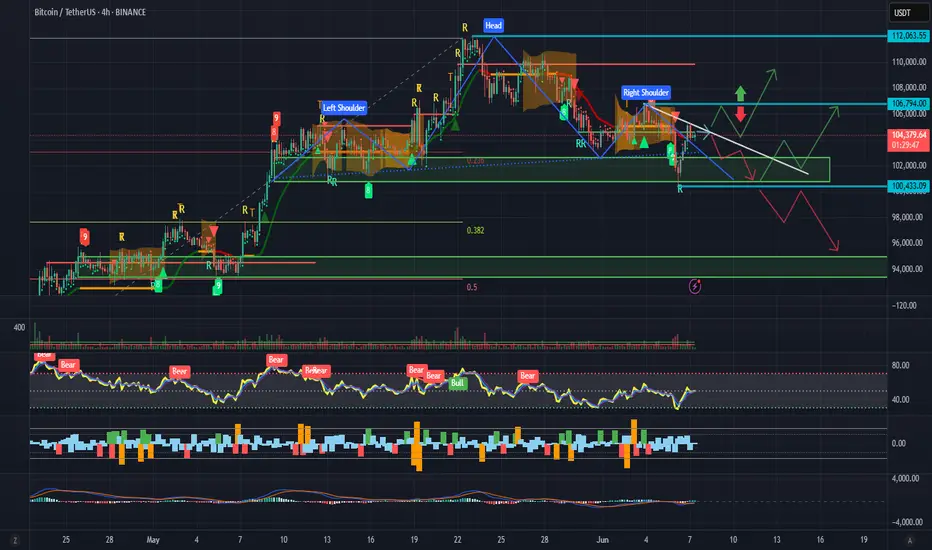
Bitcoin setup for next moveBTC 1day is in a larger accumulation range within a macro bull phase For a confirmed recovery from current levels price will need to break out of this 104.5k sideways move to reclaim the 106.8k level with a successful retest to move on upwards and test the ATH 112k area resistance If the 106.8k resistance breaks price down or the retest fails then we likely follow the red arrow to 100.5k first support level in the green box We would need to bounce hard from 100.5k in a classic bottom V pattern to follow the green line back to test the 106.8 resistance for the second time on this idea Obviously if support fails at 100.5k we follow the bottom red arrow down to the 95-93k high demand area in the green box In support of the 100.5k solid support area we see that this level will complete a local Head & Shoulders pattern for a solid bottoming The key levels are 106.8k resistance and 100.5k support creating this recent accumulation range It could also be argued that we are in a larger Head & Shoulders pattern with the bottoming at the 95-93k high demand area...have fun the Institutions are here in force and retail is nowhere to be found
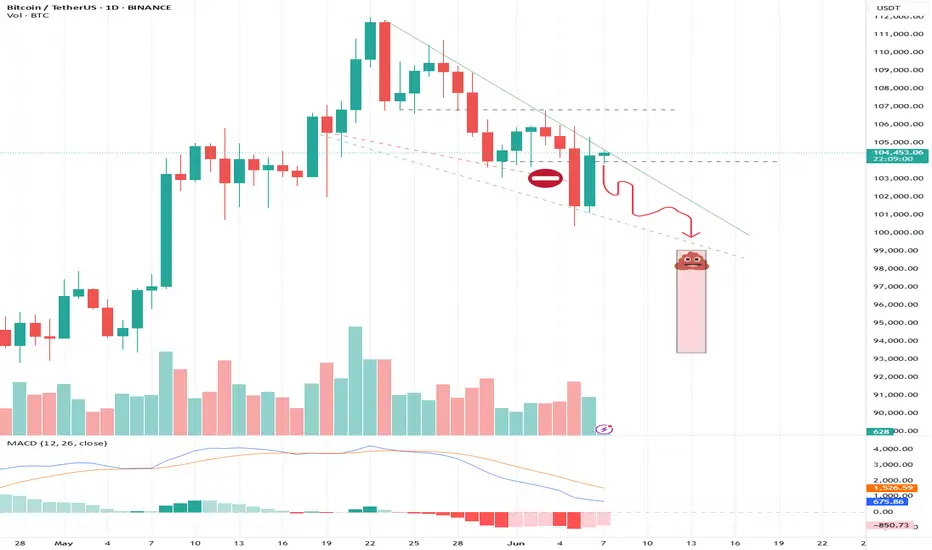
BTC dump in a fake wedgeIt looks like BTC is just going to dump in a fake wedge being rejected level by level, until a final waterfall.
Btcusdt 4hr time frameA bearish H&S pattern is forming. Minor and major gaps at 98k and 86.5k still need to be filled, which may delay an all-time high.
Still far from 100 daily ma.

BtcusdtCompletion of the current bullish flag pattern could lead to a potential increase in price in btc