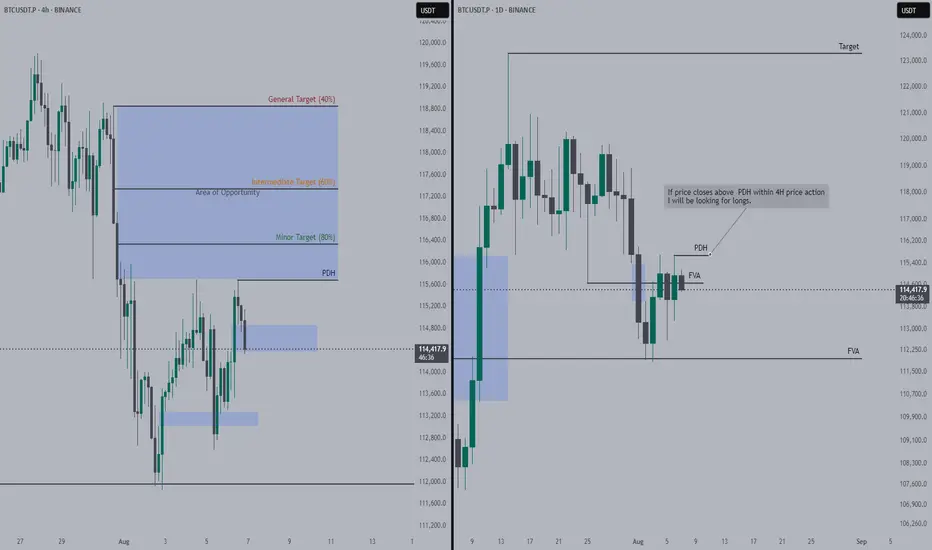
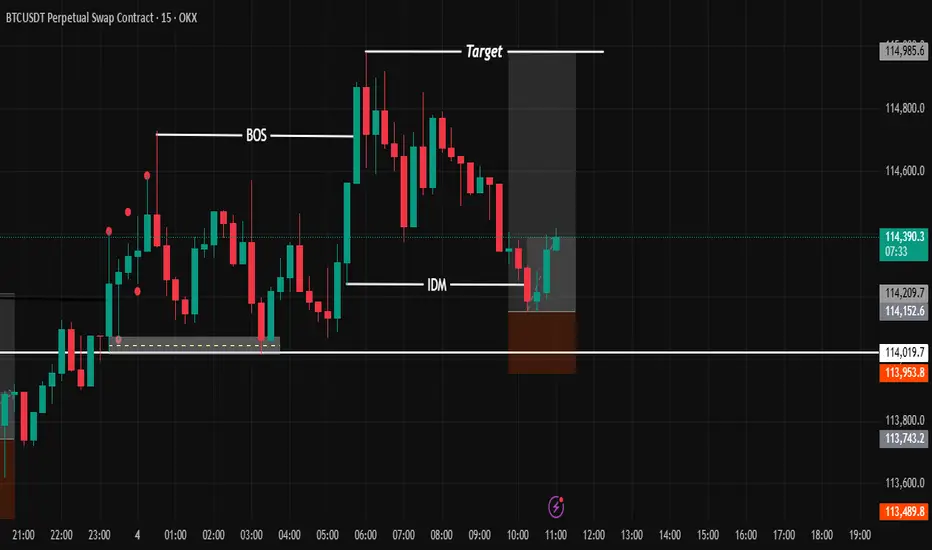
If Bitcoin holds up the pullback, longs incomingBullish imbalance on 4H holds price to not submit to the lows.
I will engage once the PDH gets run through and 4H candles closes above. Only engage within the Area of opportunity.
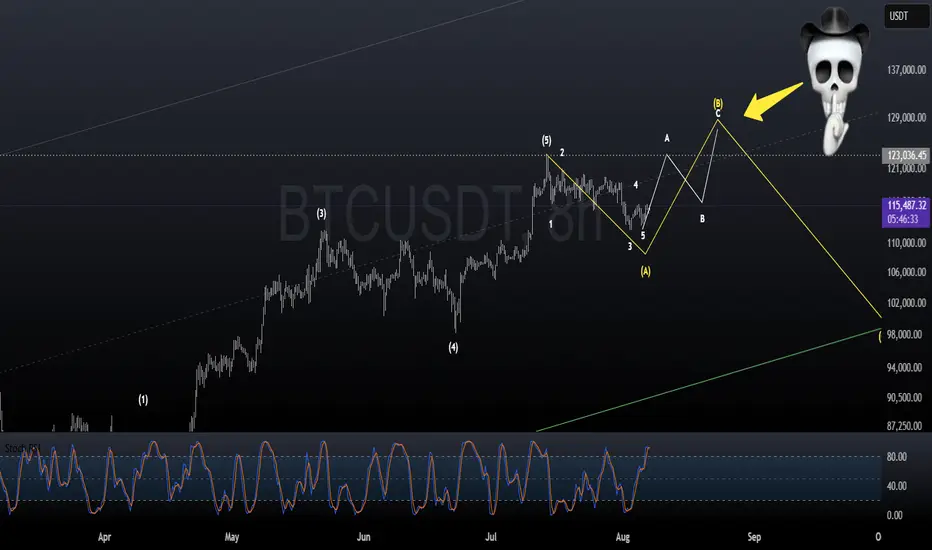
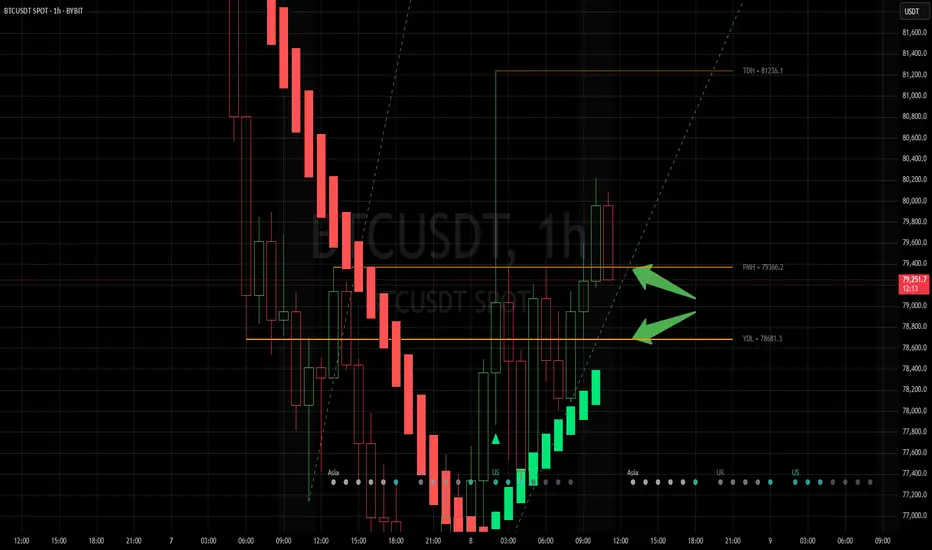
Targets have been outlined with their success rates.
BTCUSDT.5S trade ideas
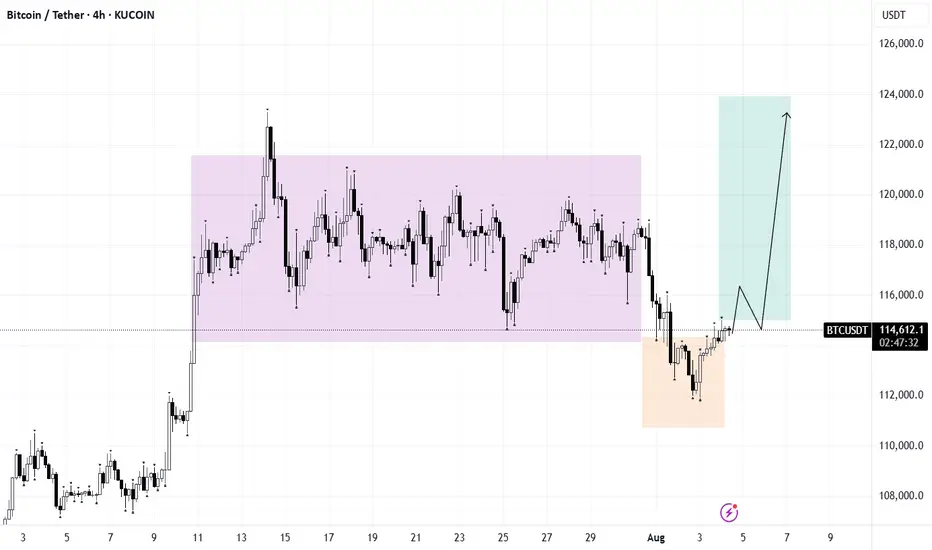
BTC – Summer chop arrived?Some rotations I'm looking for BTC.
Volatility is slowly cooling off, also noticeable in options premiums so I'm not expecting any big moves and mostly focussing on intraday moves.
That doesn't mean we can't mark more htf POIs of course.
1. Clean up the bad lows we left yesterday, but protect the low from CME open this week. Gives a really nice setup and RR
2. Take a stab lower into 110-111k. I think the sweep can be frontran here, so it's possible we have to stay alert and enter a bit sooner.

BTC-----Sell around 114500, target 113500-113000 areaAugust 5th BTC Contract Technical Analysis:
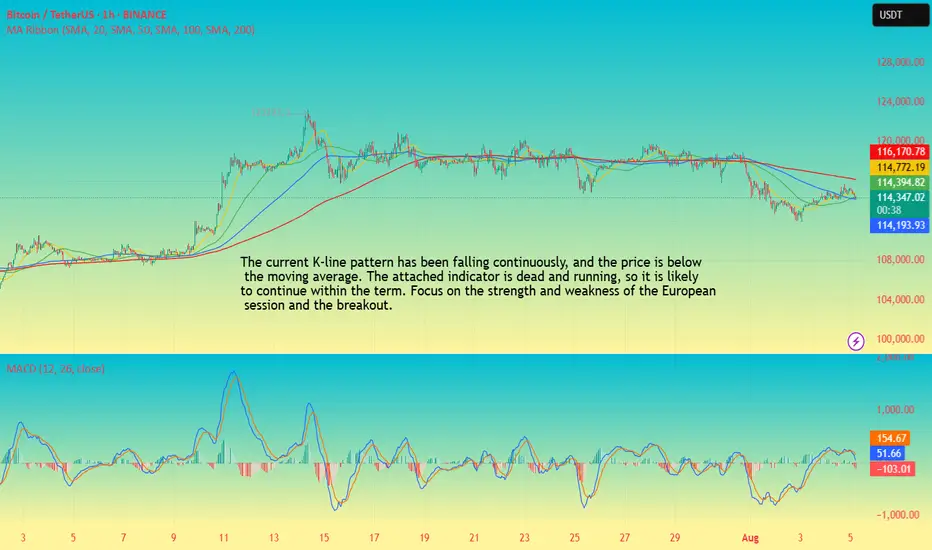
Today, the daily chart closed with a small bullish candlestick pattern, with prices remaining high. However, the accompanying indicator forms a death cross. While the broader trend remains bearish, the market is still trending downwards. However, yesterday's significant upward trend suggests a range-bound trend in the short term. Without a continuation of the trend, a significant unilateral move is unlikely. On the hourly chart, yesterday's intraday gains continued in the European and American sessions, but prices failed to break above the previous high. The current candlestick pattern shows consecutive bearish candlesticks, with prices trading below the moving average and the accompanying indicator forming a death cross. Therefore, continued support is crucial for the day, with the strength and potential breakouts of the European session also key.
Today's BTC Short-Term Contract Trading Strategy:
Sell on pullbacks to the 114,500 area, with a stop-loss at 115,000, and a target of 113,500-113,000.
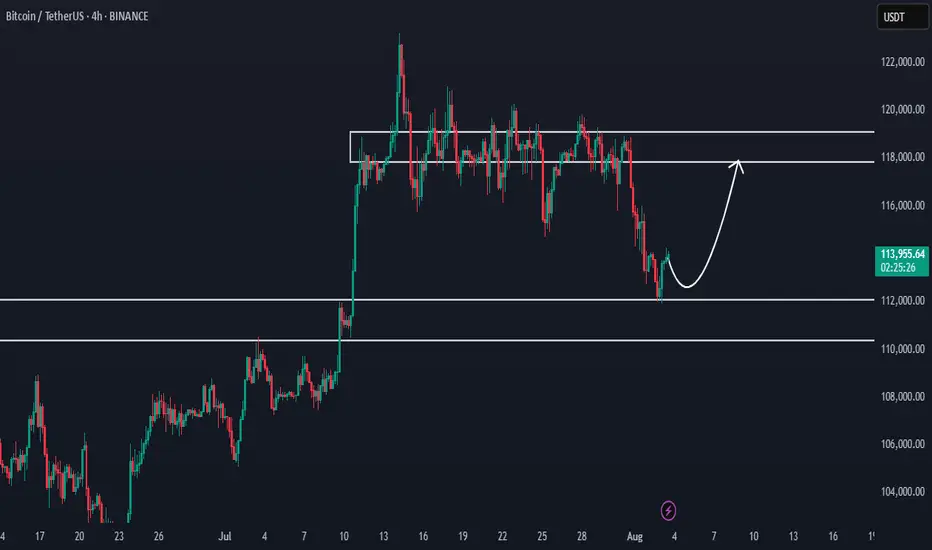
BTC - Falling or Going up? Will it go 120k?BTC's move as said is something to be taken care off, while if it falls below from the point i drew needs to be seen

BTC(20250808) market analysis and operationAugust 8th BTC Contract Technical Analysis:
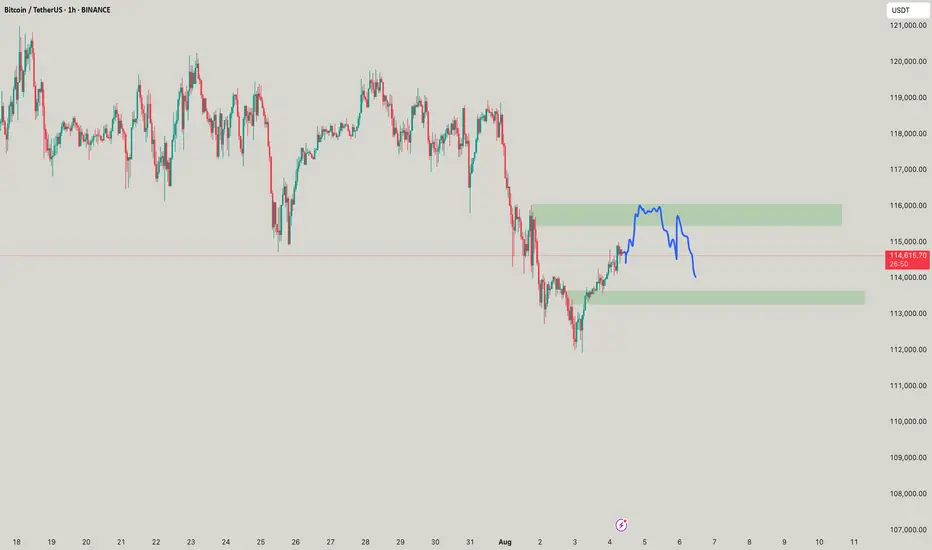
Today, the daily chart closed with a small bullish candlestick pattern, with prices rising above the moving average. The accompanying indicator formed a death cross and showed shrinking volume. The overall upward trend is currently dominant. Although there was a significant pullback at the beginning of this week, it has not continued. However, the upward trend continues, with consecutive highs broken. Positive news and data are driving prices higher. The short-term hourly chart currently shows a series of bearish candlestick patterns and a death cross. This suggests a strong intraday pullback, with support at the 115,500 area. This is a level to watch during the European session. Furthermore, today, Friday, is a cautious market.
Today's BTC Short-Term Contract Trading Strategy:
Sell at the current price of 116,500, with a stop loss at 117,300 and a target of 115,500. Buy if the price does not break below 115,500, with a stop loss at 115,000 and a target of 117,000.

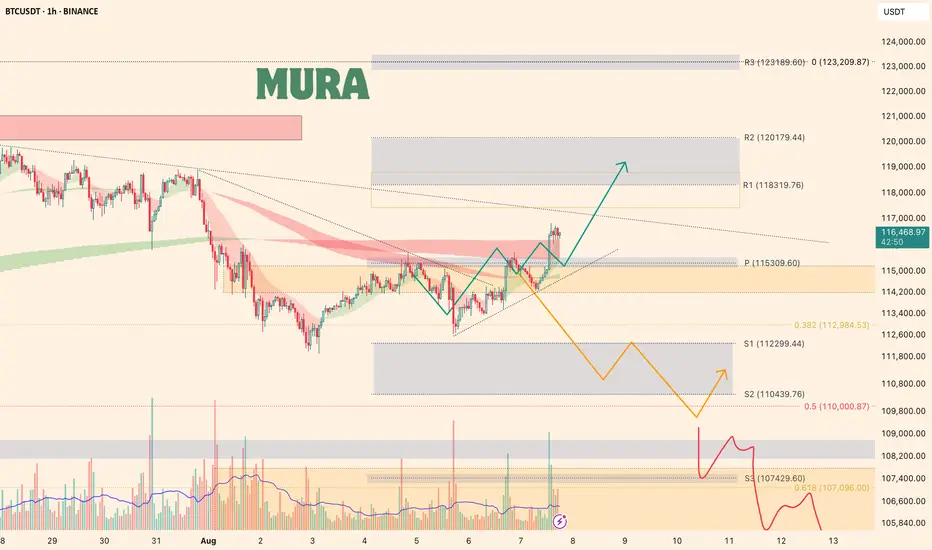
Bitcoin Market OverviewBitcoin is currently following the bullish (green) scenario. The 1H RSI is overbought, and the 4H RSI is already above 70, so I'm closely watching the price action. A local correction would be logical before a potential move up toward the resistance zone at $118,319–$120,179 .
If the price drops back below the $115,000 level, I’ll be looking for a decline toward the support zone at $112,300–$110,400 .
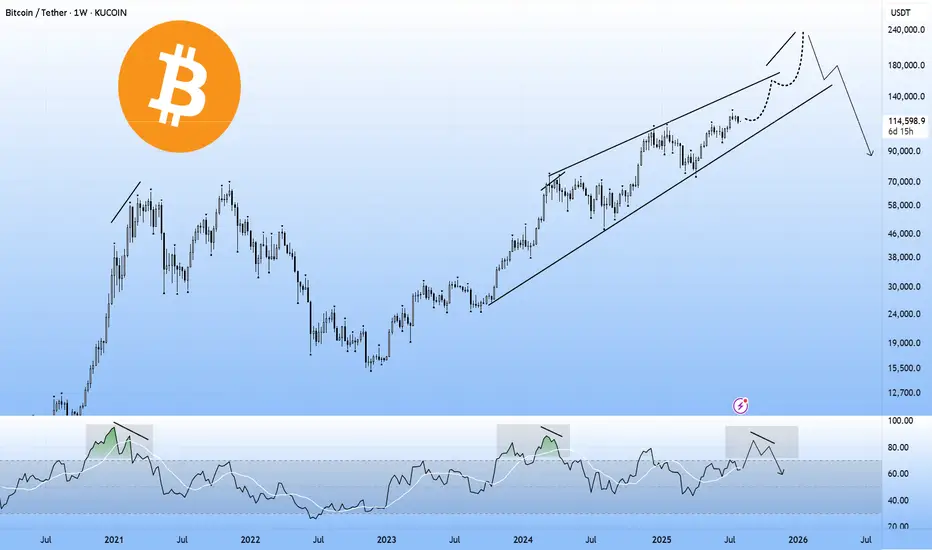
BTC, the clock is tickingLet the chart speak for itself. BTC will make new ATH before the Fed Pivot. After the pivot however, panic will occur and there will be blood on the streets.
You have been told.
P.S Not financial advice.
BTC/USDT Analysis — First Signs of Buyer Support
Hello everyone! This is the daily market analysis from the CryptoRobotics trading analyst.
Yesterday, Bitcoin experienced another wave of decline but failed to reach the local low. A strong absorption of sell orders occurred, and a local support zone formed at $113,300–$112,700. We currently interpret the resulting volume as being positioned for buying.
We are now waiting for a retest of two local support zones:
$114,500–$114,000 (mirror volume zone)
$113,300–$112,700 (local absorption of selling pressure)
From there, we consider local long entries.
The movement potential is aimed at the next sell zone.
If price drops further and shows no reaction within these zones, it's important to closely monitor the price reaction near the $112,000 level.
Buy Zones:
$114,500–$114,000 (mirror volume zone)
$113,300–$112,700 (local absorption of selling pressure)
$110,000–$107,000 (accumulated volume)
Sell Zones:
$115,000–$116,300 (mirror volume zone)
$117,600–$118,600 (accumulated volume)
This publication is not financial advice.
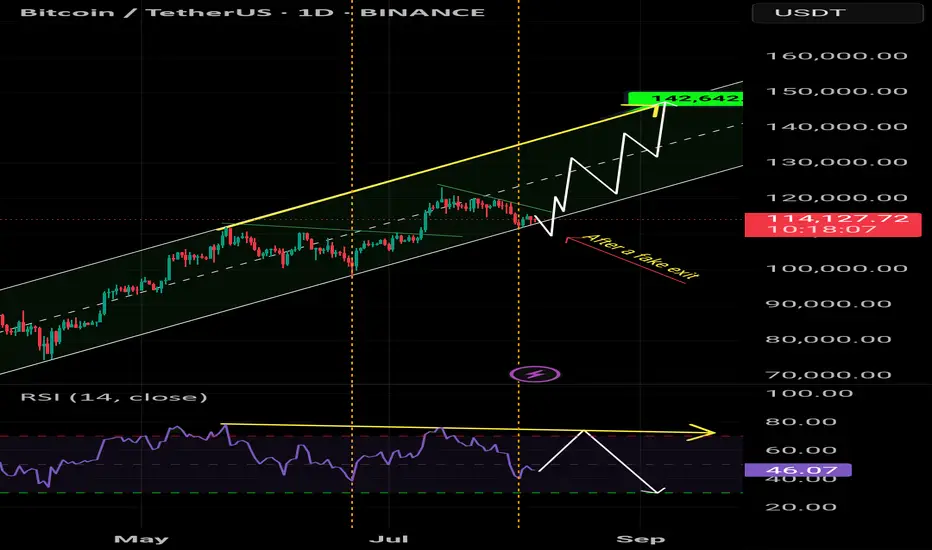
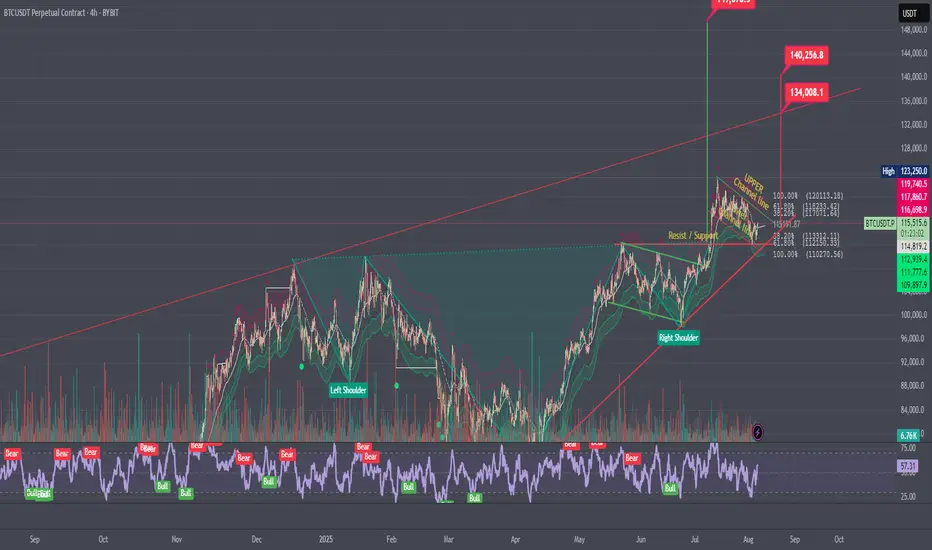
Bitcoin Go 140kAfter a fake exit and a trick, it goes strongly towards the ascending channel and liquidates everyone. The target for Bitcoin is 140,000.
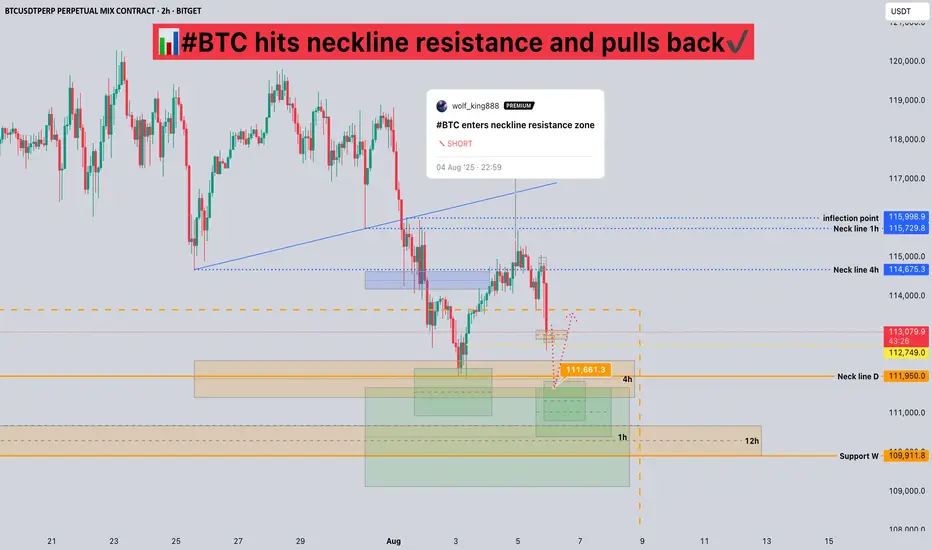
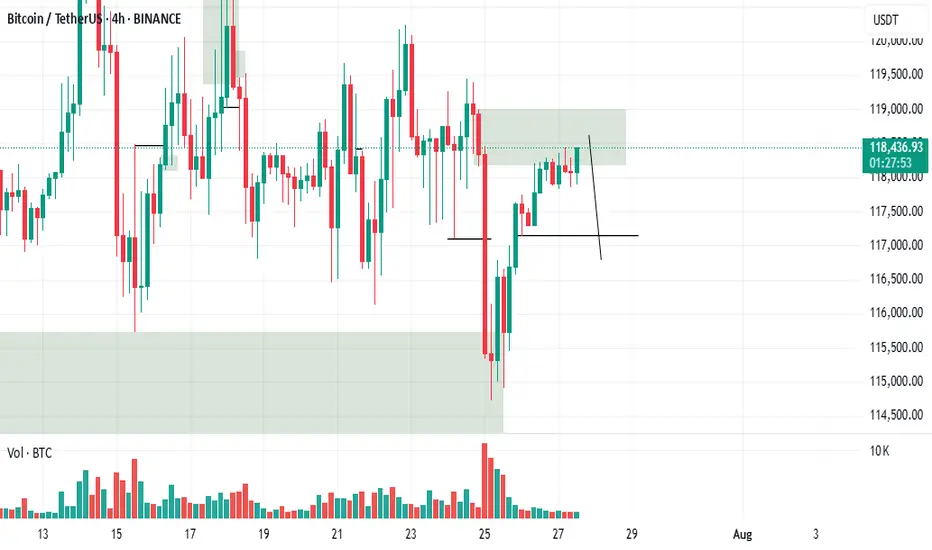
#BTC hits neckline resistance and pulls back📊#BTC hits neckline resistance and pulls back✔️
🧠From a structural perspective, we've retreated after hitting resistance at the neckline, as expected. If the current structure continues to decline rapidly, we could potentially retest support near 112,000, or perhaps break below the previous low to sweep liquidity before rebounding.
➡️The resistance zone remains clear. Only if the neckline resistance zone is broken and stabilizes for a day or so can we maintain a positive bullish stance.
Let's see 👀
🤜If you like my analysis, please like 💖 and share 💬 BITGET:BTCUSDT.P
BTC/USDTPossible AMD setup forming. Entry only after clear confirmation.
If validated, the target is a move toward new ATHs.
However, if downside pressure continues, we could see a correction below the $110K level.
Stay reactive — not predictive.
Bitcoin at Key Support - Watching for Bullish ShiftHello everybody!
Bitcoin has reached a very important demand/support zone between 110,000–112,000.
If this area holds, we could see bullish momentum building on the chart.
Currently, we are waiting for confirmations.
We're watching closely for any change in market structure or a trend shift.
If it happens, we can expect the price to move up to around 118,000.
Manage your risk and trade safe!
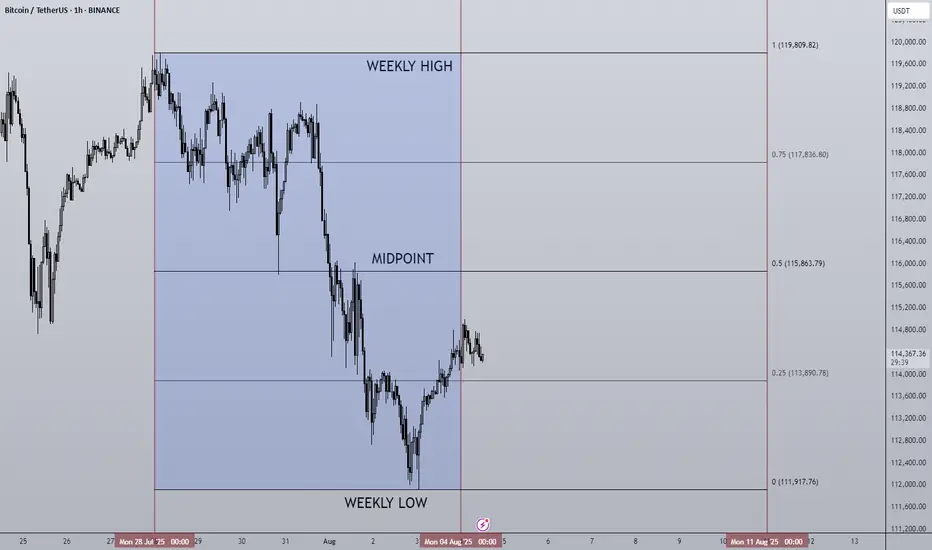
04/08/25 Weekly OutlookLast weeks high: $119,809.82
Last weeks low: $111,917.76
Midpoint: $115,863.79
First net outflow for BTC in seven weeks (-$643m) following the FOMC data release and also month end. Yet again no change by the FED but the chances of Septembers FOMC giving us a rate cut has drastically increased, currently at a 78.5% chance of a 25Bps cut.
Month end usually gives us a pullback/sell-off as larger institutions window dress which often includes de-risking somewhat. We saw this last Thursday combined with the weekends typical lower volume has resulted in quite a significant correction for BTC. Altcoins have down the same as many assets reject from HTF resistance areas, the correction has been on the cards and isn't too worrying on the face of it.
What I would say is August seasonality is generally not a bullish month and so expecting price to rebound and extend the rally would go against historical trends. I could see more of a ranging environment taking place for several weeks before any next leg up is possible.
This week I would like to see where altcoins find support and establish a trading range where some rotational setups tend to present themselves.
BTC rally starts / 241.000$Bitcoin is entering the last bullish rally before bear market. I want to see new phase of euphoria on crypto and altcoins also and overbought on RSI indicator
btc signalThe analysis went well, but put the breakeven and would you like me to put more signals? I would be happy to hear your comments.Two signals and two profits. Thank you for your attention.

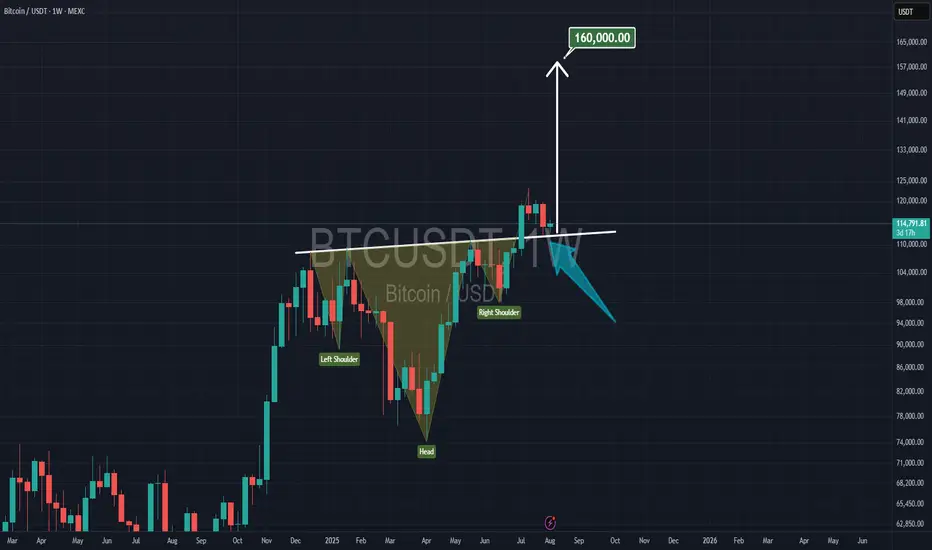
Bitcoin inverted HEAD & SHOULDERSIf this is an inverted HEAD & shoulders pattern for bitcoin, then the neckline is already broken and bitcoin is Back testing that now, well the target is $160k as well
Why I'm bullish on Bitcoin!While everyone starts questioning if its over for Bitcoin, I'm bullish
Inverse head and shoulder going into 2 bull flags so far. Target is 149k'ish.
Unless I see some movements that cancel out these patterns I'm forever bullish.
Support on 112k is important to stay above if we break below and close below forget about this idea.
Short Probably!Hello all. before all I wanna tell you that I am not a crypto trader and it is unknown market to me but if it works as Forex market, market will go down from here. be happy(wink)
I just got filled for a long hereAs an alert I just got filled with a small limit order long and intend to add to it within this range with more frequency in the bottom half with (again) very small orders as I want to average down my entry price before we ideally pump up next if it works out that way. And if not (so in the case we gradually keep grinding down in price) I can continue to add longs until we get a bounce which may provide the opportunity to get out at break even or a small profit. But I am happy with the value of the areas I have focused on and not chasing pumps. Enjoy!
Using PAR looking at Daily than lower time framesUsing PAR looking at Daily than lower time frames to find the best entry.

BTC/USD) Bullish Analysis Read The captionSMC Trading point update
Technical analysis of Bitcoin (BTC/USDT) on the 4-hour timeframe, with a focus on smart money concepts like FVG (Fair Value Gap) and support/resistance zones.
---
Technical Breakdown:
1. Price Structure & Path Projection:
BTC is currently in a sideways range, but the drawn projection suggests a potential bullish reversal from the key support zone or the FVG level.
Two bullish paths are suggested:
One bounces from the key support zone (~114,725).
The other dips deeper into the FVG level, sweeping liquidity before heading higher.
2. Key Zones:
Key Support Level: Around 114,700–114,800, aligning with the EMA 200 and prior reaction levels.
FVG Level (Fair Value Gap): Just below the support zone — marked as a potential liquidity sweep area before bullish continuation.
Resistance Zone: 123,069.65, where partial profit could be taken.
Final Target Point: 130,312.02, projecting a strong bullish move from the base.
3. EMA 200 (Blue):
EMA sits around 114,685.97, acting as a strong dynamic support, supporting the bullish scenario.
4. RSI (14):
RSI is neutral at 51.10, providing room for bullish momentum without being overbought.
Mr SMC Trading point
---
Trade Idea Summary:
Bias: Bullish
Entry Zone:
Conservative: Near 114,725.18 (key support + EMA 200)
Aggressive: Deeper at FVG level if price sweeps that zone
Targets:
TP1: 123,069.65 (resistance zone)
TP2: 130,312.02 (main target)
Invalidation: Break and close below FVG zone would negate the setup
---
Please support boost 🚀 this analysis)
