BTCUSDT – Diametric G-Leg Underway?⏱ Timeframe: 4H / 1H
🔍 Method: NeoWave + Smart Money Concepts (SMC)
📍Posted by: CryptoPilot
⸻
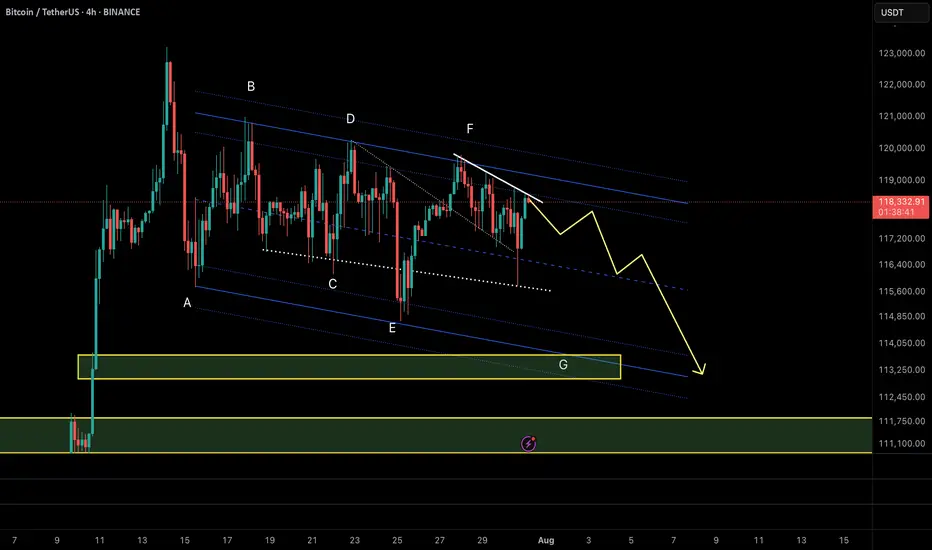
🧠 NeoWave Progression Update
As outlined in our previous analysis, we are tracking a potential Contracting Diametric structure (A–G) originating from the March 2025 highs.
🚨 The G-Leg may now be actively unfolding.
Here’s what just happened:
• Price rejected sharply from the supply zone near 119,000–119,500, exactly where Wave F was expected to end.
• After a drop to 115,780 (minor trendline), price bounced, but failed to make a new high, stalling at 118,700, forming a lower high → classic signature of a developing G-Leg.
• This G-wave likely aims to break below Wave E low, seeking imbalance fills and structural resets.
⸻
📊 Smart Money Confluence (SMC / ICT)
• 🟥 Bearish Market Structure confirmed via MSS on 1H: Lower Highs + Internal BOS
• 🟨 Buy-side Liquidity above 120k was already swept
• 🔻 Price failed to reclaim OB block around 119.5k
• 🧩 FVGs remain open between 114.5k–113k, acting as magnet zones
• 📉 Expectation: Price may now break the ascending minor trendline and accelerate toward the major structure low
📌 Primary Scenario:
• Wave G of Diametric in motion
• Potential structure: Zigzag or Complex Combination
• Expectation: Bearish continuation to break below 113k
📌 Alternative Scenario:
• If price closes above 120.5k, diametric structure may be invalidated
• Watch for triangle/flat development instead
⸻
⚠️ Risk Management Note:
Price action near 118.7k–119.5k is crucial. Reclaiming that zone with strength changes the bias. Until then, sellers remain in control.
💬 Final Thought:
We’re tracking the final stages of a multi-month complex correction. The rejection at supply, combined with SMC signals and NeoWave symmetry, suggests sellers may push price into deeper demand zones soon.
⸻
📌 Follow CryptoPilot for advanced wave structure updates, market geometry insights, and ICT-style smart money traps.
💬 Share your views or alternate wave counts in the comments!
BTCUSDT.5S trade ideas
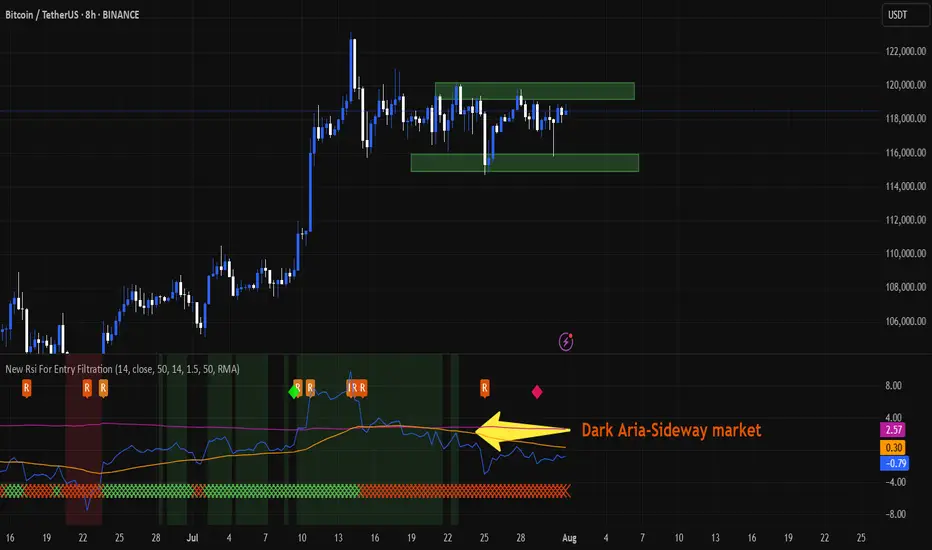
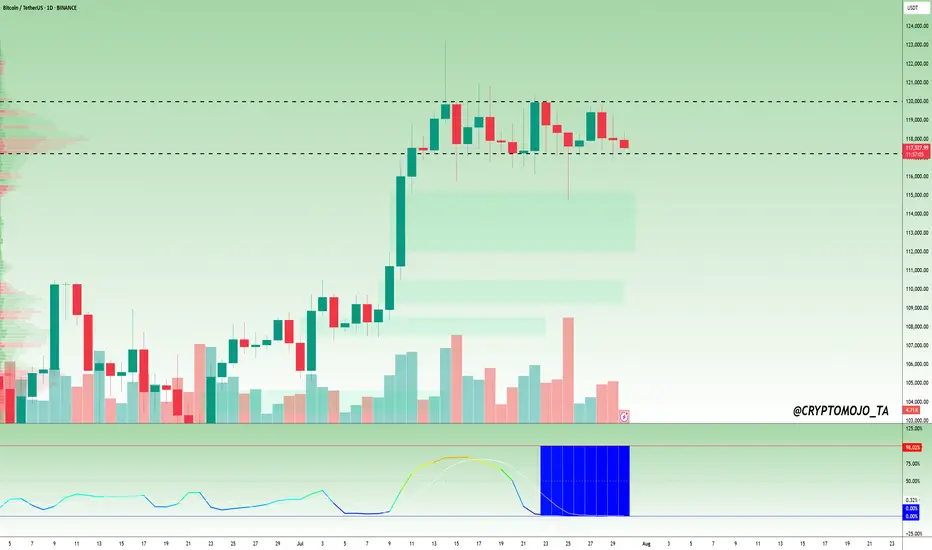
daily #bitcoin analysisBitcoin is fluctuating between the two price areas of $115,000 and $120,000 and I don't think it will trend either up or down anytime soon. Unless it breaks the two mentioned areas from above or below. As we can see, the new RSI indicator also shows a sideways trend. This analysis is not a financial recommendation in any way.
White House Crypto Report Incoming: Will BTC Pump from Support? One of the important news for Bitcoin ( BINANCE:BTCUSDT ) that was released today was that " White House confirms first Bitcoin and crypto report will be released TOMORROW ". Bitcoin is likely to rise with the release of the White House report .
What do you think? At least a temporary pump may be in store for Bitcoin.
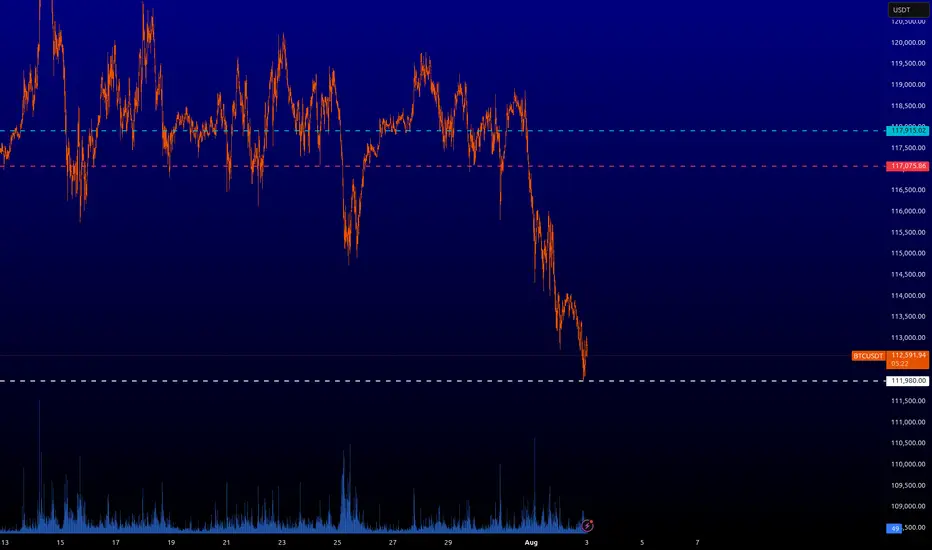
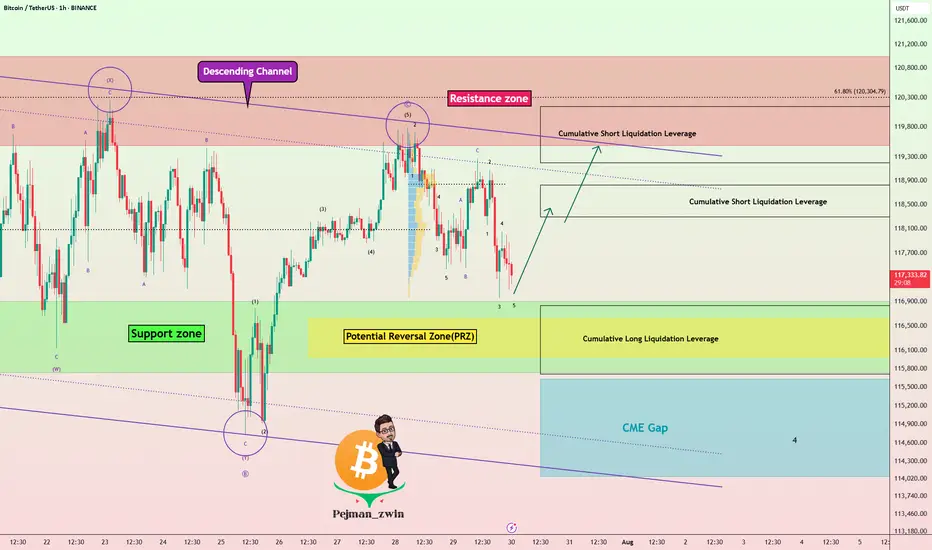
Bitcoin fell to the Support zone($116,900-$115,730) and filled the New CME Gap( $119,500-$118,295) as I expected in the previous idea .
Bitcoin is currently moving near the Support zone($116,900-$115,730) , Cumulative Long Liquidation Leverage($116,828-$115,710) and Potential Reversal Zone(PRZ) .
I expect Bitcoin to rise from the Support zone($116,900-$115,730) to at least $118,680(First Taregt) .
Second target: Upper line of the descending channel
Note: Stop Loss: $114,680 = Worst Stop Loss(SL)
CME Gap: $115,060-$114,947
Cumulative Short Liquidation Leverage: $118,827-$118,298
Cumulative Short Liquidation Leverage: $120,144-$119,200
Please respect each other's ideas and express them politely if you agree or disagree.
Bitcoin Analyze (BTCUSDT), 1-hour time frame.
Be sure to follow the updated ideas.
Do not forget to put a Stop loss for your positions (For every position you want to open).
Please follow your strategy and updates; this is just my Idea, and I will gladly see your ideas in this post.
Please do not forget the ✅' like '✅ button 🙏😊 & Share it with your friends; thanks, and Trade safe.
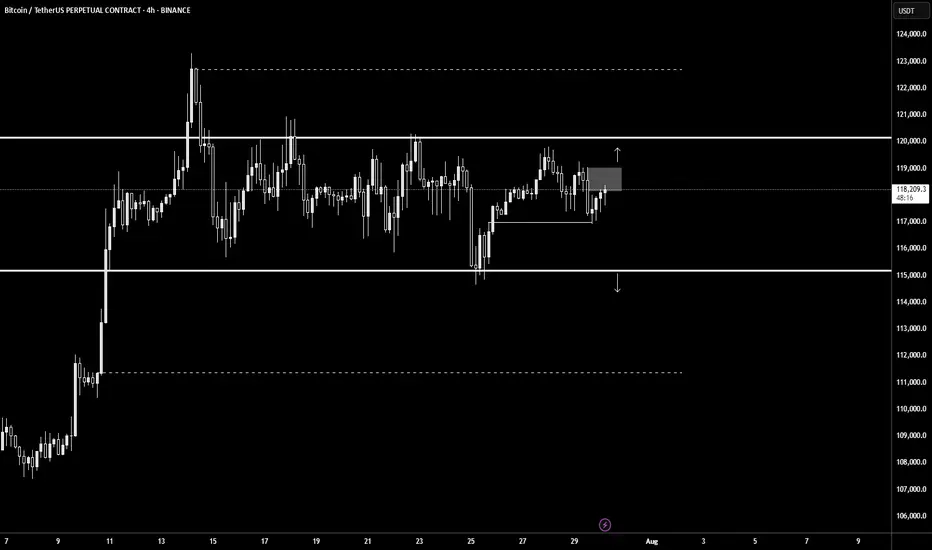
$BTC Daily Timeframe Update! #Bitcoin ( CRYPTOCAP:BTC ) is still moving sideways, consolidating in a tight range between ~$117,400 and $120,100, just below recent local highs. The market is showing clear signs of compression, and the BBWP (Bandwidth Width Percentile) is flashing a deep blue near 0%, which signals extremely low volatility.
Historically, this kind of BBWP reading comes before big price moves. However, the direction is still uncertain as BTC trades between key resistance and minor support.
Key Levels to Watch:
Resistance: ~$120,100
Support: ~$117,400
BBWP: ~0% tight volatility coil
If BTC breaks above $120K, it could lead to strong upside continuation. But if it drops below $117.4K, we might see a deeper correction.
📌 Tip: Wait for volume and BBWP expansion to confirm the next move. The spring is tightly wound, a big breakout is likely coming soon.
DYOR, NFA
Bearish sign on BTC targeting 97kmy idea on btc as per the chart watch 110 level if broken then 102k then 97k

BTCUSDT.PThe best area to buy MARKETSCOM:BITCOIN is $119,000 and wait for the pullback to be complete.
But for selling and shorting, be sure to wait for $115,000 to break down.
⚠️Please control risk managements.
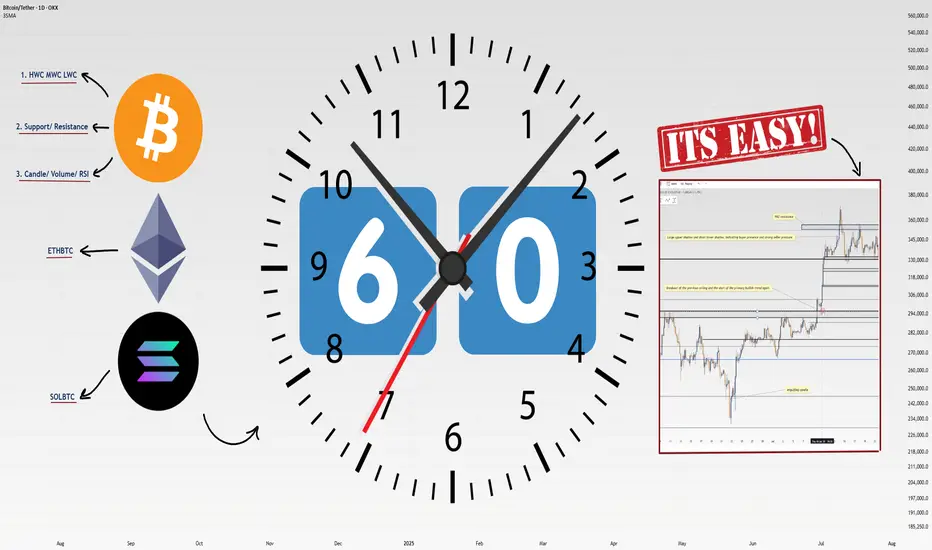
How I Analyze Any Coin in 60 Seconds: 4-Step Masterclass!Heyy traders, it’s Skeptic from Skeptic Lab! 🩵 I’m breaking down my lightning-fast method to analyze any coin in just 60 seconds . This 4-step process is how I spot long/short triggers like a pro. Buckle up, let’s dive in:
✔️ Step 1: Identify HWC/MWC/LWC (10 seconds)
Nature’s got a cool vibe—bet a lot of you hit the outdoors on weekends. When I see an apple tree from afar, it’s majestic, but up close, I spot branches and worm-eaten fruit. From a distance, I miss the details; up close, I lose the tree’s grandeur. Markets work the same. You need different timeframes to grasp the market structure. With practice in Dow Theory, trends, and tools, spotting HWC (Higher Wave Cycle), MWC (Mid Wave Cycle), and LWC (Lower Wave Cycle) becomes second nature. For me, this takes 10 seconds.
Want a full HWC/MWC/LWC guide? Check my free article I wrote a while back—it’s a hands-on tutorial ( link Cycle Mastery ).
📊 Step 2: Draw Support/Resistance Lines (20–30 seconds)
I start with higher timeframes: Monthly, then Weekly, then Daily. Once I’ve drawn lines up to Daily, I don’t always redraw for lower timeframes—often, I just adjust them.
Pro tip : Give more weight to the right side of the (recent data) since it’s fresher and more valuable. I change line colors for 4-hour lines, so I know they’re less critical than Daily. I don’t draw lines below 4-hour, but if you’re a scalper, tweak this to your strategy. This step takes me 20–30 seconds, the longest part.
📉 Step 3: Analyze Candles, Volume, Oscillators, and Indicators (10–15 seconds)
Here, I check everything I can: candles, volume, oscillators, and indicators . The goal? Stack confirmations for my triggers. Think RSI hitting overbought, volume spikes, larger candle sizes, or momentum surges—you get the vibe. This step’s length depends on your tool mastery. For me, it’s quick because I know what to look for.
🔔 Step 4: Check Coin Dominance (5–10 seconds)
This is the most critical yet simplest step. We need to track where liquidity’s flowing . For example, if SOL/BTC is bearish, I skip buying Solana—liquidity’s exiting. BTC.D (Bitcoin Dominance) is also key. The relationships dominance creates are complex and don’t fit in one analysis, but if you want a full dominance tutorial, drop it in the comments!
🔼 Key Takeaway: Using these 4 steps—HWC/MWC/LWC, support/resistance, candles/indicators, and dominance—I analyze any coin in 60 seconds. Your speed depends on experience and knowledge. If you’re new, this might take 60 minutes per coin, but don’t sweat it— practice makes you lightning-fast . Thanks for vibing with this educational idea! <3 I’ll catch you in the next one—good luck, fam!
💬 Let’s Talk!
Want a dominance tutorial or more tips? Hit the comments, and let’s crush it together! 😊 If this guide lit your fire, smash that boost—it fuels my mission! ✌️
Bitcoin in 15minCaption important🛑🛑🛑
Hello to all traders. 😎😎
I hope all your deals will hit their targets. 🎉🎉
I’m opening a short position on Bitcoin from the current level, targeting $118,200 as the first take-profit, and $117,600 as the second target.
⚠️ This is a high-risk trade, so make sure to apply proper risk management.
What Do You Think?
Which scenario do you think is more likely to happen? **Share your thoughts!** ⬇️
Don't forget that this is just an analysis to give you an idea and trade with your own strategy. And don't forget the stop loss🛑🛑🛑
❤️❤️❤️The only friend you have in financial markets is your stop loss❤️❤️❤️
Please support me with your ✅' like'✅ and comments to motivate me to share more analysis with you and share your opinion about the possible trend of this chart with me 🙏😊
Be Happy , Ali Jamali

BTCUSDT analysis – 1H & 4H OB setups✅ The overall market trend is still bullish on the 1H and 4H timeframes. However, we’re watching the red 4H supply zone (around 122,000) closely for a possible short-term sell setup.
🟥 If price reaches this red OB, we’ll look for a light short position only with confirmation on the 5M or 3M timeframe.
🟩 On the downside, we are mainly interested in buy setups from the following key green OB zones:
🔹 OB 1H around 115,000
🔹 OB 4H around 111,000
🔹 OB 4H around 108,000
📌 Possible scenarios:
1️⃣ Price reaches the red OB → short with confirmation
2️⃣ Price pulls back to lower green OB zones → long with confirmation
3️⃣ Market bias remains bullish unless proven otherwise.
❌ No entry without confirmation.

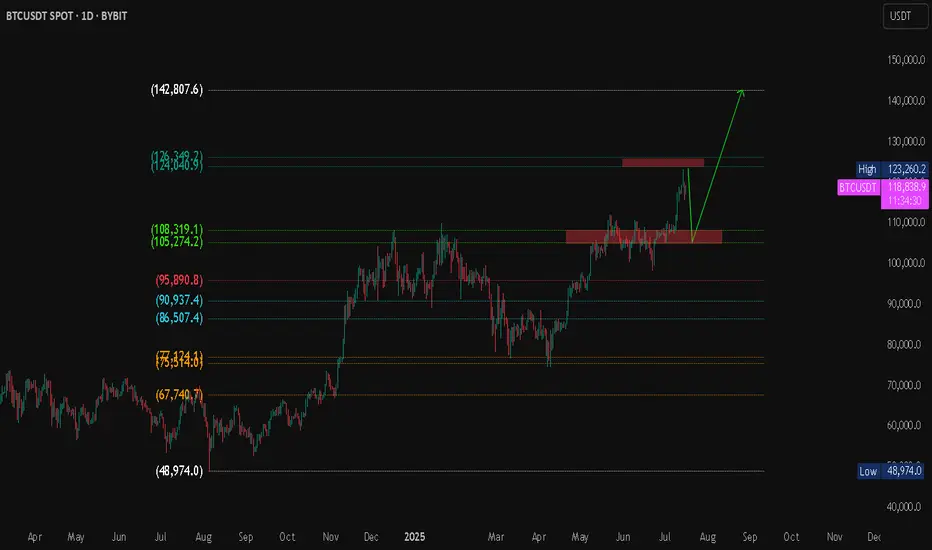
BTC/USDT Technical Analysis Market Overview
Bitcoin is currently trading at $118,788, with an intraday high of $119,311. The market has recently tested a major resistance zone and is showing signs of a potential pullback toward a key demand zone before a possible continuation to higher levels.
Projected Scenario (Bullish Bias)
Expected pullback to the support zone around $105K – $108K.
If price holds and shows a bullish reversal, a breakout above $124K is expected.
Primary upside target: $142,807 (Fibonacci projection / potential new high).
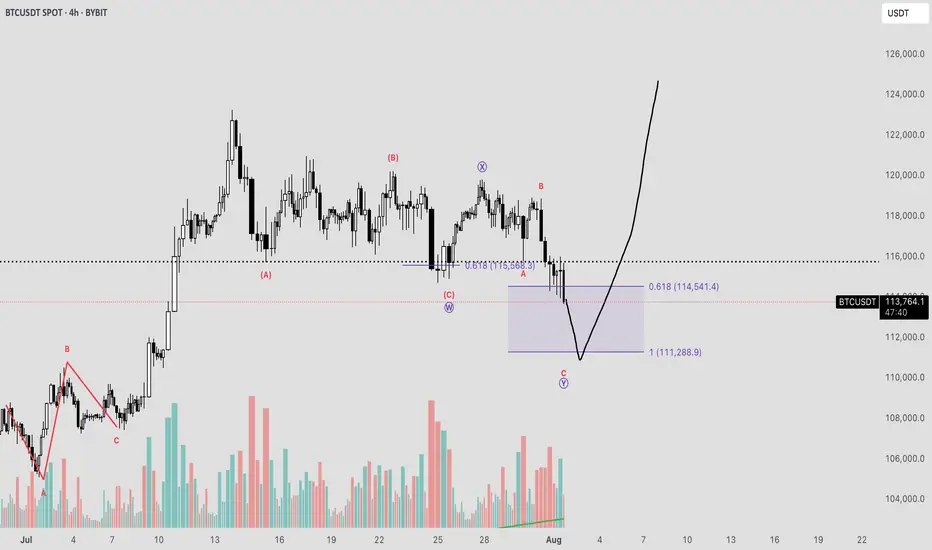
BTC Double Combo CorrectionFollowing a failure to maintain support at several critical technical levels, Bitcoin now appears vulnerable to a potential decline toward the ~$111,000 region. This projection is derived from an Elliott Wave corrective structure identified as a WXY Double Combination. The initial leg of the pattern features an ABC correction terminating near the 0.618 Fibonacci extension, thereby establishing the W pivot. This is succeeded by the X pivot, followed by a sharp, impulsive decline forming the Y wave.
By applying a trend-based Fibonacci extension across the W, X, and Y pivots, we can estimate the probable termination point of the corrective sequence—typically extending into the 1.0 to 1.1 Fibonacci range.
This move is anticipated to unfold over the weekend, potentially presenting a strategic buying opportunity, contingent on a favorable reaction at the projected low. Sunday evening may offer optimal conditions for entry, as traditional market participants—limited to weekday trading—could miss the initial dip, subsequently being compelled to re-enter at elevated price levels.
#BTCUSDT: Minor Correction In Price Then $150,000?Hi everyone,
Hope you are doing great we are witnessing some minor bearish correction in the price and think this might be a sellers trap. We think $110,000 can be a good area to buy. Our target is at $150,000 area which look possible after looking at how price recently behaved.
BITCOIN PREDICTION: NOBODY IS WATCHING THIS PATTERN !!!(warning)Yello Paradisers, I'm updating you about the current Bitcoin situation, which is extremely dangerous for crypto noobs that will get rekt again very soon!
It's going to be a big move soon. I'm telling you on a high timeframe chart we are doing multi-time frame analysis and on a high timeframe chart I'm updating you about the RSI indicator, the bearish divergence, the moving average reclaim, and the channel reclaim that we are having right now.
We are observing a shooting star candlestick pattern, which is a reversal sign, and I'm telling you what confirmations I'm waiting for to make sure that I can say with the highest probability that we are going to the downside. On a medium timeframe, I'm showing you two patterns: one is a head and shoulders pattern, then a contracting triangle, and on a low time frame, I'm sharing with you the ending diagonal because on a high time frame chart, we are either creating ABC or impulse, and I'm telling you what the probabilities are for the zigzag, which is a corrective mode wave, or the impulse, which is a motive mode wave.
I'm sharing with you what's going to happen next with the highest probability. Please make sure that you are trading with a proper trading strategy and tactics, and that's the only way you can be long-term profitable.
Don't be a gambler. Don't try to get rich quick. Make sure that your trading is professionally based on proper strategies and trade tactics.

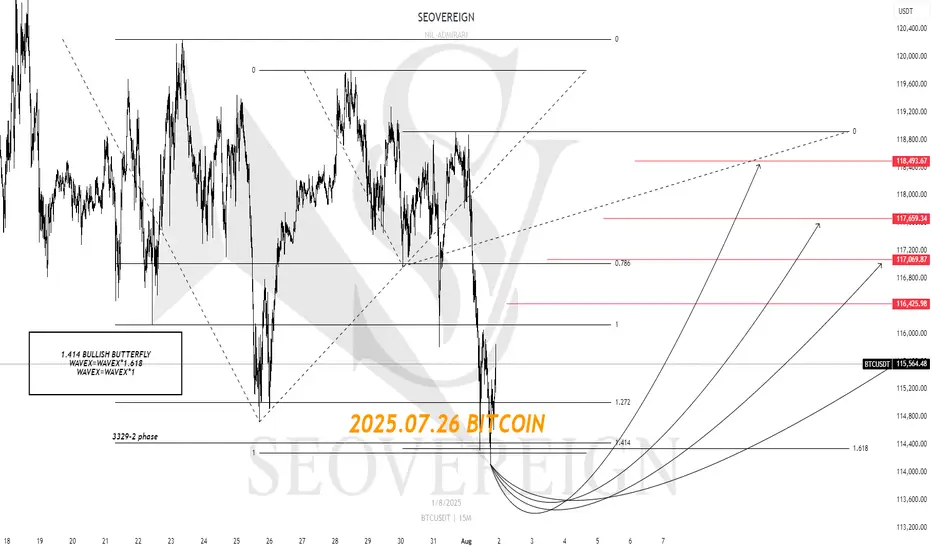
[SeoVereign] BITCOIN BULLISH Outlook – August 1, 2025We are the SeoVereign Trading Team.
With sharp insight and precise analysis, we regularly share trading ideas on Bitcoin and other major assets—always guided by structure, sentiment, and momentum.
🔔 Follow us to never miss a market update.
🚀 Boosts provide strong motivation and drive to the SeoVereign team.
--------------------------------------------------------------------------------------------------------
Hello.
This is SeoVereign.
My fundamental view on Bitcoin, as mentioned in the previous idea, is that I am anticipating an overall downward trend. In the mid- to long-term, I believe the downward pressure will gradually increase, and this is partially confirmed by various indicators and the overall market sentiment.
However, before we fully enter this downward phase, I have been judging that one more upward wave is likely to remain. I have focused my strategy on capturing this upward segment, and I have recently reached a point where I can specifically predict the development of that particular wave.
If this upward move unfolds successfully, I plan to set my take-profit range conservatively. The reason is simple: I still believe there is a high possibility that the market will shift back into a downtrend afterward. The core of this strategy is to minimize risk while realizing profits as efficiently as possible toward the tail end of the wave.
The relevant pattern and structure have been marked in detail on the chart, so please refer to it for a clearer understanding.
In summary, I view this rise as a limited rebound that could represent the last opportunity before a downturn, and I believe this idea marks the beginning of that move.
I will continue to monitor the movement and update this idea with additional evidence. Thank you.
What Nobody Taught You About Risk Management. Part 1
Numerous authors and communicators have addressed the importance of risk management, more or less comprehensively, but I have not come across any who present what I intend to share with you today. Once my presentation is complete, I will share some useful resources with which you can complement what you learn here, as I will only cover an important but small part of the topic: execution.
What is risk management?
Risk management is the planning an investor undertakes to protect capital and maximize profits. It encompasses factors surrounding the creation of a profitable system or method, the allocation of our capital, and the execution of our trades.
Some key concepts:
Risk-Reward Ratio
The risk-reward ratio is a metric used in trading and investing to assess the relationship between the risk taken in a trade and the expected potential profit. It is expressed as a ratio, for example, 1:1, 1:2, 2:1, etc.
Stop Loss (SL)
The SL, or stop-loss, is an automatic order placed in a trading operation to close your position at a specific price, with the aim of limiting losses if the market moves against you.
Take Profit (TP)
The TP, or take-profit, is an automatic order placed in a trading operation to close your position at a specific price to secure profits when the market reaches a favorable level. It is the point where you decide to "take" your profits and exit the trade.
Margin
In trading, margin is the amount of money a trader must deposit or maintain in their account to open and sustain a position.
Volatility
Volatility, in the context of trading and financial markets, measures the magnitude and frequency of changes in an asset's price.
Leverage
Leverage in trading is a tool that allows investors to control a larger market position using only a fraction of their own capital. It acts as a "loan" provided by the trading platform, amplifying both potential profits and potential losses.
Risk Management and Trade Execution:
The most common problem among other investors, beyond psychological factors or lack of experience, is the absence of total control over their trades. They use random leverage, take entries with risk-reward ratios below 1:1, and some don’t even know what percentage of profits or losses they will have at the end of the trade.
For an investor to execute a successful trade, they must meet the following criteria:
1. Ensure minimum risk-reward ratios of 1:1.
2. Properly allocate their investment capital, adhering to strict rules to avoid undermining their statistical performance.
3. Adapt to volatility and know how to adjust their leverage accordingly.
4. Set a fixed stop-loss (SL) price and determine what percentage of losses they are willing to accept per trade.
5. Set a fixed price for taking profits from the trade and know what percentage of profits they will achieve.
Failing to meet these parameters will not only destroy traders’ profitability but also make it impossible for them to develop reliable investment systems and methods.
Incorrect Execution:
For example, if I see an entry opportunity in BTC/USDT, it would be a mistake to choose random leverage and plan to manually close when I think I’ve gained or lost enough. The volatility of the price chart itself may or may not require leverage, and that leverage must be adjusted to our risk management strategy. Trading in the manner described above is a recipe for failure, which is why it’s a lucrative business to allow inexperienced investors to access markets through online platforms.
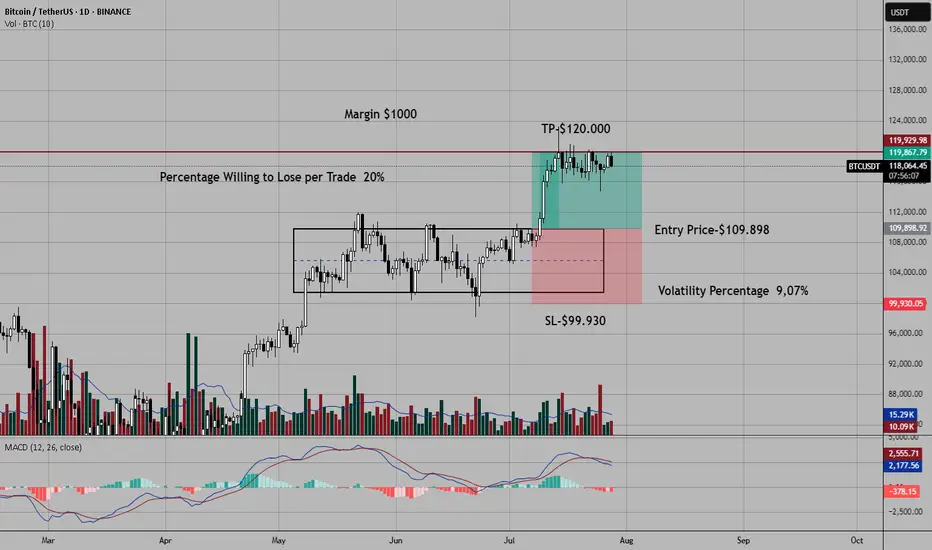
Correct Execution:
Before explaining a practical case, let’s assume I use a $1,000 amount per trade and am willing to risk a 20% stop-loss (SL). These parameters are non-negotiable to avoid undermining my statistical performance.
A few days ago, I took the trade shown in the chart. To enter this long position in BTC/USDT, the first thing I did was identify the entry point and the exit points for my trade (SL and TP). The trade met a minimum risk-reward ratio of 1:1, so I considered whether leverage was necessary. A volatility of 9.07% from the entry point to my SL price offered low profit expectations relative to what I was willing to risk from my margin per trade (20% of $1,000). I needed leverage.
In the toolbar on the left, once you have a price chart open in TradingView, you can use the ruler to easily measure the percentage of volatility.
How can I ensure that 20% of the margin I’m investing is triggered when the price reaches my SL zone using leverage?
To calculate the exact leverage, we divide the SL percentage we’re willing to risk (20%) by the volatility percentage from the entry point to the SL price (9.07%).
For example, my entry point in BTC was $109,898, and the exit point or SL was $99,930. I measured the volatility between the entry price ($109,898) and the exit price ($99,930), resulting in 9.07%. Since the volatility was somewhat low and I wanted to risk 20% of my margin per trade when the price hit my SL, I calculated the required leverage. To do this, I divided 20% (the percentage I was willing to lose per SL) by 9.07% (the volatility percentage from the entry price to the SL price). The result was approximately 2x leverage when rounded.
In summary: At 2x leverage, we would lose approximately 20% of our capital if the price reached $99,930. Since I had a 1:1 risk-reward ratio before entering the trade, I assumed I would gain approximately 20% of the invested margin when the price reached $120,000.
The trade was a winner, reaching the TP price without issues and generating a 20% profit on the margin I invested ($1,000).
Use investment platforms that allow you to manually adjust leverage, such as 1x, 2x, 3x, 4x… 38x, 39x, 40x, and avoid platforms where leverage is set to default values like 1x, 5x, 10x, 20x, 50x… This seemingly minor detail for most small investors allows platforms to pocket large fortunes from failed trades.
Conclusions and Recommendations:
Risk management is the backbone of investors, and knowing how to execute entries with precision is rare among retail traders. Even so, I’ve only covered a small part of this topic. To complement this knowledge, I recommend searching on YouTube for the video by investor and educator Yuri Rabassa titled “The Secrets of Good Money Management.” This video will help you develop basic statistical skills that are vital for creating a trading system. Additionally, in the book *Forex Price Action Scalping* by renowned author Bob Volman, you’ll find a very insightful chapter titled “The Principle of Probability.”
Final Note:
If you’d like to take a look at my analysis log, you can find my profile in Spanish, where I transparently share well-defined market entries. Send your good vibes if you enjoyed this article, and may God bless you all.
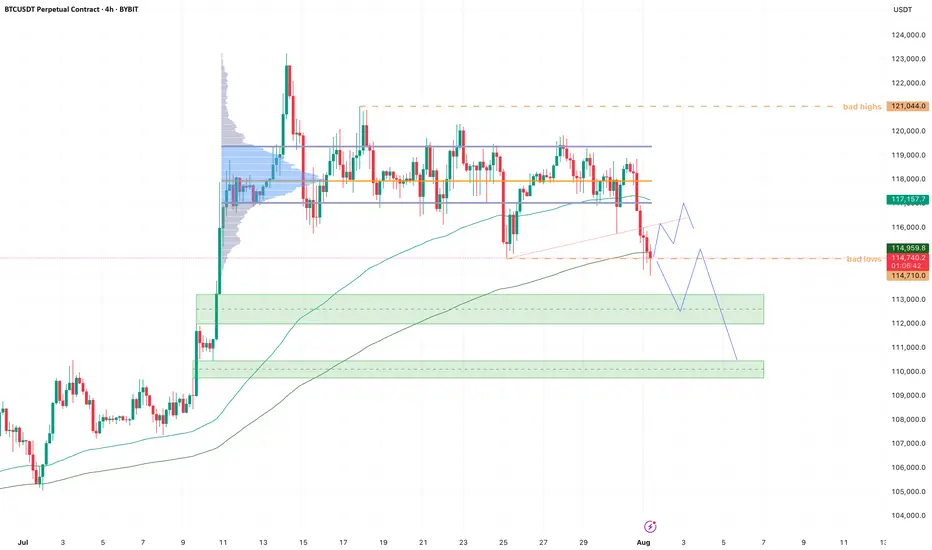
BTC - Cleaned up the lows!Bearish momentum is starting to stall here at the lows.
New month, and we started it by cleaning up the previous month's bad lows.
If we can hold here I'm looking for a trendline retest and VAL retest soon. Maybe we get one more sweep of the low, giving us a three drive pattern.
Reclaim VAL then it's back to VAH, maybe take out all the bad highs.
If we start bleeding into the lower demand zone (green box), I will start paying attention for a potential bearish retest into 110k, which we be our last area of imbalance to fill.
From Euphoria to Exhaustion – BTC's Next Move?BTC Idea – Bearish Divergence + Key Level Watch ⚠️
Summary / Bias:
BTC has tapped 120K and is now showing early signs of weakness. A bearish divergence on the MACD Histogram (weekly) is flashing caution, while price has retraced back to the critical 112K zone. I'm leaning bearish short-term, expecting a move towards 100K, and possibly as low as 93K, if key confirmations unfold.
Technical Context:
Weekly MACD Histogram shows a clear bearish divergence, signaling potential exhaustion.
BTC rejected from 120K and has pulled back to 112K.
Price crossed below the Yearly Camarilla L#, but we need a weekly close below to confirm further downside.
112K remains the key pivot – failure to bounce strongly here could open the door for deeper retracement.
Scenarios to Watch:
🟥 Bearish Continuation (Primary Bias)
Breakdown and close below 112K
Downside targets:
TP1: 100K
TP2: 93K
🟨 Neutralizing Risk
Hold above 112K with strong bounce = neutral bias, reassess
Close back above 115K+ with strength = invalidate bearish lean
Caution & Patience:
Now is not the time for aggressive longs. Signs of exhaustion + major level retest call for defensive positioning and high-quality setups only. Let confirmation guide entries.
NFA. Risk management always.
Will update if structure shifts.

Bitcoin Next Leg Incoming? Targets $134K from Bullish WedgeBTCUSDT is consolidating within a descending wedge right above a critical demand zone, following a impulsive breakout from its prior range structure. This current setup suggests another potential bullish continuation, especially as price continues to respect both the wedge support and internal demand.
With the higher timeframe structure favoring bulls and previous demand zones holding firm, the projected breakout targets align with $123,218 and $134,446 respectively.
A clean invalidation would only be confirmed on a sustained break below the wedge and loss of the strong support area near $110K.
All eyes on the wedge apex as BTC prepares for its next major leg.

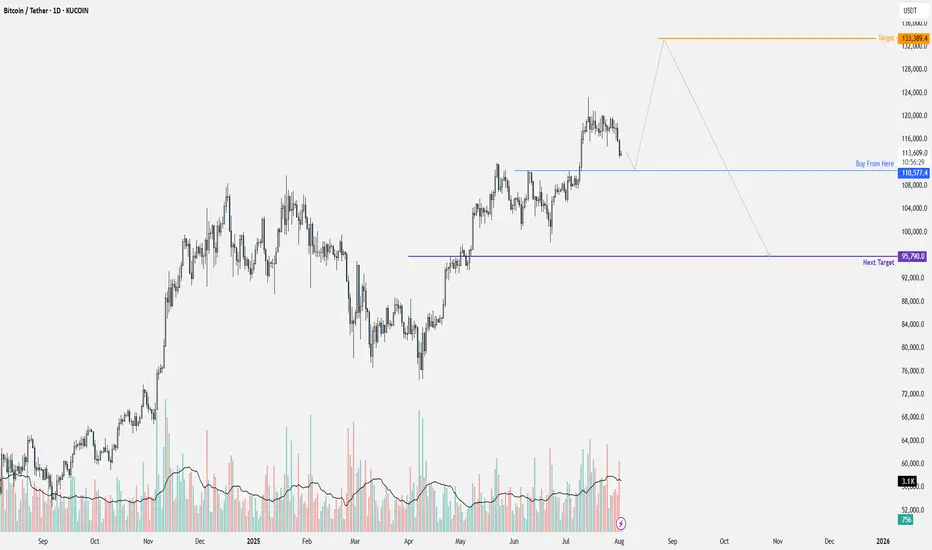
BTC ProgramBTC will correct itself at a low of approximately $110K, and then will make an ATH of $133k.
After this ATH, you will witness a sharp drop up to $95.5k.
BTC | Swing Plan UpdatePrice failed to break out above 1D supply and sharply rejected, losing key 4H demand at $117,300.
HTF demand at $109,000 (1D FVG + BOS + S/R) is the next major area of interest—this is where I’ll look for fresh swing setups if the market flushes further.
No need to rush new positions until a clean setup prints or levels are reclaimed.
Plan:
Wait for price to test $109,000 zone before considering a swing long.
Only consider LTF scalp longs if we reclaim the 4H BOS at $118,300.
Stay flat until high-probability entry, let the market show its hand.

BTCUSD : Key levelsHere is a list of key levels on BTCUSD. All of them will be interesting to the market, but when exactly from them will be a bounce I will inform in the next posts. It is foolish to just wait for a bounce from them. Stay tuned for the next posts.