BITCOIN: THE PERFECT STORM - MULTIPLE BREAKOUT PATTERNS ALIGNED⚠️ CRITICAL SUPPORT LEVELS
🛡️ Support 1: $115,000 (-3%) - Triangle support
🛡️ Support 2: $110,000 (-7%) - Channel support
🔴 DANGER ZONE: $105,000 (-11%) - Multiple pattern failure
So...
Strategy: Quick profits on pattern completion 🎨
Entry: $115k (Triangle breakout confirmation) 📊
Stop Loss: $114k below (Tight risk management) ❌
Target: $125k (+10%) ✅
Time Horizon: 2-3 weeks 📅
Risk/Reward: 1:6 🎯
________________ NOTE _____________
⚠️ This is not financial advice. Bitcoin is highly volatile and risky. Only invest what you can afford to lose completely. Always do your own research and manage risk appropriately 🚨
BTCUSDT.5S trade ideas
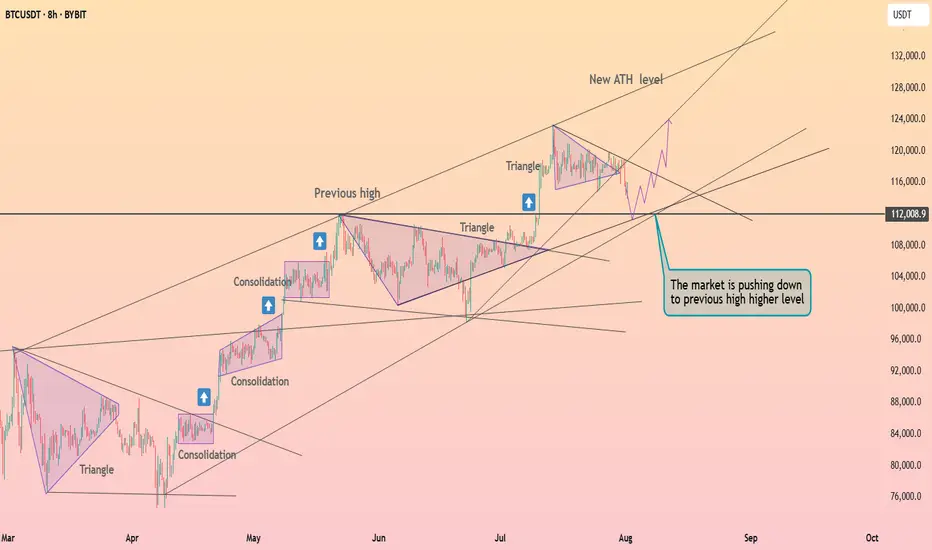
Targets and their point in timewe use the threshold breaks to determine targets AKA areas of liquidity. we also utilize pattern detection paired with the threshold breaks to validate cycles and where we are in said cycle.

The trend is your friend...BTC is moving within a clear range on the daily timeframe. Since we are in an underlying uptrend, the current range is bullish. A downside fakeout would be typical and could potentially fill the CME gap, but we would remain bullish.
BTC Moon Phase, Dominance % and BBWP resolutionBTC, D. Moon Phase. I see bearish scenario for the next days, until 4-5th of August. After reviewing Moon Phase chart for last year+, I see same scenario is happening most of the times. During the First Quarter ( Aug. 1) of the phase, price is dropping and start to recover about 4-5 days prior Full Moon. This is exactly when energy of the Full Moon starting to amplify. Current BBWP is contracted for 8 days, making the next move very rapid, I would not set any long/short trades, untill the volume start to expand. Its the mid summer - always slow and August is the month it start to accelerate towards the Fall, with all financial/political tricks happening in September and later in Q4. We already had one bear trap fakeout, but price didnt anticipate to go higher and got rejected by falling wedge upper like ( or bull flag, in this case).I would expect that high volume green candle will be either fully recovered to $110-111K , or 75% recovery, where the CME gap is $113500 - 1-2% lower, making it $113,000. The cascade liquidation will happen very fast, I expect the whole move down and up will take around 24 hours, with the bottom time 5-15 minutes. Need to be ready, that all alts will crash as well, Im expecting BTC %dominance to bounce here , after 8.4% drop to weekly 50EMA. I would like to see BTC, D% at 70% by Christmas and new ATH, what ever it is 160K or 200K what ever it is, for bitcoin to make ATH, it must grab dominance.

Bitcoin exited from the triangle ┆ HolderStatBINANCE:BTCUSDT is dipping to retest $112,000, the last breakout level. The price remains inside a large ascending triangle and may soon resume its uptrend. If this support holds, targets above $125,000 come back into play.
BTCUSDT – Key Support Holding! Next Targets if 115,827 BreaksBitcoin is currently holding above a crucial support zone around 115,220. After a recent drop to the 114,979 area, buyers stepped in strongly, preventing further downside.
📊 If price stabilizes above 115,220 and successfully breaks through the resistance at 115,827, I expect bullish continuation towards the following targets:
🎯 Target 1: 117,900
🎯 Target 2: 119,076
These zones acted as strong resistances previously, and breaking through them could open the path to further upside.
⚠️ However, if BTC closes below 114,500, we may see a bearish breakdown with potential downside towards 108,000 – 106,000 range.
📌 Personally, I hope Bitcoin holds this support as it’s a key level to maintain bullish momentum.
Let’s see how the market reacts in the next few candles! BINANCE:BTCUSDT

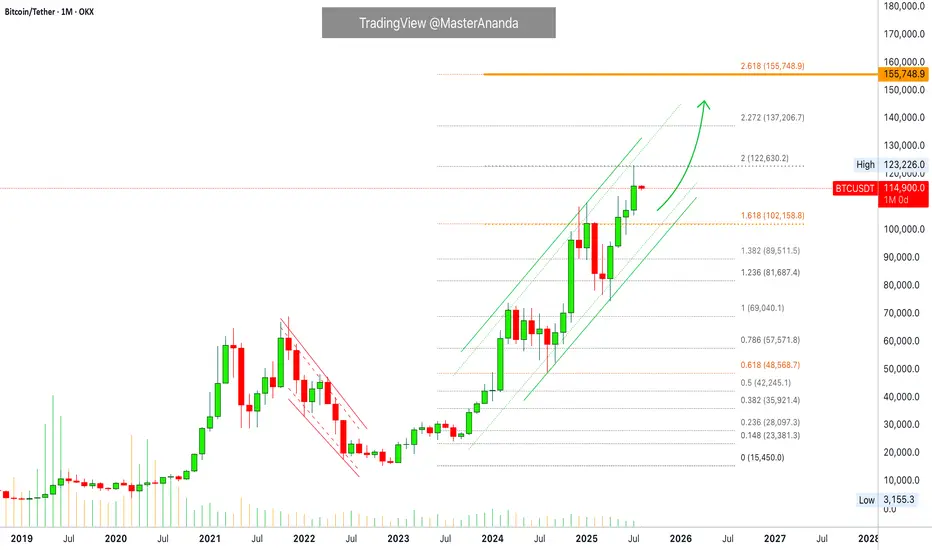
Bitcoin Monthly · Parabolic Rise ContinuesLast month Bitcoin produced its best numbers ever. The highest wick and close, a new all-time high at $123,226.
Bitcoin is not exhausted on the monthly timeframe but there is room for a retrace before the month ends. Think of the first part of the month being mixed, neutral or even bearish while the second half becomes full time bullish.
The levels that are relevant are $122,000 on the bullish side and $102,000 on the low. Right now the action is happening close to the middle so anything goes.
In 2020 Bitcoin produced 7 monthly candles growing and this was repeated again in 2023. In 2025 we have so far four green candles which means that Bitcoin can easily continue to grow. It has been known to produce more than four months green many times but there can be exhaustion at some point.
Bitcoin has been moving within a strong uptrend and is likely to continue rising. Bullish until the chart says otherwise. We are going up. Short-, mid- and long-term.
As Bitcoin consolidates near resistance, the altcoins will continue to build strength in order to grow. Remember, we are still looking at bottom prices across thousands of altcoins. Only a few moved ahead and are trading at all-time highs, the rest will catch up. The time is now, late 2025. The best is yet to come.
Namaste.
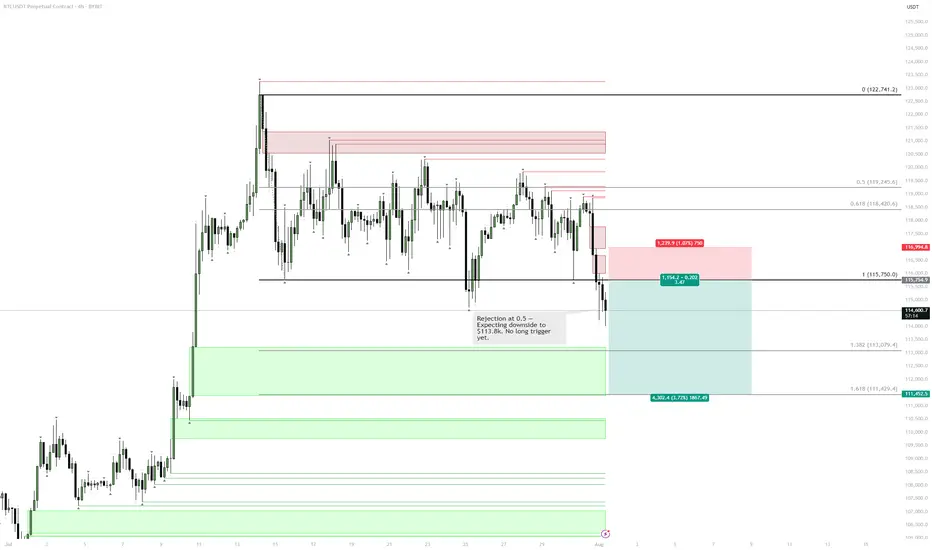
BTC | Short Bias — Targeting $113kPrice rejected perfectly off the 0.5 retracement and is now filling the previous imbalance.
Yesterday's daily close was decisively bearish, confirming downside momentum.
There’s a lack of convincing reversal signals at current levels.
Plan:
Main expectation is continued downside toward the $113k support.
Not interested in longs until price stabilizes at or below that level.
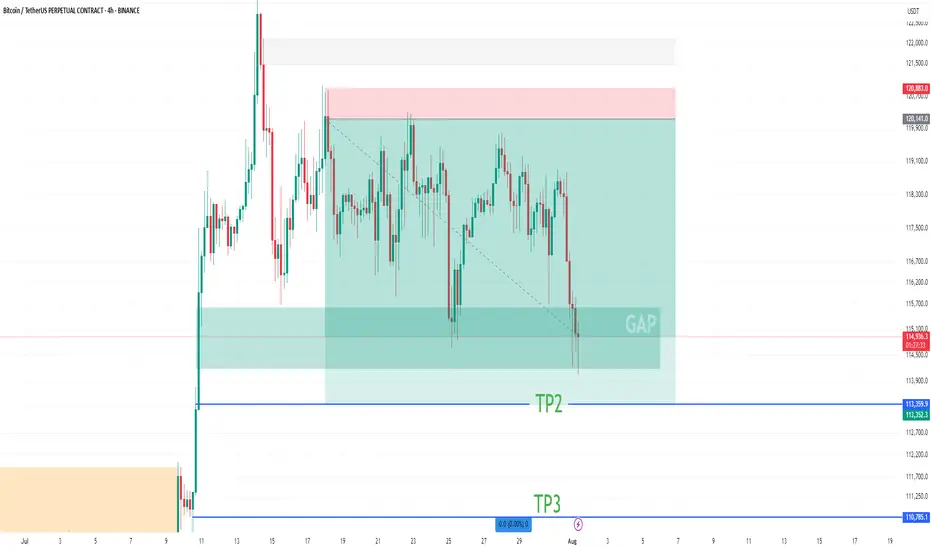
BTC Short Update Hello ❤️
Bitcoin
Let's have an update on Bitcoin analysis
💁♂️ First Target 🔥
Near Second Target
According to the analysis I posted on the page, Bitcoin touched the first target and is now near the second target
It is a good place to save profits. The price gap is filled
Please don't forget to like, share, and boost so that I can analyze it for you with more enthusiasm. Thank you. 💖😍
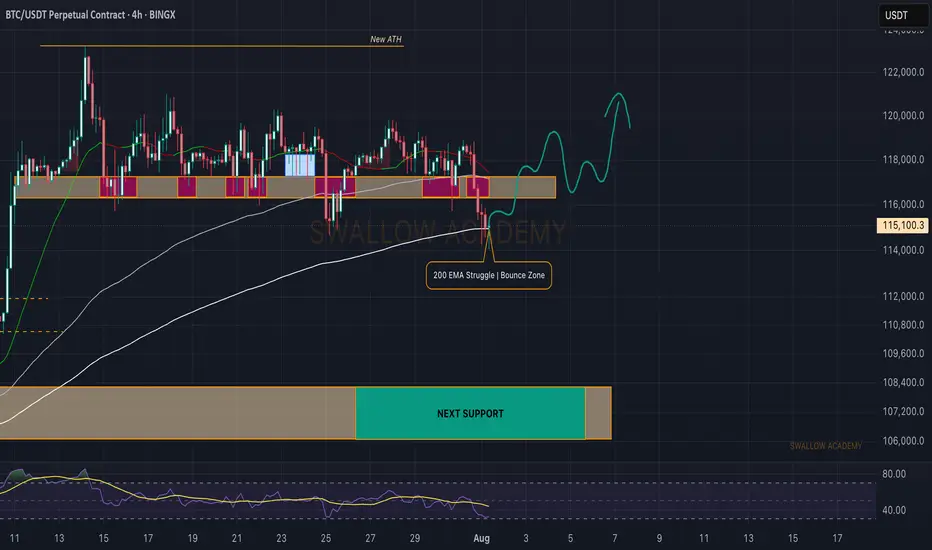
Bitcoin (BTC): 200EMA is Key Are Currently | Red Monthly OpeningBTC had a really sharp start to the month, and we are back near $115K, which was a key zone for us last time (due to huge orders sitting there).
Now, we see a similar struggle like last time but not quite the same, as the 200EMA has aligned with the $115K area. We are now looking for any signs of MSB, as we think we might get a recovery from here.
Now if we do not recover right now (by the end of today), we are going to see a really deep downside movement during the weekend most likely!
Swallow Academy
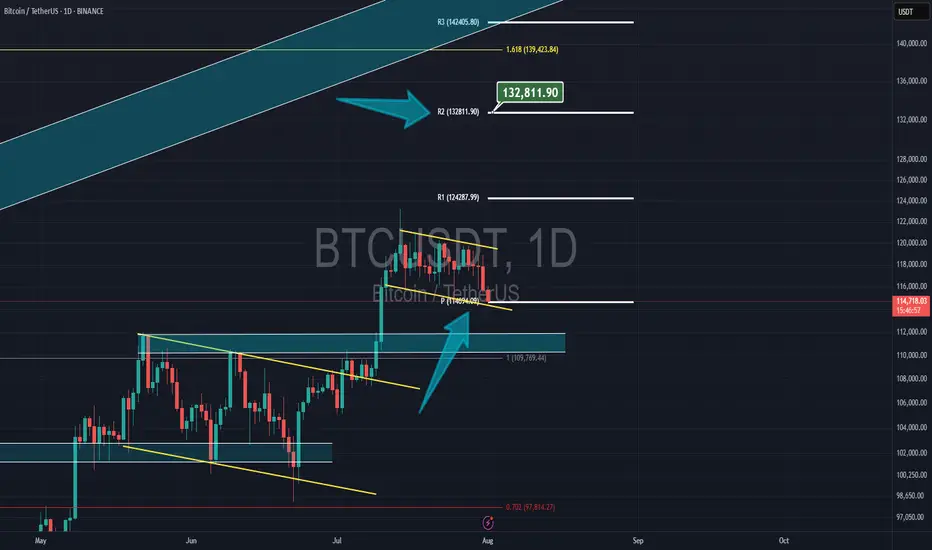
Bitcoin & NEW monthly PivotBitcoin had a correction yesterday but now its still above the new monthly pivot at $14,700 and my target is the 2nd resistance of the pivot at $132,800
BTC Trade Plan: Watching for Break and Retest Above Daily Range🟠 Bitcoin (BTC) is currently trading range-bound on the daily timeframe ⏳📉📈. I’m monitoring price action for a bullish break and retest 🔓🔁 of the current range to confirm a potential long entry 🎯.
📍 Key levels are already marked on the chart 🗺️—
🛑 Stop-loss would sit just below the previous swing low,
🎯 Target aligns with the higher price zone marked out to the left of the chart 🔼👈.
This is a classic range breakout setup—patience and precision are key.
🧠 As always, this is not financial advice.

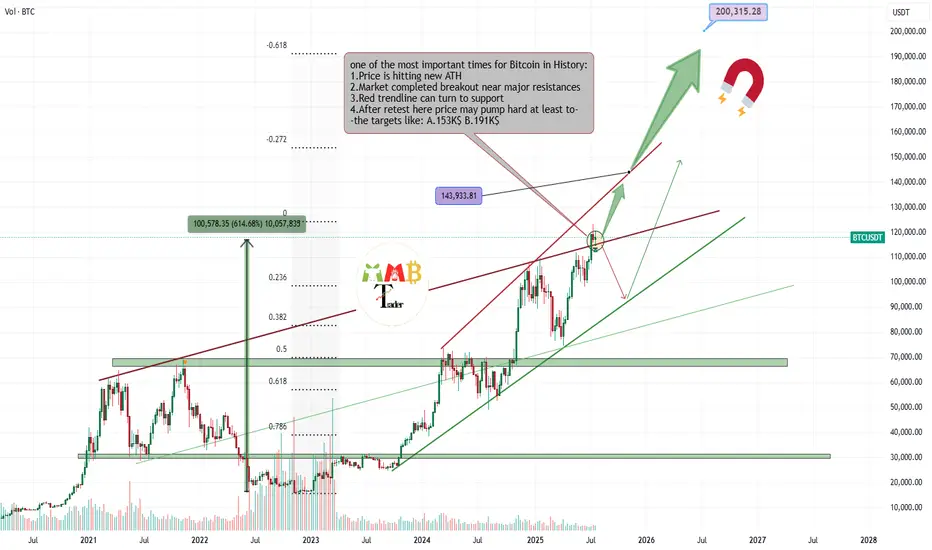
Bitcoin is getting Ready for 143K$ nowMajor red resistance trendline is now broken also last week the retest is completed now price is range for a while for new week to start and fresh volume and buys that make path easier to reach above 140K$.
Get ready and take a look at important zones at chart and possible scenarios which are all mentioned.
DISCLAIMER: ((trade based on your own decision))
<<press like👍 if you enjoy💚
Accroding to VSFA+ long turm BTC Asalam-o-Alikum All,
Accroding to VSFA+ Strategy BTC very soon big drop coming, BTC testing 90k to 95k price velue, Total market cap crashing so overall crypto coin's crashing toO so becareful...

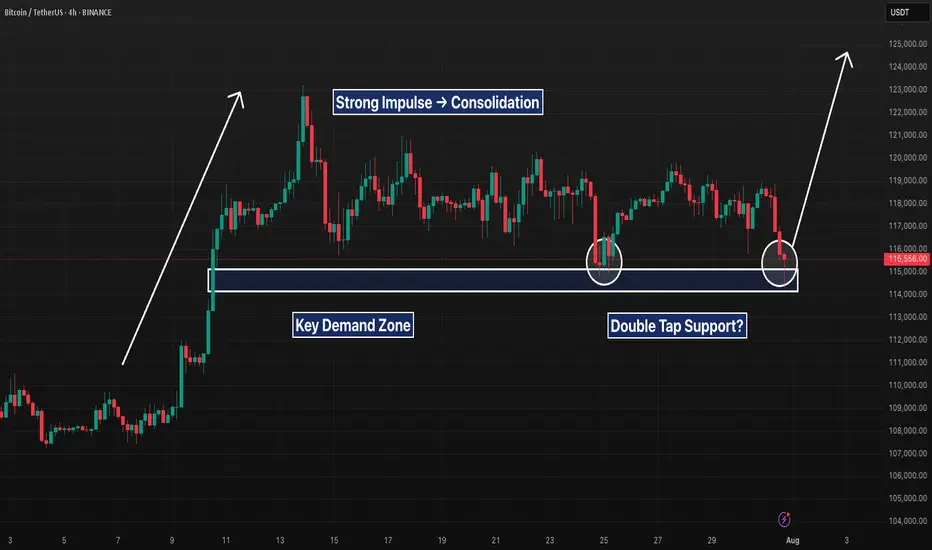
BTC 4H – Support Tapped 2x After Breakout, Will Bulls Step In?Bitcoin is retesting a major demand zone that launched the last breakout. After a sharp impulse move, price has ranged tightly and just tapped this support area for the second time.
A clear double bottom attempt is forming, but failure to hold $115K could open the door to deeper downside. Bulls want to see a quick reclaim of $117K to confirm structure still holds.
Clean levels. Clear reaction zones. Let’s see who takes control.
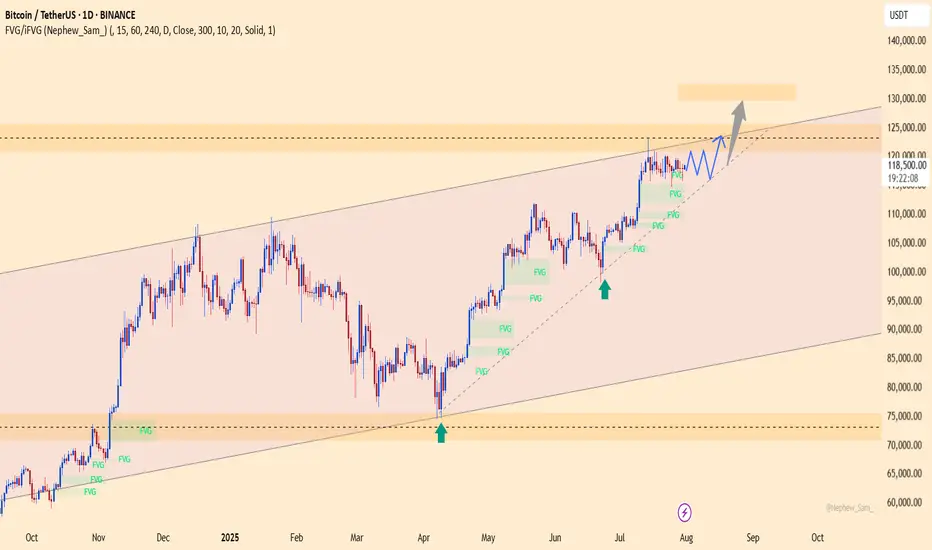
BTC defies expectations –Absorbs 9 billion USD, aiming for 130K?BTCUSDT maintains its bullish momentum despite Galaxy Digital offloading 80,000 BTC (worth ~9 billion USD). Price only saw a slight dip before bouncing back quickly, signaling strong demand and a more mature market sentiment.
Citi analysts point to ETF inflows and retail participation as the primary drivers of BTC’s rally, even as investors remain cautious ahead of the Fed’s rate decision.
On the daily chart, BTC continues to trade within an ascending channel, with the 116,200 zone acting as a potential buy area on any pullback. The next target is set at 129,500 USDT, aligning with the channel’s upper boundary and technical resistance.
Suggested strategy: Look to buy near 116,200–117,000. Target 129,500. Stop-loss below 115,000.
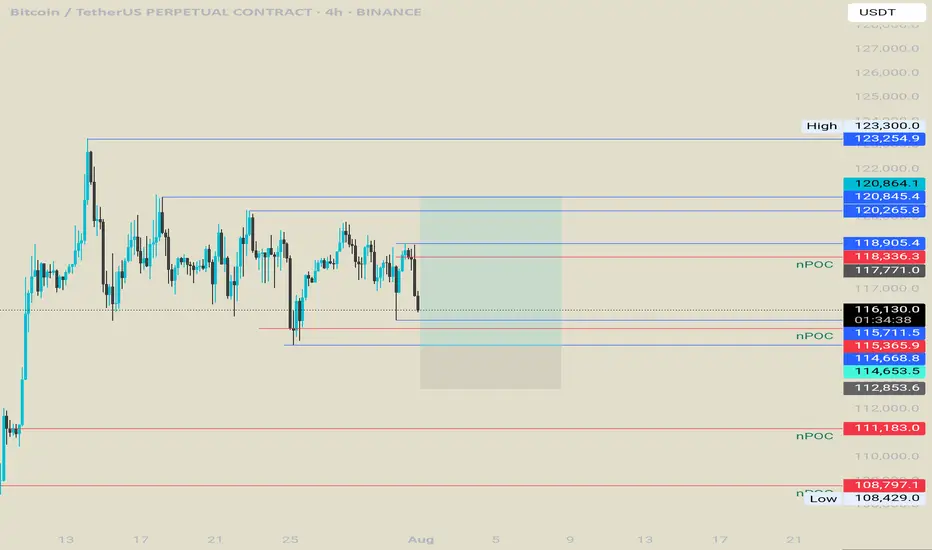
Bitcoin long from 114kWaiting for that npoc level to hit.
After that there is a 4h low , manipulate it , and we will try to catch a reversal.
BTC:LIVE TRADEHello friends🙌
📉Given the decline we had, we now had a good price rebound in the specified support area, which shows the power of buyers. Now, with capital and risk management, we can buy at the specified points in a stepwise manner and move to the specified targets.
🔥Follow us for more signals🔥
*Trade safely with us*

BTC AI Prediction Dashboard - 6h Price Path (31.07.25)
Prediction made using Crypticorn AI Prediction Dashboard
Link in bio
BTCUSDT Forecast:
Crypticorn AI Prediction Dashboard Projects 6h Price Path (Forward-Only)
Forecast timestamp: ~14:00 UTC
Timeframe: 15m
Prediction horizon: 6 hours
Model output:
Central estimate (blue line): -118,124
Represents the AI’s best estimate of BTC’s near-term price direction.
80% confidence band (light blue): 117,836 – 118,977
The light blue zone marks the 80% confidence range — the most likely area for price to close
40% confidence band (dark blue): 117,650 – 119,908
The dark blue zone shows the narrower 40% confidence range, where price is expected to stay with higher concentration
Volume on signal bar: 177.26
This chart shows a short-term Bitcoin price forecast using AI-generated confidence zones.
Candlesticks reflect actual BTC/USDT price action in 15-minute intervals.
This helps visualize expected volatility and potential price zones in the short term.

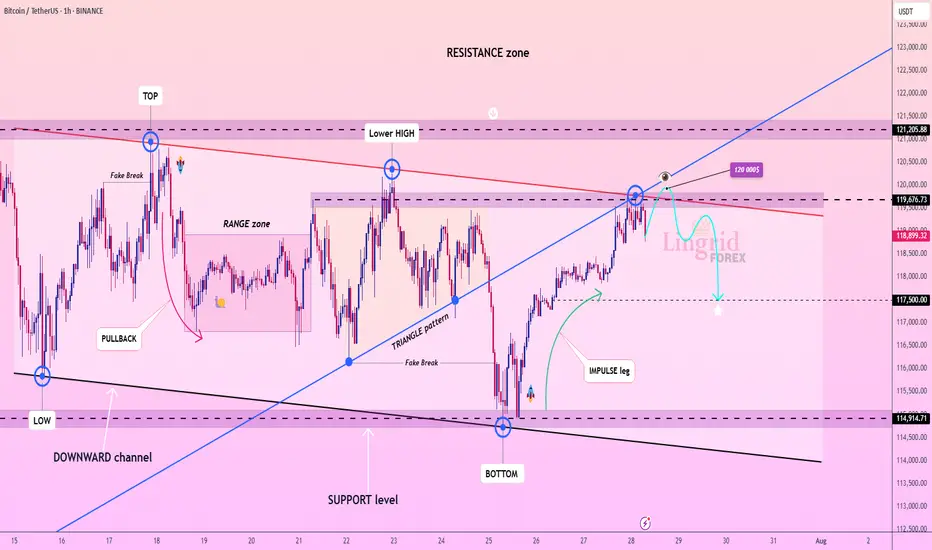
Lingrid | BTCUSDT Range-Bound Market: Short-Term Bearish MoveBINANCE:BTCUSDT has failed to break through the descending resistance near 120,000 and is now forming a lower high within the broader resistance zone. The price action follows an impulsive leg up and is currently tracing a potential reversal pattern under key structural resistance. As long as the market remains capped below 120,000, continuation toward 117,500 is likely. The downward bias is supported by weakening momentum after the bull trap and resistance rejection.
📉 Key Levels
Sell trigger: Breakdown below 119,000
Sell zone: 119,400 – 120,000
Target: 117,500
Invalidation: Break and close above 120,500
💡 Risks
Sudden bounce from the 119,000 handle could trap late sellers
Breakout above 120,000 would shift structure to bullish
Support near 117,500 may slow or reverse bearish pressure
If this idea resonates with you or you have your own opinion, traders, hit the comments. I’m excited to read your thoughts!
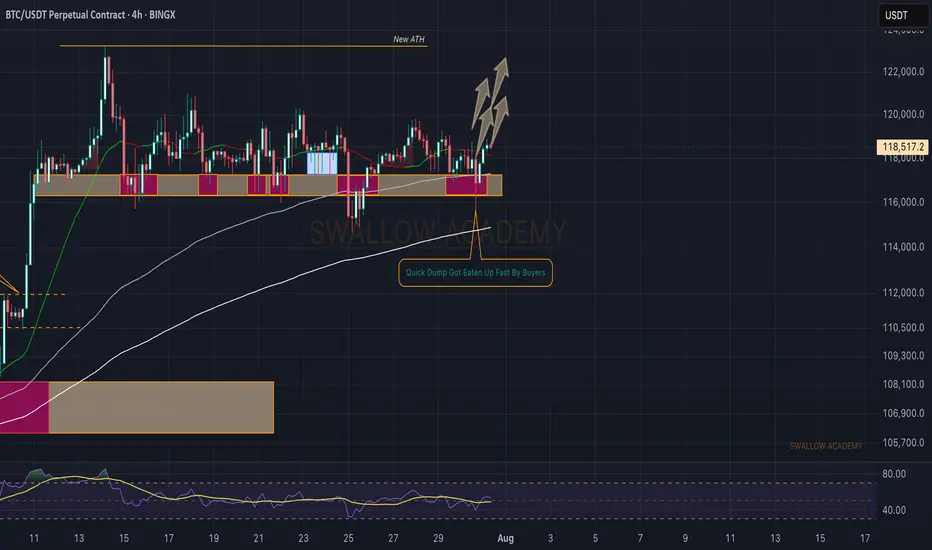
Bitcoin (BTC): Failed Dump | Buyers Still in Control Bitcoin recently had another wave of selling, where buyers once again showed their dominance near the local $116K zone and pushed the price of BTC back up.
We remain bullish, as we see the buyside dominance above the 116K area, so our target is still the current ATH; let's see.
Swallow Academy
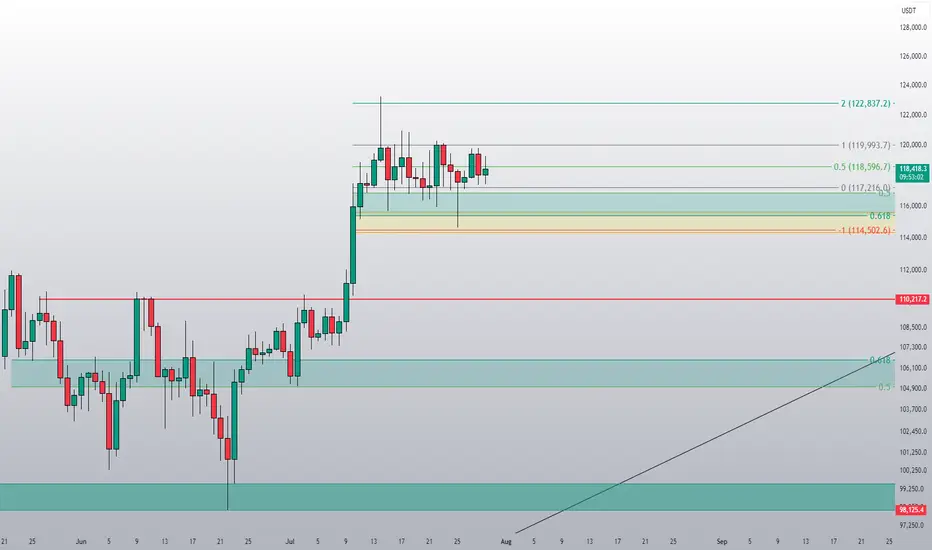
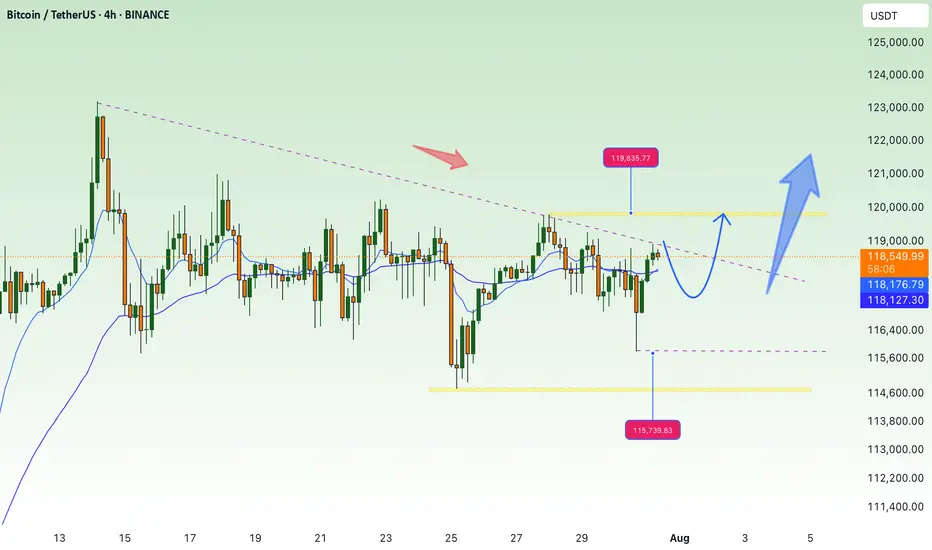
Accumulate waiting for btc price increase💎 BTC PLAN UPDATE – End of July (31/07)
📊 BTC Technical Analysis (4H Timeframe – End of July)
✅ Positive Signals:
• BTC has broken out of the consolidation triangle pattern (blue diagonal line), indicating a potential strong uptrend.
• The current price is retesting the breakout support zone around 117,800–118,000 → showing a good reaction and creating upward momentum.
• MA50 and MA200 are starting to slope upwards → confirming increasing buying strength.
📈 Bullish Scenario:
• If BTC holds above 118,000, it is likely to move toward the nearest resistance zone at 119,900.
• After breaking 119,900, the next targets are:
→ 122,792 (Fibonacci 1.618)
→ Further target: 127,900 (Fibonacci 2.618)
🛑 Risk Note:
• If the price drops below 117,000, it’s important to monitor again, as it may retest a deeper support zone around 114,500.
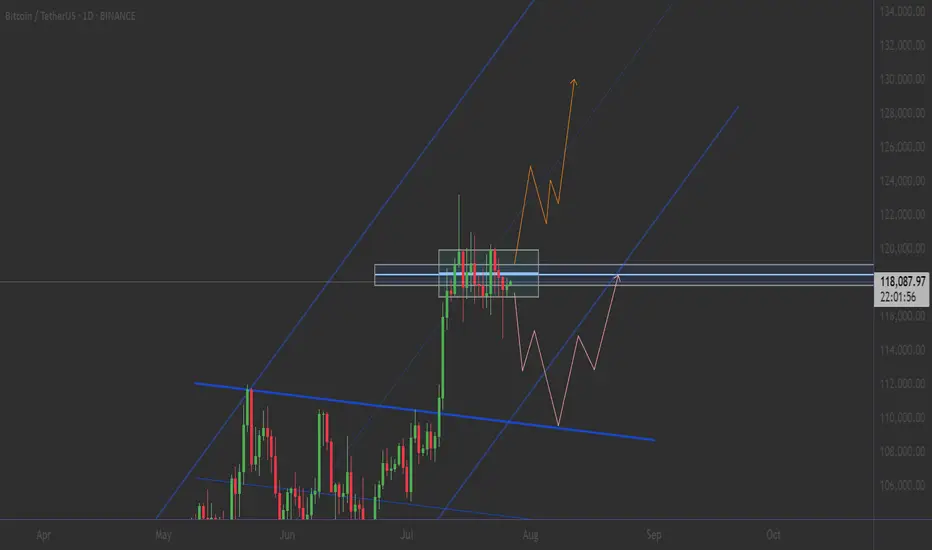
BITCOIN & 134KAfter Bitcoin rallied on July 8 and consolidated for two weeks, this bull flag remains valid, targeting $134,000.
