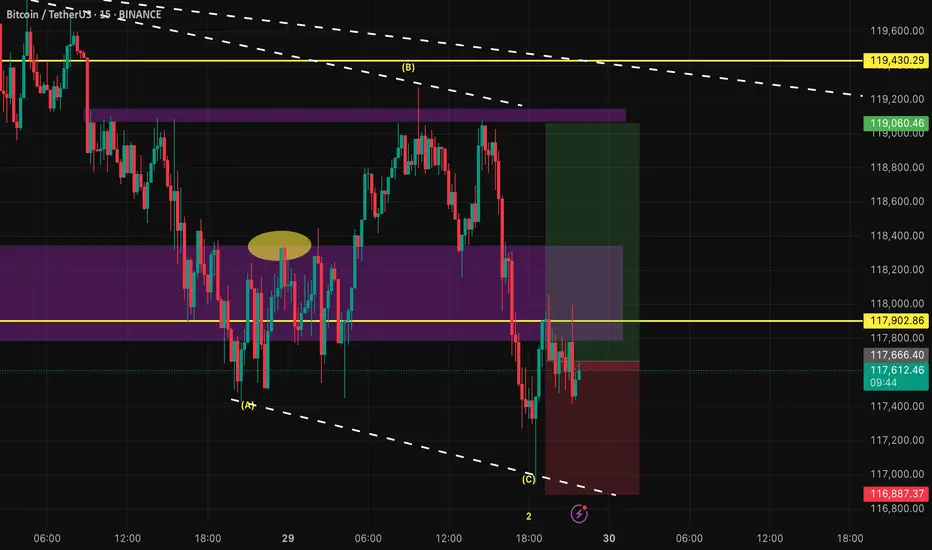
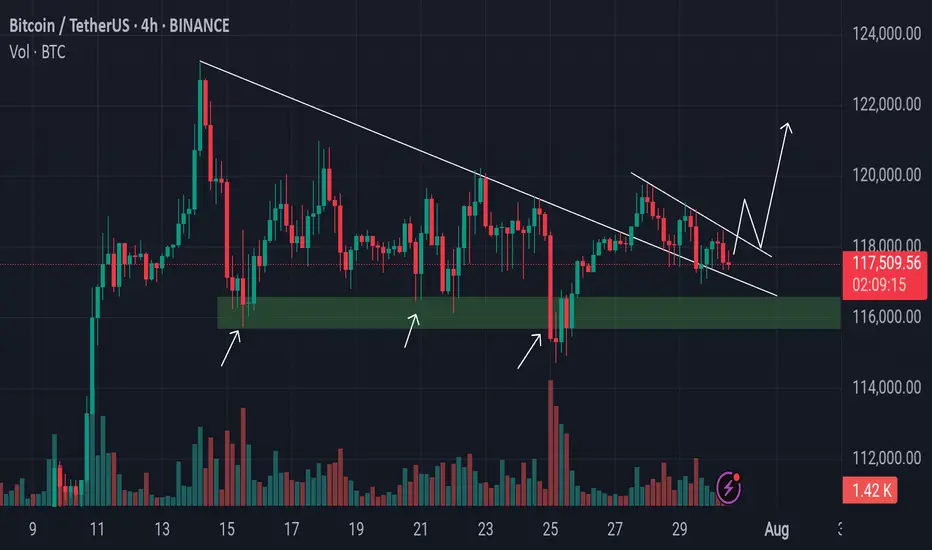
BTC/USDT Buy Setup – VSA & Demand Zone Reaction✅ Entry: Current price action near 117,297
🎯 Target: 119,078 (+1.22%)
🛑 Stop Loss (SL): 116,944 (below demand zone)
📊 Technical Insight (Volume Spread Analysis):
Stopping Volume at Lows:
The recent down move halted with a wide spread down-bar on high volume, followed by an immediate rejection. This indicates potential professional buying absorbing supply.
No Supply Confirmation:
After the stopping volume, several narrow spread candles on low volume formed, suggesting weak selling pressure and a lack of commitment from bears.
Bullish Reaction:
Price rebounded from the demand zone with increasing volume on up-bars, showing early signs of demand dominance.
The current consolidation just above the support is typical of absorption before a markup phase.
Risk-Reward Structure:
The setup offers a favorable 2.2:1 R:R ratio, with the stop placed just below the zone to avoid false breakouts while allowing the trade room to breathe.
📌 Trade Plan:
Bias remains bullish as long as price holds above 116,944.
A breakout above the minor resistance (117,828) with volume expansion would confirm the next leg up toward the 119,078 target.
If volume fails to support the move, reassess before committing additional capital.
BTCUSDT.5S trade ideas

BITCOIN PREDICTION: HUGE BREAKOUT SOON!! (watch this level) Yello Paradisers! I'm sharing with you multi-timeframe analysis on Bitcoin, levels to watch out for, confirmations we are waiting for, and everything needed for successful professional trading that is being profitable in the long run.
I'm sharing with you zig-zag from the Elliot Wave pattern formation. I'm also sharing a possible impulse we are going through, a head and shoulders pattern and its target, and the next major resistance and support levels.
I'm sharing with you a contracting triangle setup and how to trade it, along with an ending diagonal setup and how to trade it. Watch out for confirmations and how the price is developing based on what I have been talking about in this video, then trade it as a professional trader should.
Make sure that you have a great risk management, trading strategy, and tactic for entering the trades. I have explained some tactics that I'm watching for in this video, but make sure that all these tactics are well within your larger trading strategy and that you're approaching the market professionally. Don't try to get rich quick.
Make sure that you are focusing on long-term profitability and survival. This is the only way you can make it in crypto trading!

btc buy midterm"🌟 Welcome to Golden Candle! 🌟
We're a team of 📈 passionate traders 📉 who love sharing our 🔍 technical analysis insights 🔎 with the TradingView community. 🌎
Our goal is to provide 💡 valuable perspectives 💡 on market trends and patterns, but 🚫 please note that our analyses are not intended as buy or sell recommendations. 🚫
Instead, they reflect our own 💭 personal attitudes and thoughts. 💭
Follow along and 📚 learn 📚 from our analyses! 📊💡"
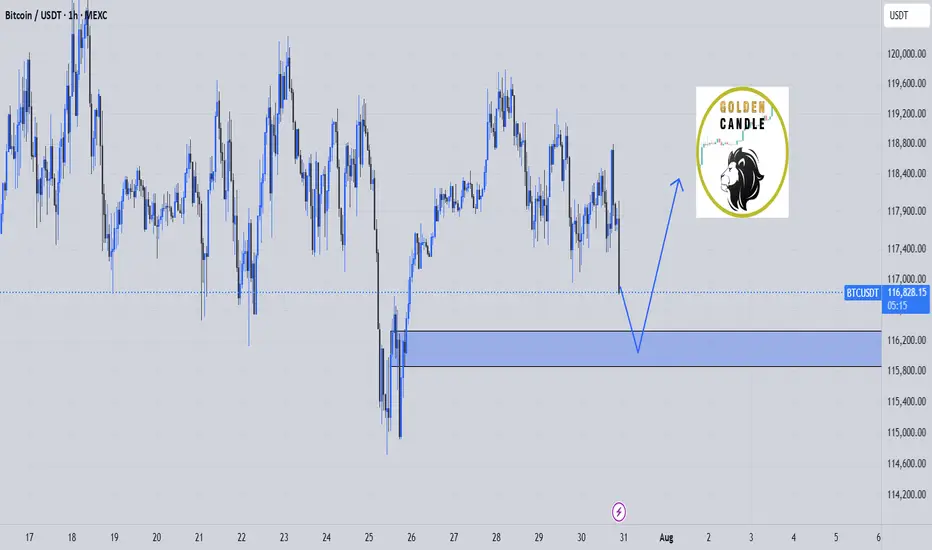
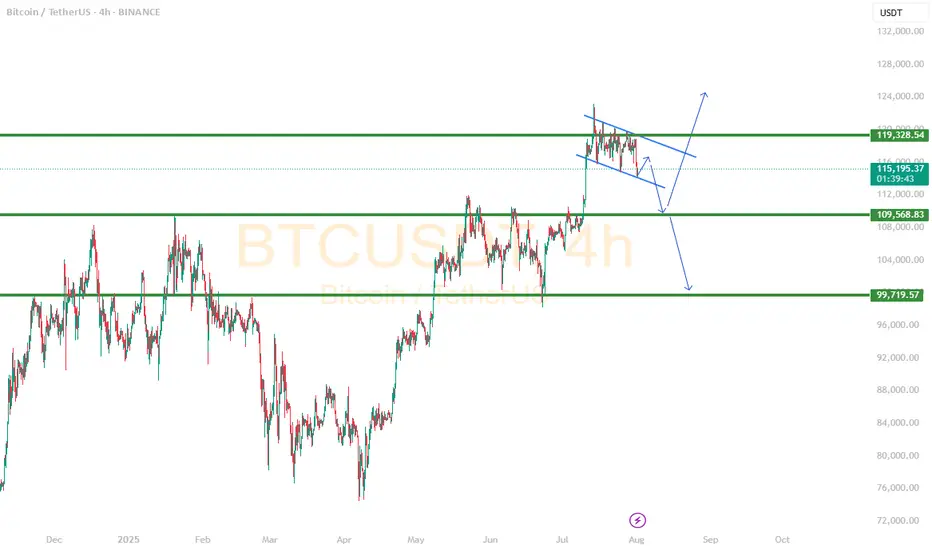
Bitcoin Retests Broken Trendline Minor Resistance in Focus!Bitcoin has recently taken support from the lower levels and moved upward, successfully breaking above a key trendline resistance. Currently, the market appears to be forming another minor trendline resistance on the short-term chart. Interestingly, the previous trendline that was broken is now acting as a support zone, indicating a potential shift in market structure.
If the price manages to break this newly developing minor trendline resistance, we may expect a possible retest of that level. Should the retest hold, it could provide a strong bullish signal, allowing Bitcoin to continue its upward movement toward higher liquidity zones or resistance levels.
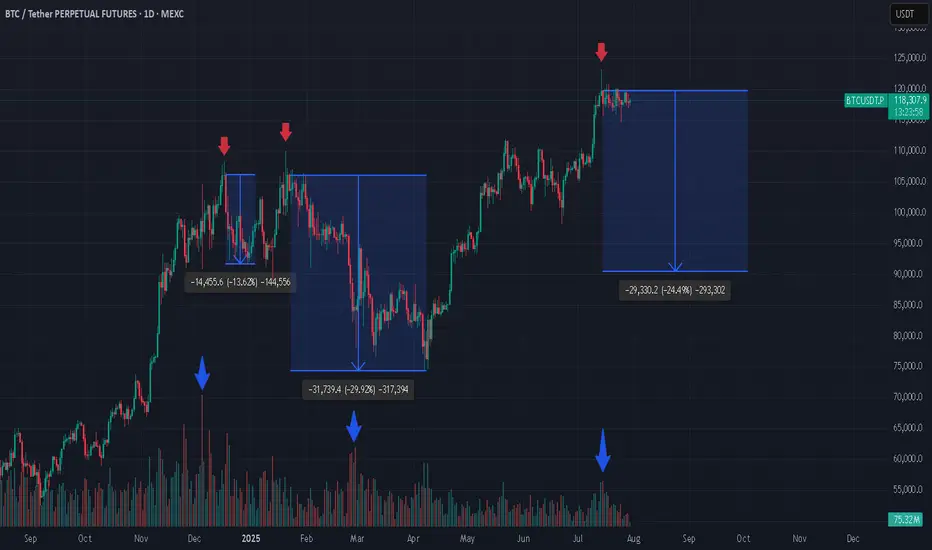
3 Bitcoin Tops, Weak Green Candles, and What’s Next? If you're closely monitoring the Bitcoin (BTC) market, patterns often begin to reveal themselves in surprising ways. In the attached chart, I’ve highlighted three major local tops that Bitcoin has made, each marked by a weak green daily candle. What’s even more striking is what comes next: a dramatic increase in trading volume, followed by steep corrections.
Spotting the Pattern: Weak Green, Heavy Volume
At each pointed top (see red arrows), BTC formed an all-time high (ATH) with a relatively weak green candle, hardly the sign of euphoric buying strength.
Look closely at the volume bars below (blue arrows). Each time, as price struggled to push higher, volume surged after the top, often a signal of major sellers stepping in or longs closing en masse.
What followed? Significant corrections: -13.6%, -29.2%, and, now it might be shaping up for another potential drop (-24.1%) if history rhymes.
Why Does This Matter?
From a technical analysis perspective, volume is the fuel behind price moves. When a new high is reached with limp buying (weak green candles) but is swiftly met with rising volume on the way down, it’s a classic sign of distribution, a strong hand selling into retail euphoria.
Is Another Drop Coming?
Given the consistency in behavior, it’s not unreasonable to ask: are we about to witness another similar correction now that BTC has again hit a top with a weak green candle and volume is ticking up? The historical evidence certainly makes it plausible.
Long-Term Perspective: Still Bullish
Despite these corrections, my long-term outlook remains bullish. Every cycle has corrections, they’re opportunities for healthy consolidation, allowing strong hands to accumulate and the market to reset for its next leg higher.
*not investment advice
#crypto #btc #bitcoin #finance #trading
BITCOIN - Price can turn around and start to move upHi guys, this is my overview for BTCUSD, feel free to check it and write your feedback in comments👊
The price reversed its prior downtrend with a decisive breakout from a falling channel.
This breakout triggered a strong upward impulse, which then began to consolidate into a large symmetrical pennant.
However, the price recently failed to hold the lower support trendline of this pennant and broke to the downside.
The asset is currently trading just below this broken trendline, in what appears to be a liquidity grab.
To continue upwards, buyers must now overcome the immediate resistance located at the $116300 level.
I expect that this breakdown was a fakeout, and the price will soon reverse, break through the $116300 resistance, and continue its rally toward the $121000 target.

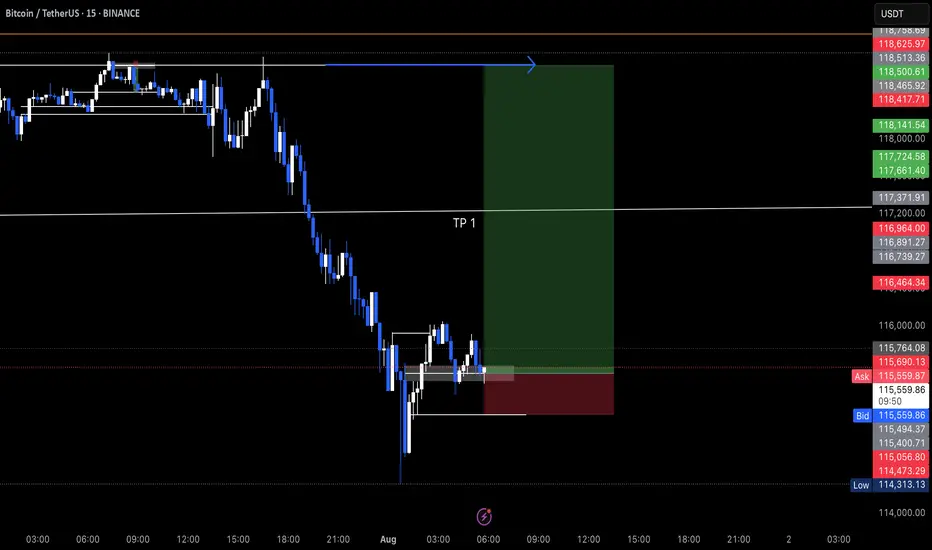
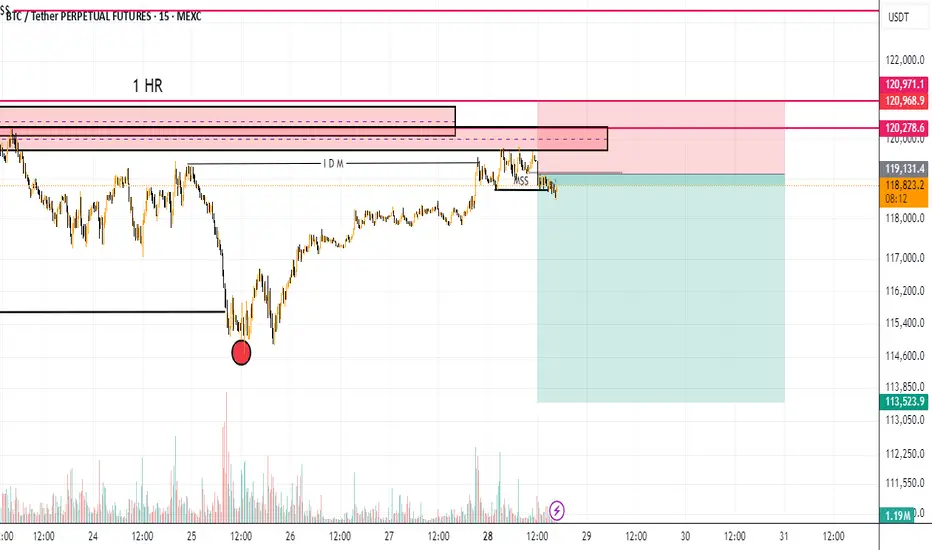
btc short tradeon 1hr timeframe btc take the inducement and on 15m done MSS and now rice going to retest the 15m advanced oder block
entry 19131
stoploss 120990
target 1; 114685
target 2 ; 113650
Bitcoin is Coming to it's Support #BitcoinHello Trader's
Here's some info about selling pattern formed in Bitcoin
Check out this level..
How many off you traded this selling

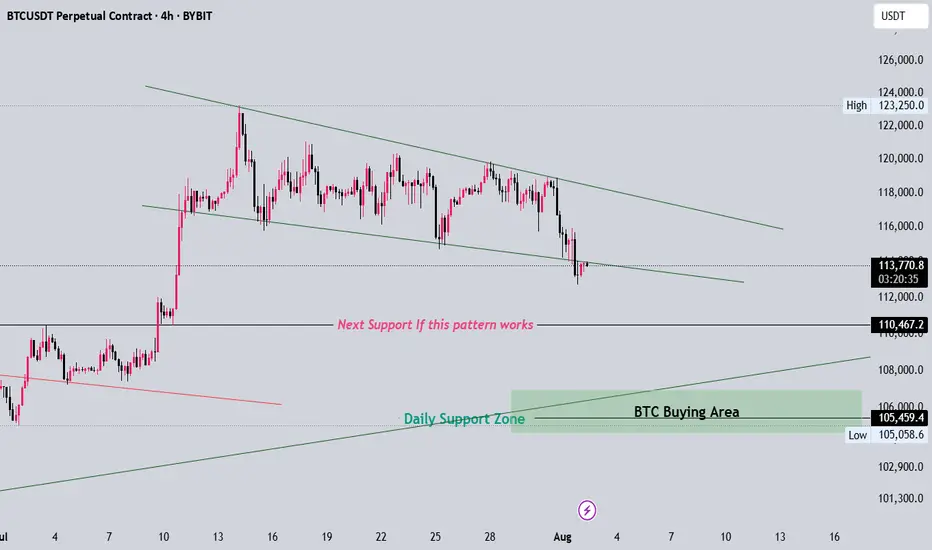
BTC Clear Idea if this pattern worksFor now please observe some time if btc breaks down to next target which is arround 110k then btc will definetly move towards 105k becuase that is its daily trendline support
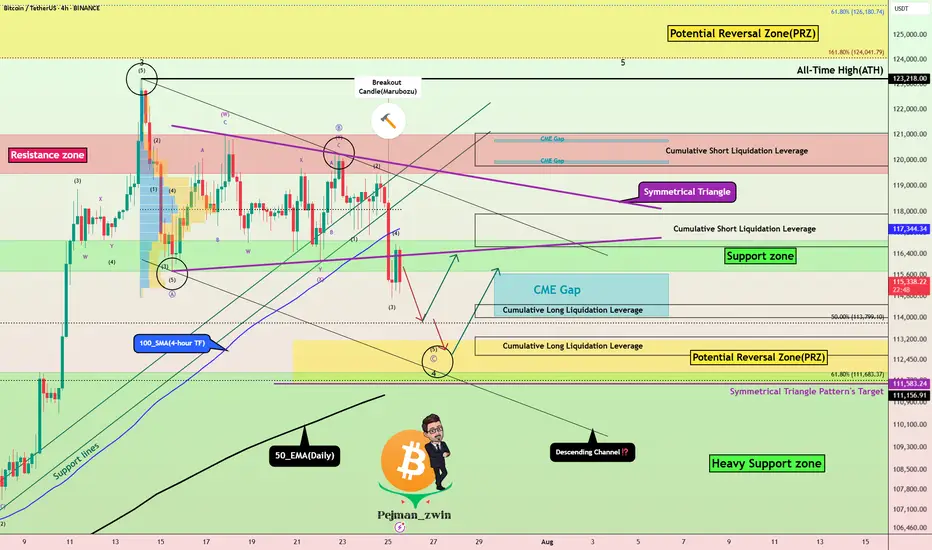
Bitcoin Correction Maturing – Long Setup Brewing!Bitcoin ( BINANCE:BTCUSDT ) has fallen by more than -4% over the past day.
Let's take a look at the reasons for the decline.
One of the key reasons behind Bitcoin’s decline in the past 24 hours ( July 25 ) could be the reduced likelihood of Jerome Powell being replaced as Chair of the Federal Reserve.
In recent days, market participants were speculating that Donald Trump might replace Powell — a scenario that was considered bullish for risk assets like Bitcoin. However, recent reports of a meeting between Trump and Powell, and signs that Powell might not be dismissed, have weakened this fundamental narrative.
This meeting may signal a truce or reduced tension between Trump’s team and Powell , which could imply a continuation of current Fed policies. That’s bad news for Bitcoin, as it removes a potential psychological tailwind from the market and dampens speculative sentiment.
As a result:
Over $500 million in liquidations(Long Positions) occurred
Weak inflows into Bitcoin ETFs
A stronger U.S. Dollar Index ( TVC:DXY )
And declining Gold( OANDA:XAUUSD ) prices over the past two days
all added additional selling pressure on BTC. Now let's take a look at Bitcoin's conditions on the 4-hour time frame .
Bitcoin currently appears to have broken the Support zone($116,900-$115,730) , Support lines , 100_SMA(4-hour TF) , and the lower line of the Symmetrical Triangle Pattern with a bearish Marubozu candle .
Note : In general, trading was difficult when Bitcoin was inside a symmetrical triangle (about 10 days).
It also seems that the pullback to these zones has ended and Bitcoin is waiting for the next decline .
In terms of Elliott Wave theory , Bitcoin appears to be completing microwave 5 of microwave C of major wave 4 . There is a possibility that main wave 4 will create a descending channel and complete at the bottom of the descending channel (at Potential Reversal Zone(PRZ) ).
I expect Bitcoin to start rising again after completing the CME Gap($115,060-$114,947) from Cumulative Long Liquidation Leverage($114,480-$114,000) or Cumulative Long Liquidation Leverage($113,284-$112,603) near the PRZ and Heavy Support zone($111,980-$105,820) .
Cumulative Short Liquidation Leverage: $117,904-$116,665
Cumulative Short Liquidation Leverage: $121,046-$119,761
Do you think Bitcoin has entered a major correction, or does it still have a chance to create a new ATH?
Please respect each other's ideas and express them politely if you agree or disagree.
Bitcoin Analyze (BTCUSDT), 4-hour time frame.
Be sure to follow the updated ideas.
Do not forget to put a Stop loss for your positions (For every position you want to open).
Please follow your strategy and updates; this is just my Idea, and I will gladly see your ideas in this post.
Please do not forget the ✅' like '✅ button 🙏😊 & Share it with your friends; thanks, and Trade safe.
BTC 108K - 112K ZONE Why 108k to 112k zone is important?
Bitcoin recently made a new all-time high and is now undergoing a healthy correction — nothing to worry about.
The $108,000 to $112,000 zone is a key support area due to three major factors:
1. Strong previous support level
2. A daily trendline aligning with this zone
3. 50% Fibonacci retracement of the recent impulse move
If this support holds, there's a strong possibility Bitcoin will form a new ATH around $130,000 to $140,000.
DON'T PANIC wait for confirmation and see the magic 🚀 🚀

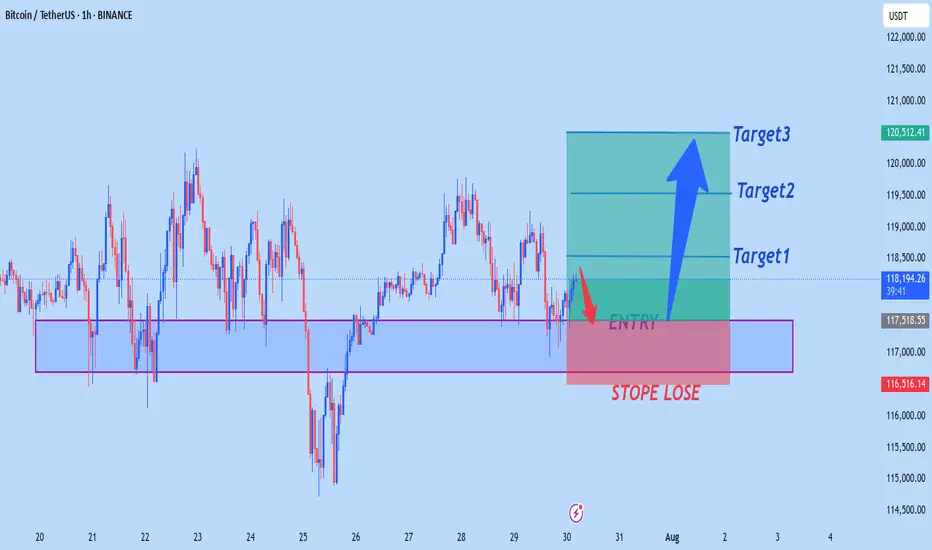
BTCUSD NEW OUTLOOKBtcusd buy from 117,500
Target1 118,500
Target2 119,500
Target3 120,500
Stope Lose 116,500
TRADE AT YOUR OWN RISK
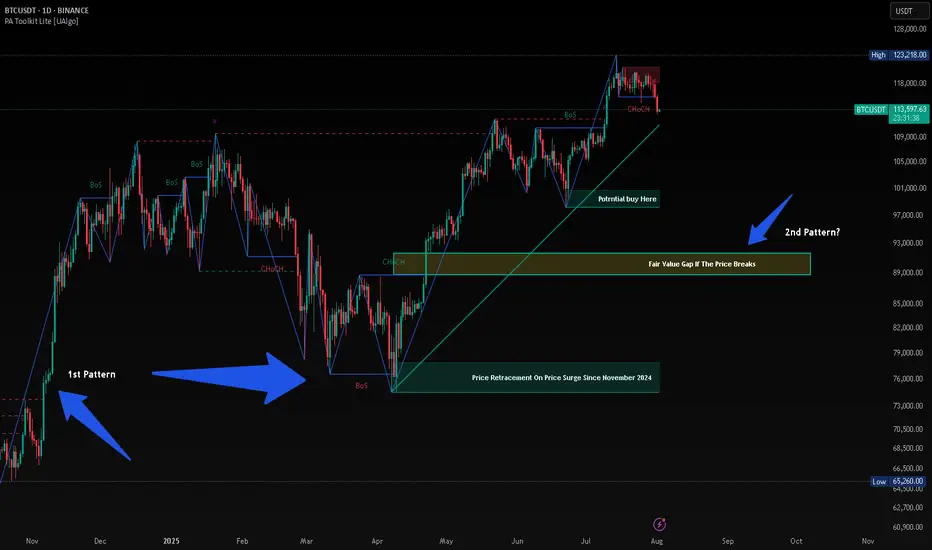
BTC HUNTS LIQUIDITYThis is just my opinion, BTC will hunt liquidity before taking new High. Since November 2024 after President Trump was elected, the price of BTC surge from $74,000 and retrace almost the same price on April 2025 after taking its new High. History will repeat itself and when history failed, there will be a long Bearish at least 90%.
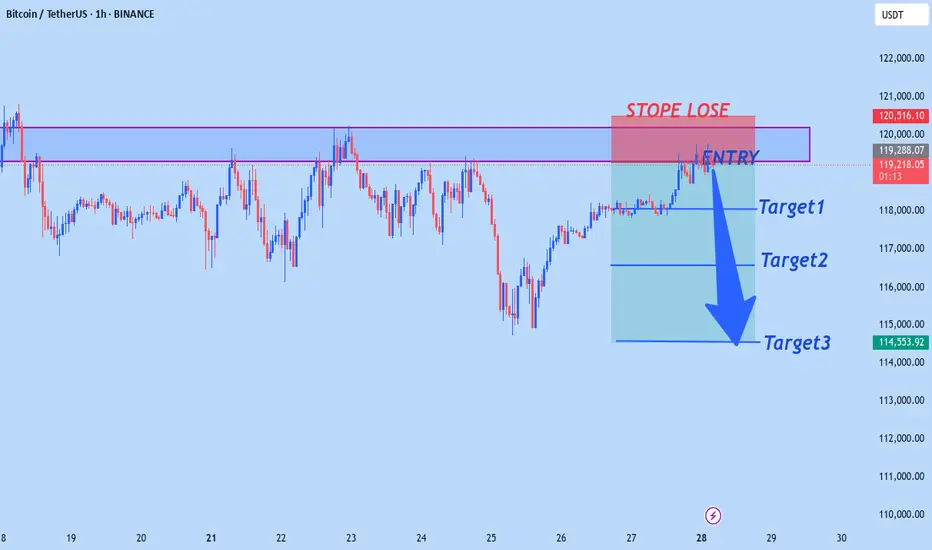
BTCUSD WILL FALLING SOONBtcusd sell from 119,200
Target1 118,000
Target2 116,500
Tagret3 114,500
StopeLose 120,500
Trade at your own risk
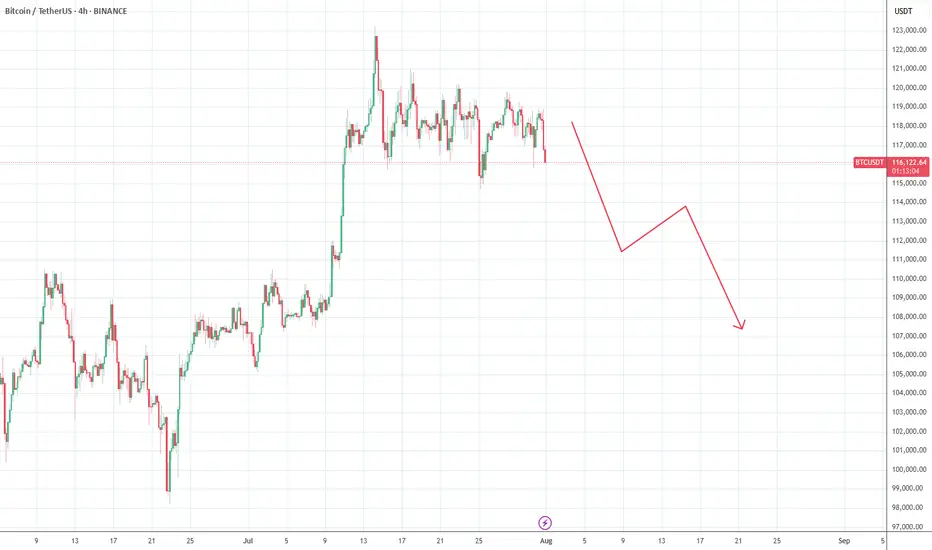
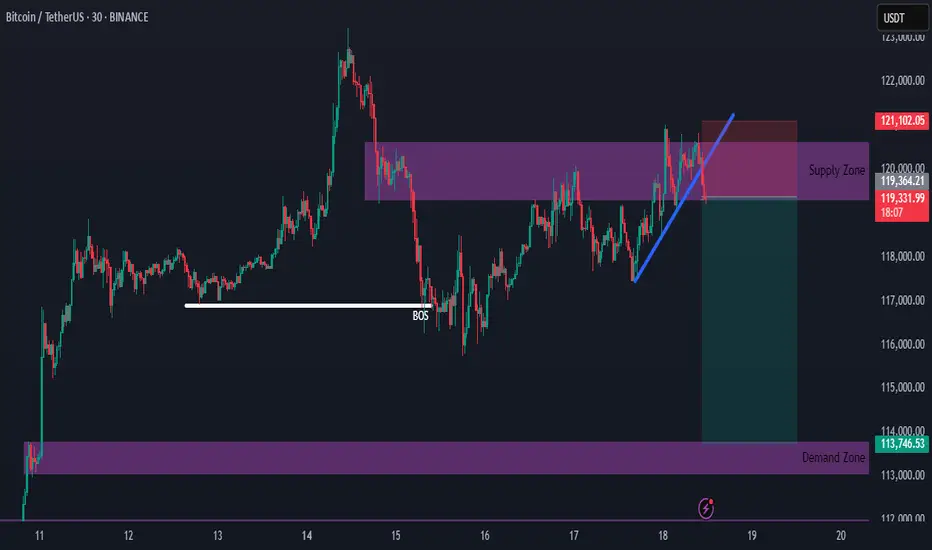
Bitcoin Supply Zone Intact — New Short Setup DevelopingHello everybody!
The supply zone we discussed in the previous idea is still holding.
We have a new opportunity to go short upon the break of the upward trendline.
The most likely target is around 114,000.
2 Scenarios for BTCNow that the cup and handle formation has been reached and the correction finished, I think we have 1 more leg up.
It's also possible that we fall from here, but I think another fakeout upwards is likely as bearish divergence forms on the month, but isn't quite there yet (RSI needs 1 more higher high to confirm bearish divergence)
Either way, my short targets are the 0.618 fibs. I am expecting the typical -70-75% crash by 2027 before the next cycle begins

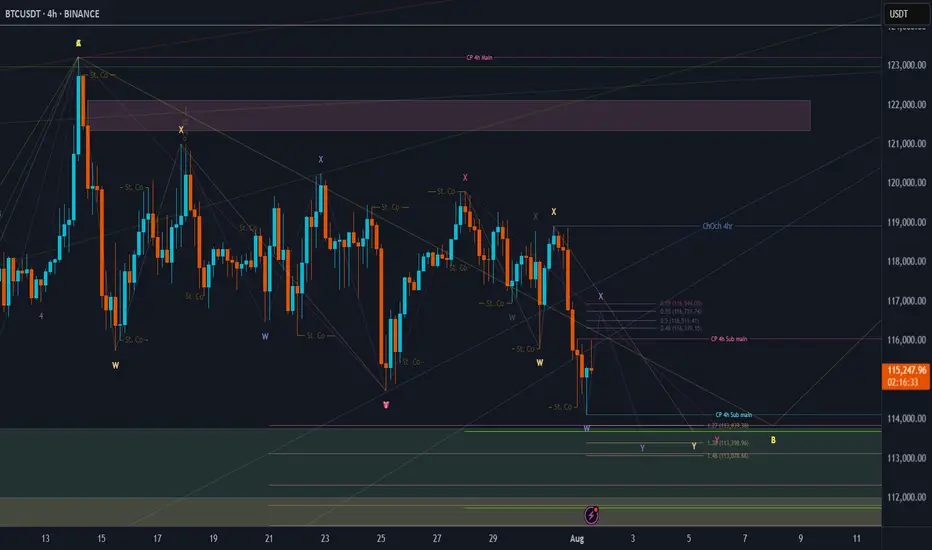
BTC Price Prediction and Elliott Wave AnalysisHello friends,
>> Thank you for joining me in my analysis. We have finished the pink X wave directly, then we have gone to the final pink Y wave, which consists of wxy in orange counting. Now we are moving into the final Orange Y wave.
>> our confirmations:
* 4Hr TF: Breaking 118990 for the next hours, we will end the whole Yellow B "correction" wave successfully. .
Keep liking and supporting me to continue. See you soon!
Thanks, Bros
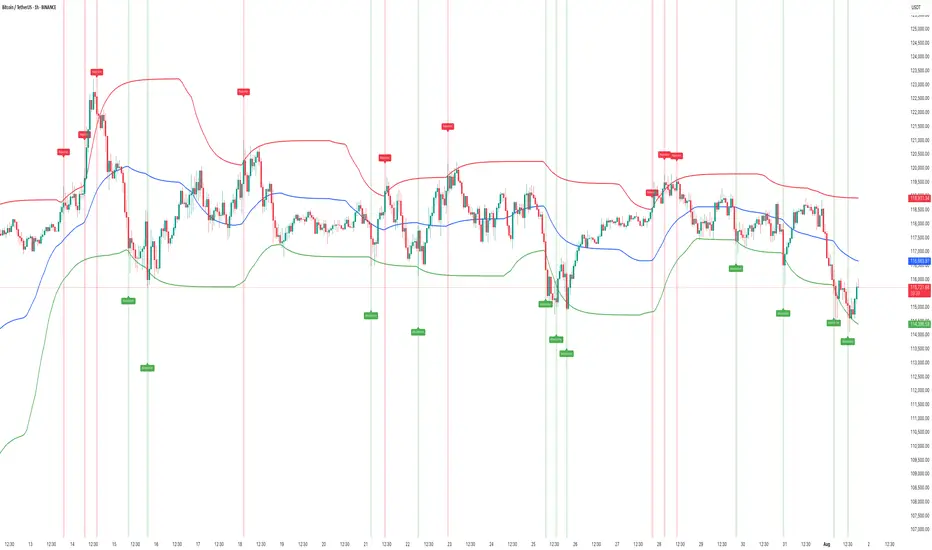
HOW TO Spot Liquidity-Driven Reversals & Market TrapsAdaptive Liquidity Pulse
🎯 Spot Liquidity-Driven Reversals & Market Traps
The Adaptive Liquidity Pulse is designed to help traders detect high-volume rejections and absorptions, revealing where big players are likely defending or accumulating positions. This indicator is especially useful for spotting market traps, liquidity sweeps, and swing reversals.
⸻
🧠 How It Works
1. Dynamic Liquidity Zones
• Red Band (High EMA) → Potential supply/rejection zone
• Blue Band (Mid EMA) → Equilibrium / magnet zone
• Green Band (Low EMA) → Potential demand/absorption zone
2. Signal Labels
• 🔴 Rejection → Price spikes into high liquidity with volume → Bearish bias
• 🟢 Absorption → Price flushes into low liquidity with volume → Bullish bias
3. Volume-Weighted Detection
• Only triggers signals when volume exceeds a configurable threshold
• Filters out weak moves, highlighting true liquidity events
⸻
📊 Best Use Cases
• Scalping & Intraday Trading: Identify early reversal points
• Swing Trading: Track absorption/rejection cycles to time entries/exits
• Liquidity Sweep Detection: Spot where false breakouts occur with volume confirmation
⸻
⚡ Trading Tips
• Use Rejection (Red) for short entries or take-profits near highs
• Use Absorption (Green) for long entries or short exits near lows
• Combine with support/resistance zones or trend structure for higher accuracy
• Midline (Blue) often acts as a mean-reversion magnet in ranging markets
⸻
📢 Alerts
• 🔴 Rejection Alert → Strong selling pressure at liquidity zone
• 🟢 Absorption Alert → Heavy buying at demand zone
⸻
🧠 Why Traders Love It
• ✅ Visualizes hidden liquidity interactions
• ✅ Highlights trap zones before reversals occur
• ✅ Works across crypto, indices, forex, and commodities
• ✅ Designed for confluence with other strategies
⸻
This script gives you a real-time pulse of liquidity shifts, allowing you to trade like institutions and avoid falling into retail traps.
⸻
Two simple scenarios could playing out The buying pressure has been slightly less over the last week, I see a small improvement today but later this weekend, it is still likely to head downward towards the 110k area.
The Curtain Falls on the Script: Why I Believe It's Time to StopHello everyone, this is EC.
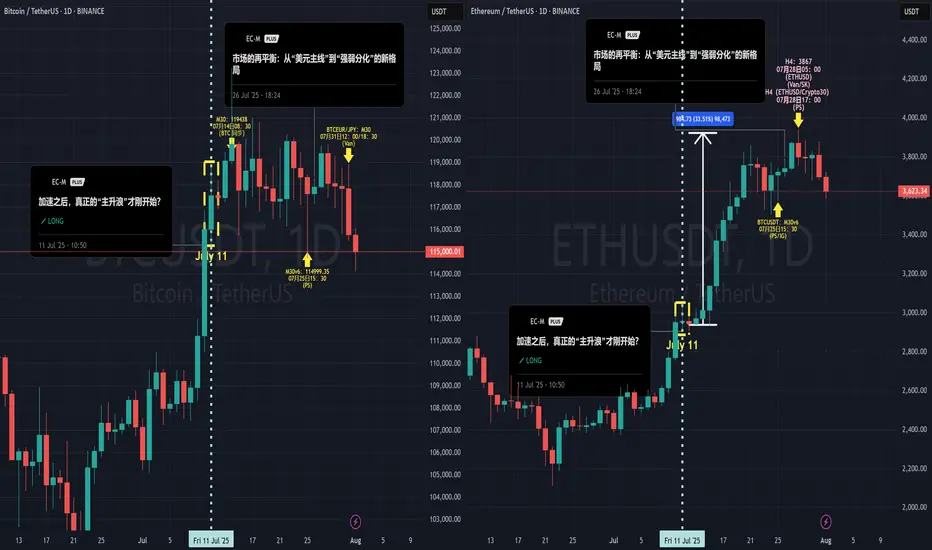
From late June through July, we experienced a full-fledged primary uptrend in crypto, driven by a weakening U.S. Dollar. From the script preview to the execution of the plan, every step has been clearly documented.
However, today, I want to share a different, more cautious perspective: I believe this script may be nearing its end.
I. Reviewing the Script and the "Bubble's" Manifestation
After our call on July 4th that the "main bull wave" was starting, the market perfectly delivered on our expectations. What was more interesting was the clear internal divergence we saw, which precisely confirms our thesis about the "bubble phase" from my June 20th article, "The Restlessness Before the Storm."
When the market's sentiment "balloon" is inflated to its limit, capital flows from the leader (BTC) to assets with higher elasticity (ETH).
The data shows that from July 11th until now, ETH took the baton and rallied approximately 35%, while BTC gained only around 6% in the same period. When BTC is already showing signs of fatigue while ETH is still in a solo rally, that in itself is a major signal that the bubble is nearing its end.
II. A Shift in the Winds: The Hand Inflating the Balloon is Loosening
I've chosen to end this script at this moment based on signal changes on two levels:
The "External Factor" Shift: The Potential Strengthening of the USD
As I pointed out in my July 28th analysis, "The Market's Rebalancing," the market has entered a phase of "strength-weakness divergence." This trend is now becoming more evident: the U.S. Dollar, cushioned by the extreme weakness of currencies like the Japanese Yen, has begun to show signs of a broad strengthening. Concurrently, U.S. and European stock markets are pulling back in sync, and global risk appetite is cooling.
The external environment that fueled the bubble (a weak USD) is beginning to falter.
The "Internal Factor" Signal: The Needle Point Inside the Balloon
The crypto market itself is also showing warning signs of resistance (see attached ETH daily chart). When the leading asset, ETH, begins to show signs of stagnation and distribution at its highs, it's like the balloon meeting the needle point. The exhaustion of internal momentum is a more direct warning than changes in the external environment.
III. Conclusion: Don't Be Greedy for the Last Dessert
When the core logic driving the rally (a weak USD) begins to waver, and the market simultaneously shows internal signs of exhaustion, my choice is to end this script and take profits off the table.
This doesn't mean I think crypto will crash immediately. But "no longer suitable to hold" implies that, in my view, the risk/reward ratio at the current level is no longer attractive. A grand feast is coming to an end, and being greedy for the last dessert is not a wise move. Shifting from "buying the dip" to "cautious observation" is the rational choice.
Thank you for your attention and for following along this past month.
#Crypto #BTC #ETH #TradingView #MarketAnalysis #RiskManagement
BTCUSD LongWe´re in a bigger bullish 5wave structure. Right now we´re in the 4th wave and could have completed a ABC correction. On 15min Chart we can see, that we just formed the 1st wave to start the 5th wave in the bigger structure