Bitcoin ready to correct to 92,000A treasure channel that, after a little suffering and fear, cascades down.
Tp:92000
BTCUSDT.5S trade ideas

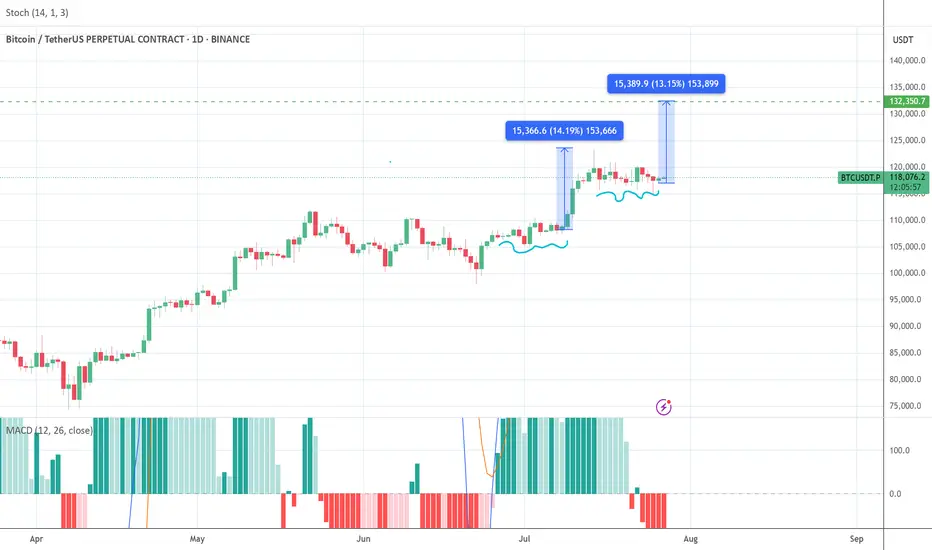
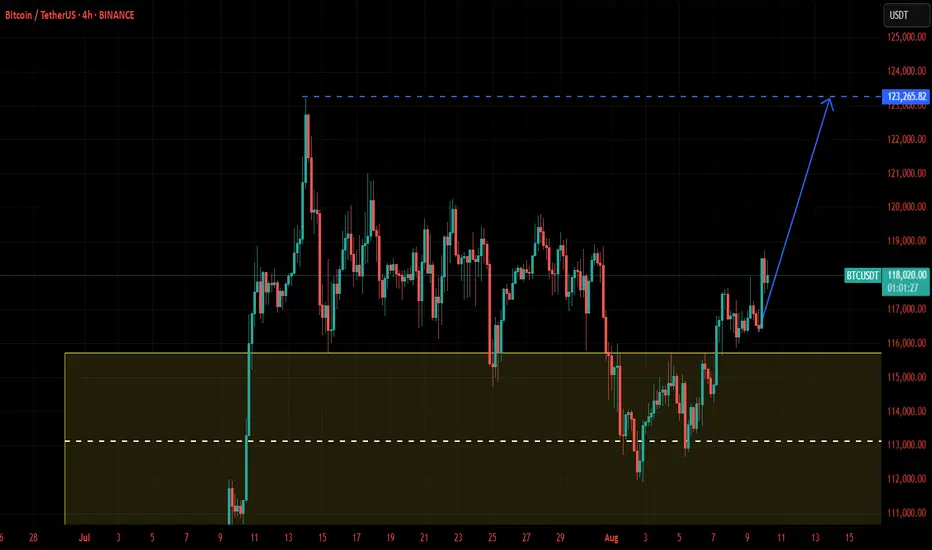
BITCOIN next target 130000-134000 pattern repeatedHi guys, this is my analysis for BTCUSDT in the next few days.
Feel free to check it and write your opinion in the comments.
BITCOIN had been consolidating for two weeks before it reached the ATH 123500 and I think bitcoin has proven to repeat itself. This happened before, and it will happen again.
After reaching the ATH, Bitcoin has been consolidating for the last two weeks.
Therefore, I think that BITCOIN will reach
130000-134000
In the next few days.
Please respect each other's ideas.
This is not financial advice, it's just my humble analysis.
BTC Price Prediction and Elliott Wave AnalysisHello friends,
>> Thank you for joining me in my analysis. I think we have finished the 1st wave in B wave as Pink W, in this micro correction. In my opinion, we will watch 2nd & 3rd waves XY as in pink color, or Yellow B wave ended successfully, just I need to these confirmations:
* Day TF: Breaking 118451 for the next days and keep on above it, lead to ending B wave successfully.
* 4Hr TF: Breaking 118451 for the next hours and keep on above it, lead to ending W wave successfully ( maybe also B ?)
keep like and support me to continue, See you soon!
Thanks, Bros

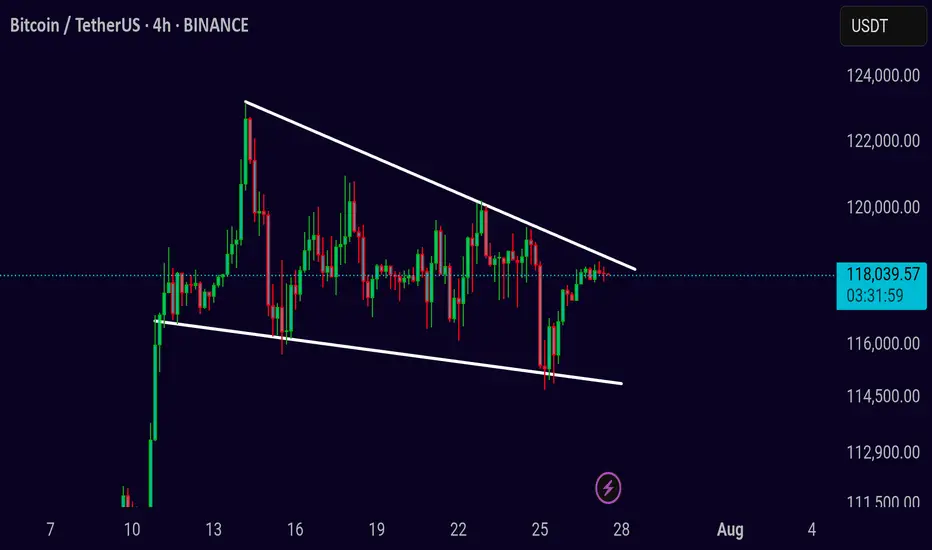
Btc UpdateBTC is moving within a falling wedge and is making its fourth breakout attempt.
A successful breakout and retest of the wedge would confirm a bullish trend, while rejection could signal further movement within the wedge.
The move is up to the buyersHi traders and investors!
The price has already played out the upper boundary of the scenario, rising above 120,500. Then it also reached the lower boundary by dropping below 115,222.
Now we are at an interest moment: will the price continue to move upward or not?
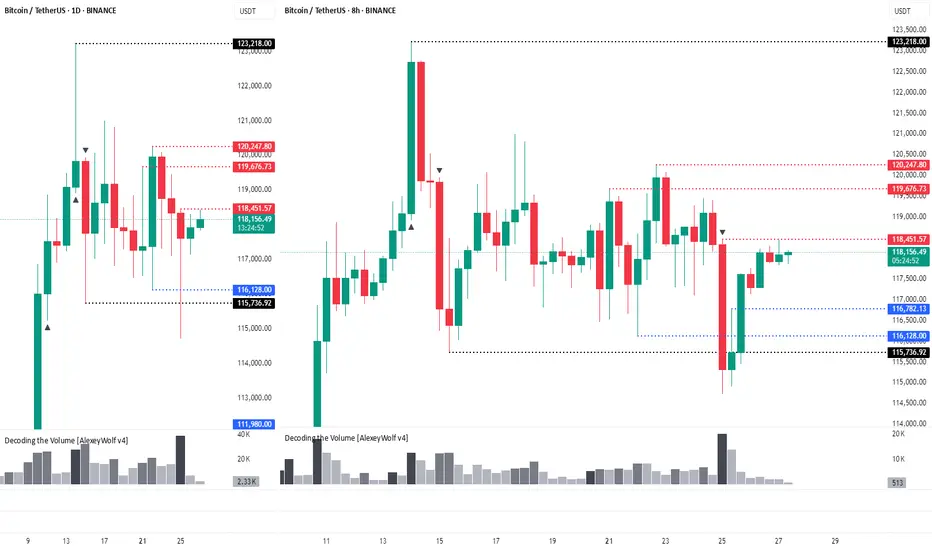
This situation is clearly visible on the 8-hour timeframe.
On the 8H chart, we see a sideways range, similar to the 1D timeframe. The lower boundary is 115,736 and the upper boundary is 123,218. The active initiative is currently with the buyers, and their target is 120,998 и 123,218.
There is a notable bar attacking the lower boundary (115,736) with very high volume. The high of that bar is 118,451. We’re watching to see whether buyers absorb this bar — that will determine how the next move plays out.
There are three key levels where buyers may step in: 116,782, 116,128, and 115,736. If the price drops to any of these, we can look for a long setup.
Above, we also have three resistance levels from the sellers: 118,451, 119,676, and 120,247. We’ll be watching how sellers react if the price tests these zones.
This analysis is based on the Initiative Analysis concept (IA).
Wishing you profitable trades!
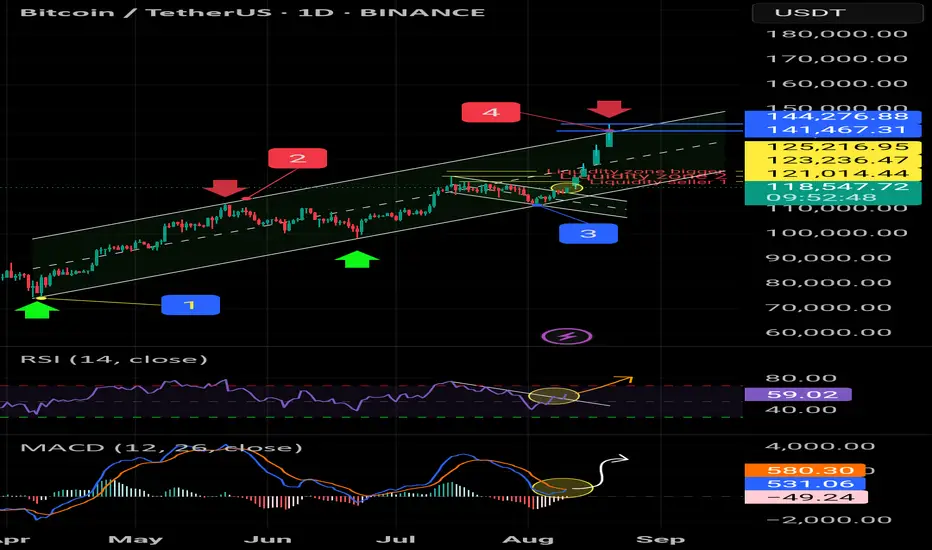
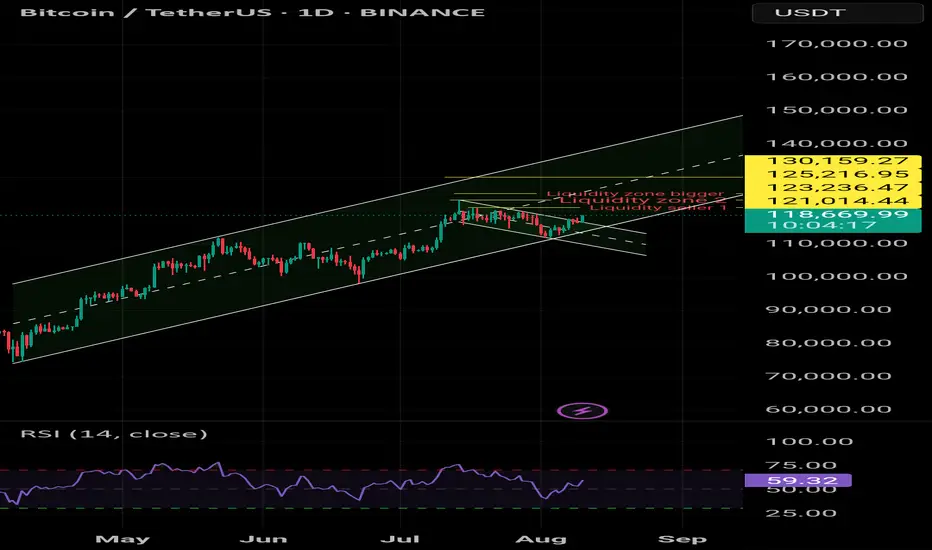
Bitcoin Go 140kBit is moving towards liquidating sellers and there is generally high liquidity.
Pls careful
Liquidity zone 130,000 __144000
⚠️⚠️⚠️⚠️⚠️⚠️☠️☠️☠️
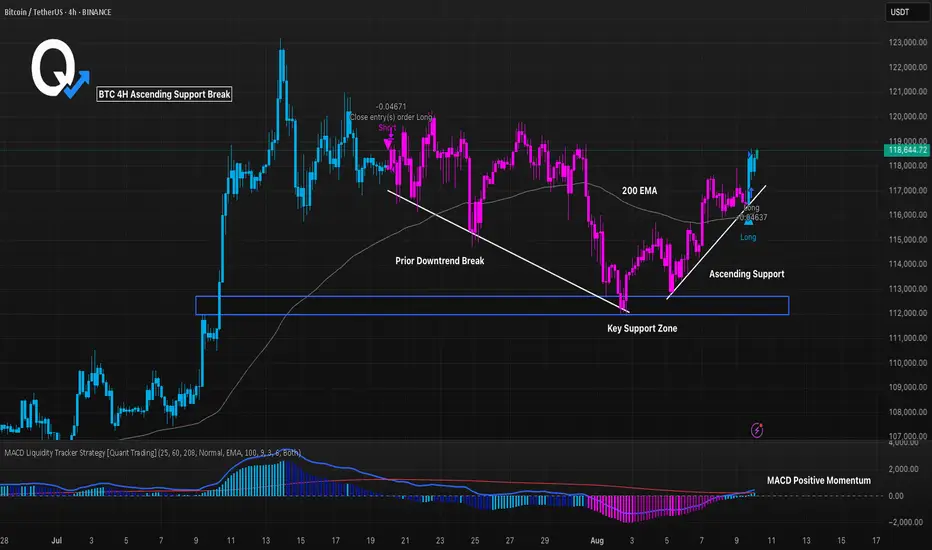
BTC 4H Ascending Support Break, Can Momentum Push Higher?BTC broke its prior downtrend and is now riding an ascending support line. Price remains above the 200 EMA and has reclaimed a key support zone. MACD histogram has flipped positive, showing building bullish momentum. A sustained hold above the trendline could open the path toward higher levels, but a break back below support would weaken the structure. Monitoring reaction near $118.5K for confirmation.
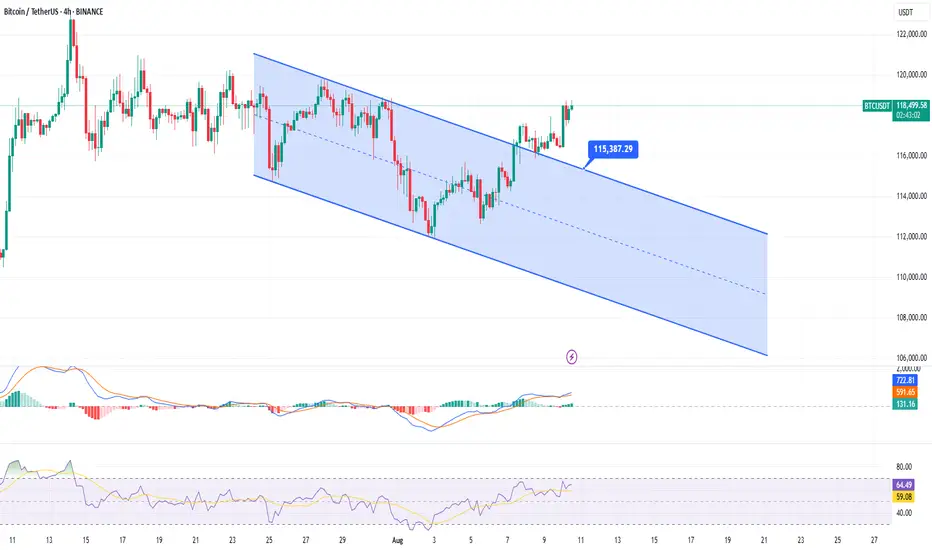
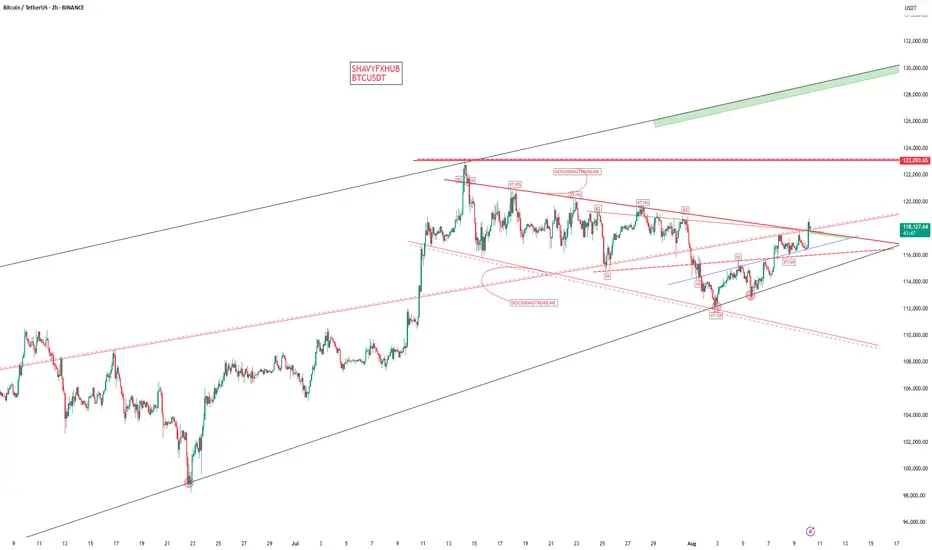
BTCUSDT 4H: Descending Channel Break—115.4k Retest or 120k Run?BTCUSDT (BINANCE) – 4H
Thesis : Price has broken out of the descending channel (7/25–8/10). Holding above the upper boundary ~115,400 suggests a shift from corrective structure to potential trend continuation higher. A clean retest may offer the better R:R.
Key Levels
• Resistance : 119,200–120,000; 121,500–122,000; 123,800–124,500
• Support : 117,200–116,500; 115,400 (channel top / breakout line); 113,000; 111,000
Momentum/Signals
• MACD is above zero with expanding lines; histogram positive (could cool near resistance).
• RSI ~65 on 4H, rising yet not overbought—room higher, but prone to pullback if 70+.
Trade Ideas
• Long on retest : Look for acceptance above 115,400–116,000 after a pullback (wick + strong 4H close).
– Invalidation : 4H close back inside channel <115,400.
– Targets : 119,500–120,000 (T1), 121,500–122,000 (T2), 124,000 (T3).
• Breakout continuation : If price closes >119,200 with rising volume, consider momentum long.
– Invalidation : 4H close <118,200.
– Targets : 120,000 (T1), 121,500–122,000 (T2).
• Contrarian short (only if failed breakout) : 4H close back below 115,400 and midline rejection.
– Targets : 113,000 (T1), 111,000 (T2).
– Invalidation : back above 116,300.
Risk Management
• Size for 1–2% account risk. Wait for 4H candle confirmation; avoid chasing into 120k supply.
• Weekend liquidity often creates wicks—plan entries around closes, not intrabar noise.
Context : A channel break often precedes a change of character; maintaining higher lows above 115.4k keeps the bullish case intact. Re-entry into the channel would negate.
Disclaimer : This is an analysis, not financial advice. Manage your own risk.
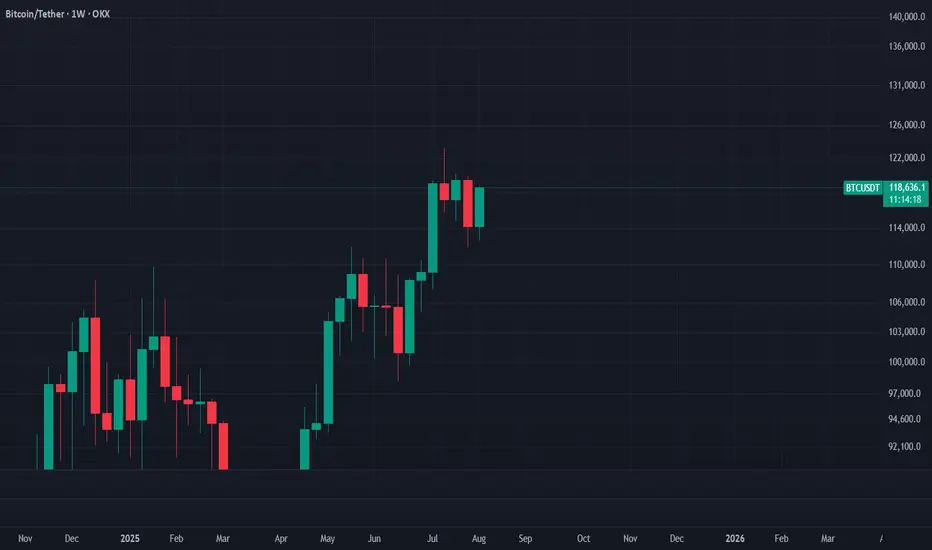
Bitcoin Readies for a $120K Breakout — Watch the Weekly Candle
OKX:BTCUSDT
Summary
If Bitcoin’s weekly candle engulfs the previous one, we can expect an explosive breakout.
Instrument / Timeframe
BTCUSDT, 1W
Scenario
If this week’s candle fully engulfs the prior week, the next week can start decisively bullish and push into fresh highs. For now, we won’t set fixed upside targets; let price discover. Once the market prints a clear resistance at the new peak, we’ll treat that level as Bitcoin’s new ceiling.
Trade Plan (example, not advice)
For long-term buyers who practice sound risk and capital management, a confirmed daily break and close above $120,000 can serve as an entry trigger.
Disclaimer
This is market commentary and reflects my personal opinion. It is not investment advice, a recommendation, or a solicitation to buy or sell any asset. Crypto markets are highly volatile and you can lose part or all of your capital. Always conduct your own research, make independent decisions, and use strict risk management (position sizing, stop-losses, scenario planning). Past performance is not indicative of future results. For guidance tailored to your situation, consult a licensed financial advisor.
#Bitcoin #BTC #BTCUSD #BTCUSDT #Crypto #Breakout #PriceAction #Engulfing #Candlestick #SupportResistance #MarketStructure #Momentum #RiskManagement #PsychologicalLevel #WeeklyClose
btc signalThe analysis went well, but put the breakeven and would you like me to put more signals? I would be happy to hear your comments.Two signals and two profits. Thank you for your attention.

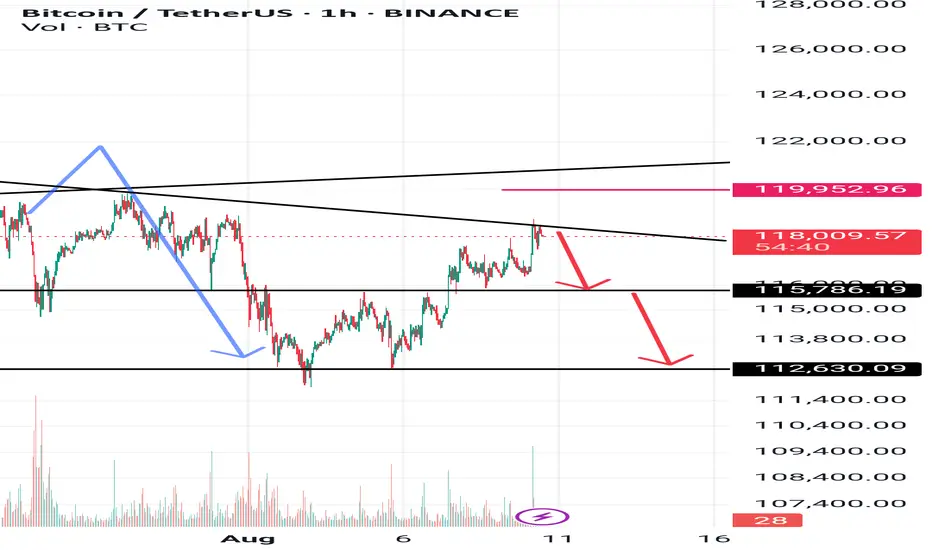
Analysis no 75 btc 1hWelcome to King BTC. The price of Bitcoin is expected to move towards 115,700 with a stop of 119,950 and a second target of 112,700. This is just a possibility.
BTC LONG till 123ki am late on posting this BTC is bullish
#LONG
BTCUSDT #LONG till 123k and move upwards Mark My words
BITCOIN The breakout of the supply roof will be watched .if we have a sustained buy pressure we may hold on the lower level buy zone and target 123k current all time high and print a new all time high.
trading is 100% probability.
bitcoin the breakout of the supply roof will be watched .if we have a sustained buy pressure we may hold on the lower level buy zone and target 123k current all time high and print a new all time high.
trading is 100% probabilty.

BITCOIN WATCH the price action and manage your risk.
the inflow of liquidity is pushing price to retest the current all time high
#btc #bitcoin #crypto

$BTC Breakout LONGI am critical glued to my chart now awaiting the big breakout on this BYBIT:BTCUSDT.P .
If this candle closes just above the trendline, I'm due for some good profit and the breakout will return us to around the 122,000 zones.
This m,eans so much to all holders and will especially usher us into a profitable week.
Note: This is not a financial advice. Do with it, whatever you wish!
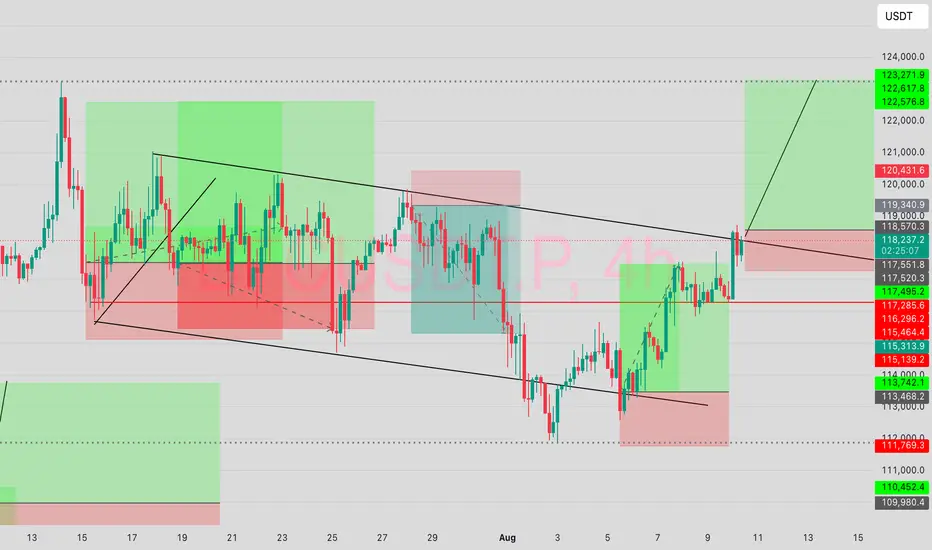
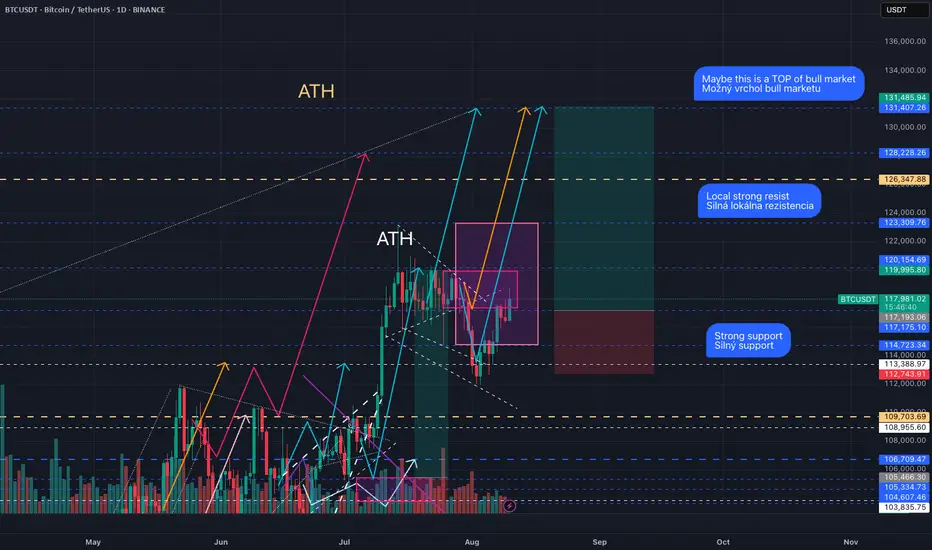
The top of the bull market may be nearWe have strong resistance above us that Bitcoin must overcome. There is also strong support below, which determines the boundaries of the range. I see it this way: if the market remains positive for a while longer and no unexpected fundamentals come, we could overcome that resistance over time. Then I see the next ATH and strong resistance at the level between 131,000 and 132,000 USD. I have drawn exactly where I think it works out on the chart. However, it is possible that this will also be the top of this year's bull market.
I have also drawn a possible swing trade that could work with this setup.
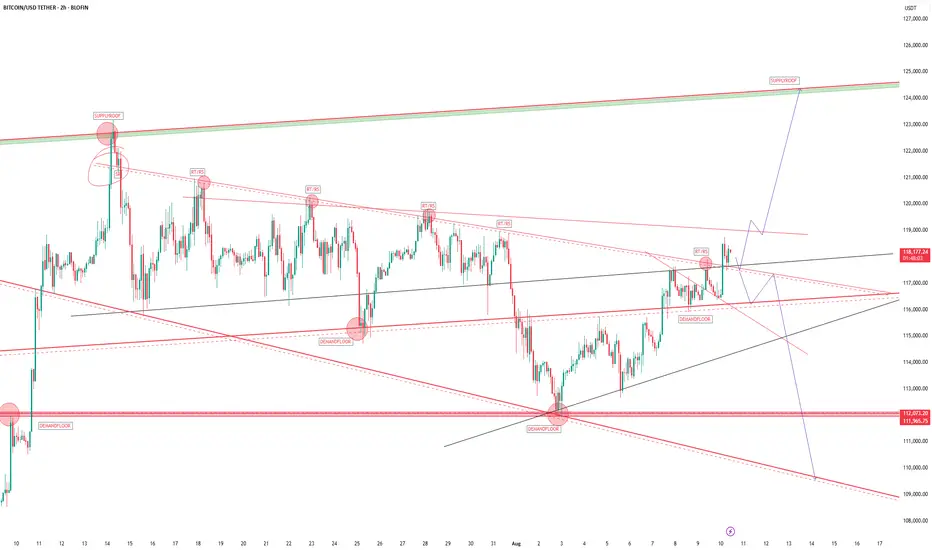
BITCOINBITCOIN ,THE STRUCTURE ON 4HR provided an ascending trendline and we have seen buyers keeping that dynamic support for buy .
we will monitor the current supply roof breakout for better buy confirmation after seeing a 2hr ascending trendline cross providing a support that took us to 118k if correction into 116-117k hold and the broken supply becomes demand than 123k all time high retest is on the desk.
trading is 100% probability.
manage your risk.
#btcusdt #bitcoin #tbc #crypto
BITCOIN BTC BITCOIN ,THE STRUCTURE ON 4HR provided an ascending trendline and we have seen buyers keeping that dynamic support for buy .
we will monitor the current supply roof breakout for better buy confirmation after seeing a 2hr ascending trendline cross providing a support that took us to 118k if correction into 116-117k hold and the broken supply becomes demand than 123k all time high retest is on the desk.
trading is 100% probability.
manage your risk.
#btcusdt #bitcoin #tbc #crypto

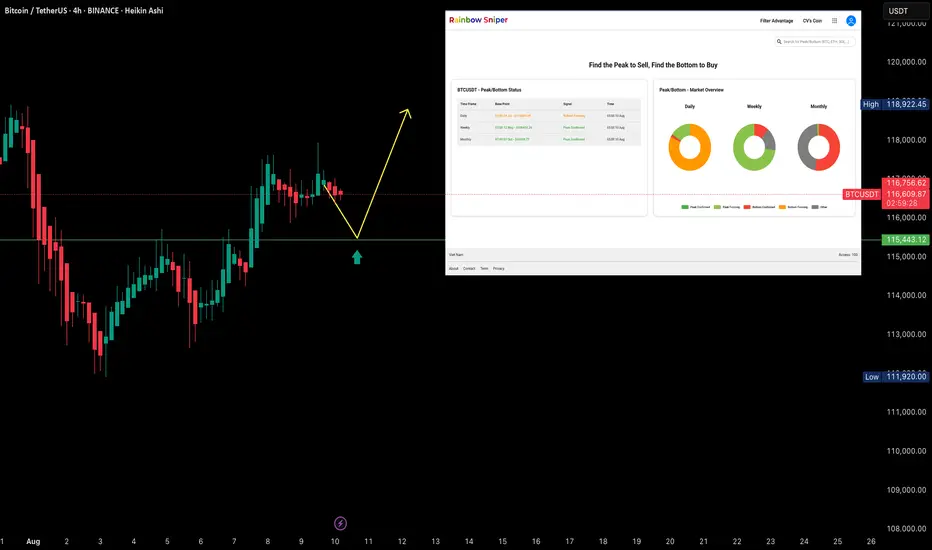
BTCUSDT — D1 Bottom Still Not Complete?BTCUSDT — D1 Bottom Still Not Complete?
The market’s process works with precision. Not yet means exactly that — even if price pushes higher, it will eventually return to complete the bottom formation.
On the D1 timeframe, BTCUSDT began forming its bottom on July 24, 2025 at $118,300.
On the W timeframe, BTCUSDT started its upward leg on May 12, 2025 (W’s third peak).
On the M timeframe, BTCUSDT began its upward leg on October 1, 2023 and is now in the process of forming a top before a potential decline.
Our strategy is patience: let BTC complete this final D1 peak.
Potential long entries:
Around $115,500
Or when BTCUSDT officially completes its D1 bottom formation — at which point we can also long altcoins to ride the next wave of capital inflow.
5 RRThis may be a very Nice trade on bitcoin! It looks like it is still trying to reach higher in the short term.

BTCUSDTBTC/USDT Price Chart Analysis
1. Chart Type and Instrument
The provided chart is a line chart that displays the price movement of the BTC/USDT instrument on the Binance exchange. The timeframe used is daily (1D), covering the period from approximately October of the previous year to August of the current year.
2. General Trend
Overall, the BTC/USDT chart shows a very strong and sustained upward trend (uptrend) throughout the displayed period.
* Phase 1 (October 2024 - March 2025): A significant uptrend occurred, with the price of Bitcoin rising from below $60,000 to reach its peak at around $120,000. During this period, there were phases of correction and consolidation (e.g., around March), but the main trend remained upward.
* Phase 2 (April 2025 - August 2025): After the correction in March-April, the price resumed its upward trend. This rally brought the price back to the area of the previous peak.
3. Significant Support and Resistance Levels
* Support: Significant support levels can be identified in a few areas:
* Short-Term Support: The psychological level around $110,000, which served as a consolidation area before the price continued its climb.
* Mid-Term Support: The level around $100,000, which previously acted as resistance and now has the potential to become strong support.
* Long-Term Support: The area around $80,000, which was the base for the price recovery from the April correction.
* Resistance: The most crucial resistance level right now is the area around $120,000. The current price, $116,822.78, is attempting to approach and break through this resistance level. This level represents the all-time high (ATH) or a new historical peak.
4. Important Price Patterns or Formations
The chart shows a repeating pattern of price increases, where a strong upward movement is followed by a correction or consolidation, before continuing the rally. The most relevant event currently is that Bitcoin's price is retesting its historical peak level around $120,000. This movement indicates very strong bullish momentum.
5. Technical Indicators
Although the chart is not equipped with technical indicators, the price action itself provides a clear signal. The price is currently trading near its historical peak, which shows buyer dominance.
6. Specific Reasons for Entry
The BTC/USDT chart is at a critical juncture, attempting to break through the historical resistance level of approximately $120,000. There are two primary scenarios for an entry decision:
* Scenario 1 (Confirmed Breakout - Bullish Entry): The reason to enter a long position is to wait for a valid breakout confirmation. If the price successfully breaks and holds (closes a daily candle) above the $120,000 level, this could be a very strong signal that the uptrend will continue to higher levels. This breakout would indicate that buying pressure is strong enough to overcome selling pressure at the resistance level, opening the way for a significant price increase.
* Scenario 2 (Pullback - Safer Bullish Entry): Another option is to wait for the price to undergo a correction or a pullback to the nearest support level, for example, around $110,000 or $100,000. If these levels successfully hold the price and show signs of a bounce, this could be a safer entry point with a lower risk.
7. Risks and Watch-outs During Entry
* Potential for Failed Breakout (False Breakout): The biggest risk is if the price fails to break through the resistance and instead experiences rejection. The price could rise slightly above $120,000 (as the chart shows) and then quickly reverse, forming a "false breakout." This would lead to losses for traders who entered a buy position without confirmation.
* High Volatility at Resistance Area: Historical resistance areas like $120,000 tend to be zones of high volatility, where a fierce battle between buyers and sellers takes place. Price movements can be very erratic.
* Divergence or Trend Exhaustion: Although this chart does not show indicators, it is important to watch out for signs of trend exhaustion, such as bearish divergence on momentum indicators (RSI, MACD), if you were to use them.
Summary of Entry Decision:
The entry decision at this time is highly dependent on how the price reacts to the $120,000 resistance level. It is not an opportune time to enter aggressively because the risk of a rejection is very high. The best strategy is to wait for confirmation.
* Wait for a confirmed breakout: If the price breaks and holds above $120,000, consider entering a long position.
* Wait for a re-test: If the price experiences a correction (pullback) to the nearest support level ($110,000 or $100,000) and shows signs of a bounce, this could also be a good entry point.
