BTCUSDT - UniverseMetta - Signal#BTCUSDT - UniverseMetta - Signal
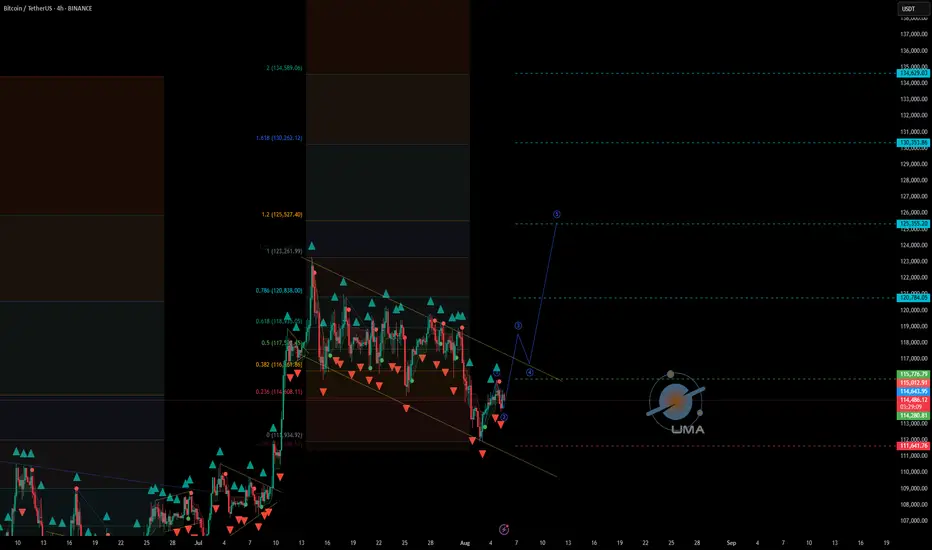
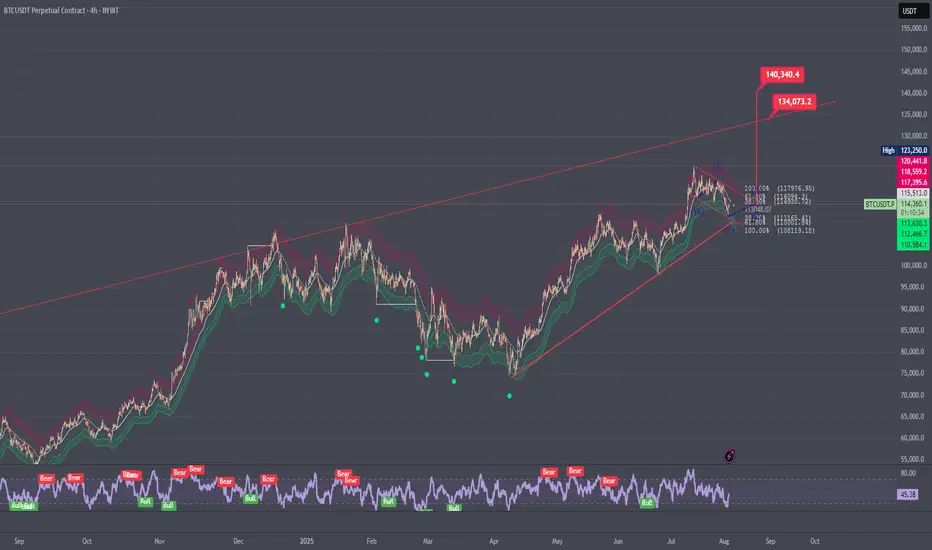
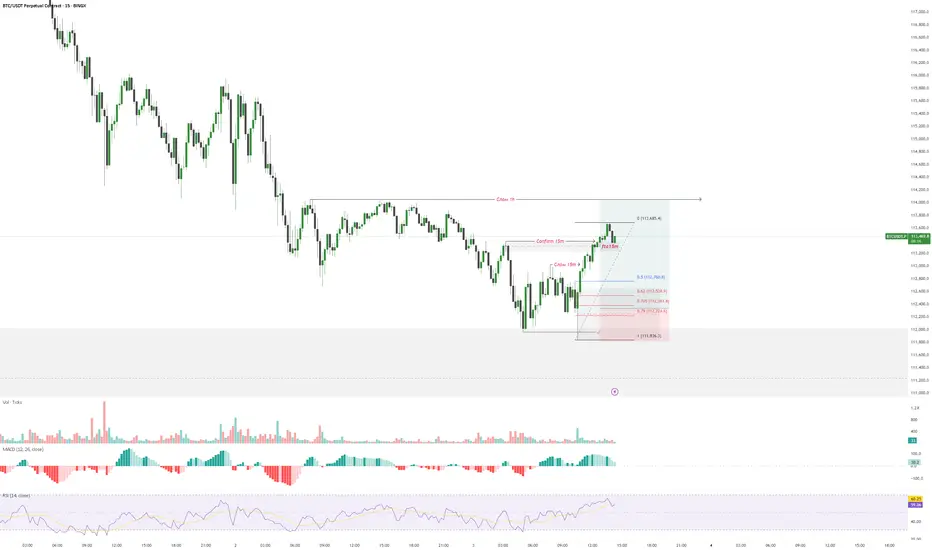
H4 - Formation of the 3rd wave from the lower border of the channel. Stop behind the minimum of the 1st wave.
Entry: 115776.79
TP: 120784.05 - 125355.20 - 130353.86 - 134629.03
Stop: 111641.76
BTCUSDT.5S trade ideas
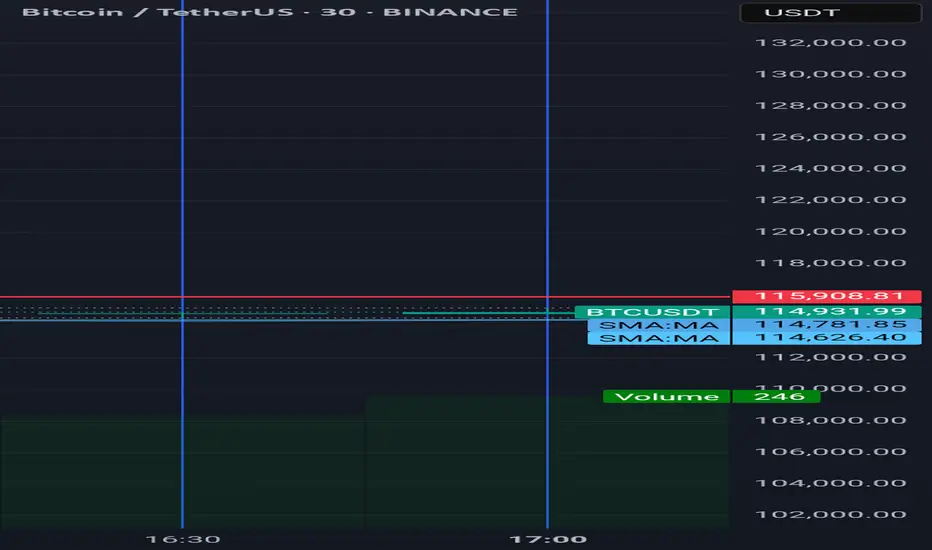
127000 USD on BTC? Analysis of the Bitcoin (BTC/USD) chart on the TradingView platform reveals several key observations. The current price is hovering around $114,249.14, suggesting a short-term decline following a previous significant rise, evident as a high peak on the chart. The two moving average lines—green (shorter period) and red (longer period)—indicate an upward trend, as the green line is above the red, signaling bullish strength in the broader perspective. However, recent red candles point to selling pressure, with the price approaching a support zone around $113,000–$114,000, which could serve as an area of consolidation or a potential rebound.
In the lower part of the chart, the oscillator (e.g., RSI or another momentum indicator) remains in a neutral zone, suggesting no significant overbought conditions but also a lack of strong momentum for further declines. It’s worth noting that the price is currently testing a critical support level, and a break below this could lead to further downside, while a bounce could target higher levels. Based on the current trend and historical price action, a suggested target price of $127,000 USD appears achievable if the support holds and bullish momentum resumes, potentially driven by a breakout above the recent high.
Potential TP: 127 000 $

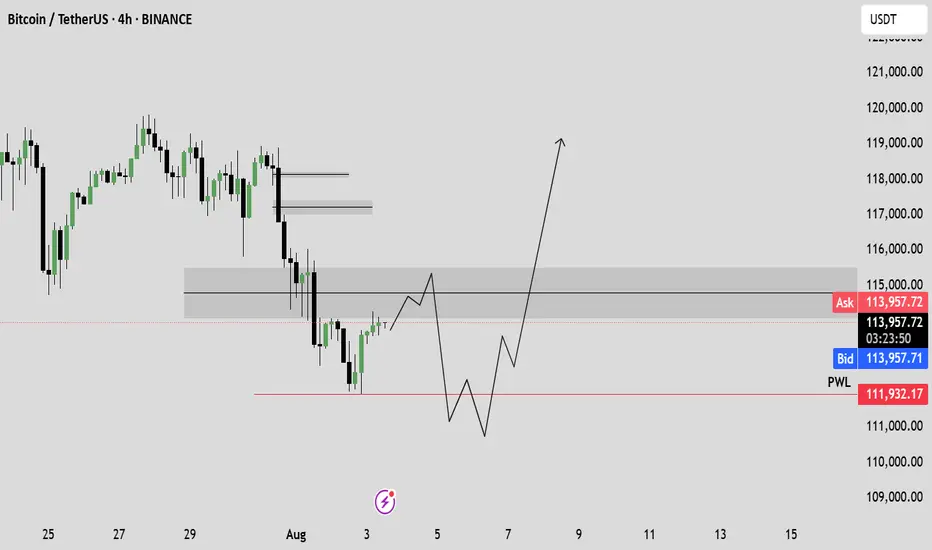
BTC retracement planDon’t chase breakouts above $115K without confirmation—false signals are common in volatile crypto conditions.
Watch for volume spikes at key levels like $115K or near $117,800 for validation.
Use tight stop-losses given intraday volatility—it’s easy for sharp 1–2% swings in crypto.
Note that technical sentiment (RSI, MACD) remains neutral to slightly bearish across intraday and daily indicators .
Weekly trading plan for BitcoinBINANCE:BTCUSDT Price has shown recovery over the past 24 hours, but now faces a critical test at the weekly reversal level ($115,300). The inability to establish sustained footing above this level may trigger a deeper correction
Key Scenarios:
Bullish: Hold above $108K maintains ATH potential
Bearish: Failure to consolidate above $115.3K opens downside risk to 110k
Let the market confirm its direction first


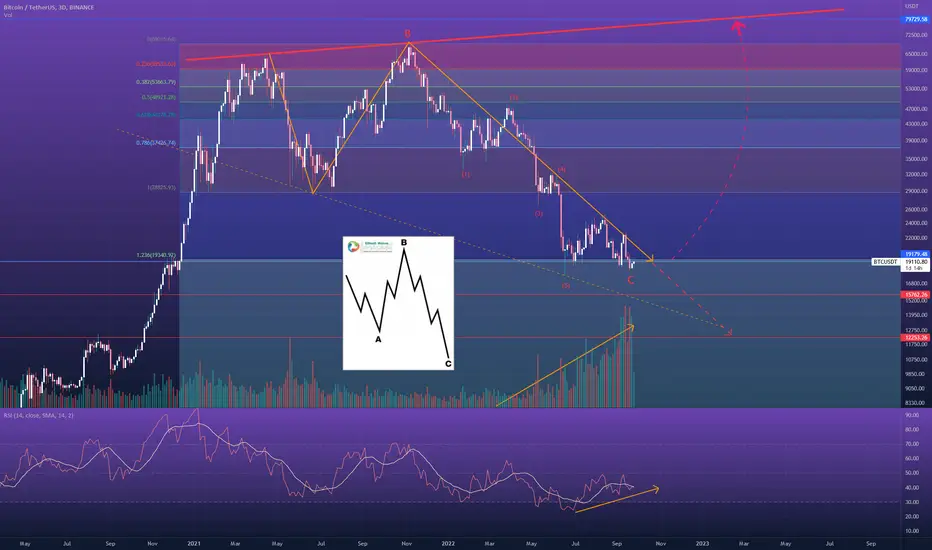
BTCUSDT Expanded Flat Correction may be overBear with me (pun intended). I know I'll probably get some slack from the 5 wave correction counting of wave C. Most people would place the 3rd wave in June instead of May, but a few things suggest me that the 3rd wave down was actually in May:
This C wave lies at the 123.6% extension of wave A which is a common area for the Expanded Flat correction.
Volume and RSI printing a divergence
2M RSI just broke out of its falling wedge
BTCUSDT resiliance at the 19k level, in contrast with the current equity price action & general sentiment, which goes against the previous sell offs of April and June
All of the above considered, there's still something missing : that the C wave should hold RSI divergence between wave 3 and 5 at completion, which did not happen with this counting. Also BTC would not only have be above the 19.3k resistance of the 123.6% extension of wave A (which is being rejected @ the moment) as it would also need to break & retest that yellow trendline (hands tied with the faster EMA's) that is holding its price down. But where is the fun in posting ideas when all of the cards are on the table? =D
All I'm saying is that this correction is closer to its ending than the other way around, and what I'm suggesting is that I wouldn't be surprised if it would be already over.
DYOR. Not advice
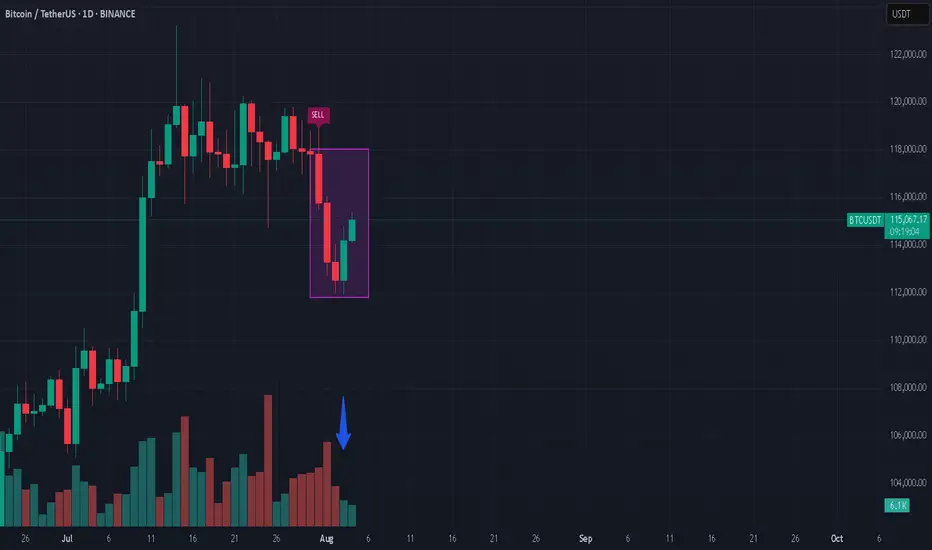
Shorting Bitcoin??Bitcoin had a huge drop, and suddenly shows strength? Well, in my opinion, if you look at the volume, there’s not much strength. I believe it’s going even lower in the short run.
*not investment advice
#bitcoin #crypto #trading
$BINANCE:BTCUSDT Needs a Clean Break Above $117,000The BINANCE:BTCUSDT pair has shown a mild bounce over the past 24 hours, now trading around $114,000. But zoom out, and the weekly performance still shows a nearly 4% dip, raising the question of whether this bounce has real legs or is just noise.
From a long-term holder perspective, on-chain selling pressure has been easing. Data from spent output bands shows that older wallets, particularly those holding BTC for 7–10 years, were active between July 23 and August 1.
However, the extent of selling was notably lower compared to the earlier July 10–19 stretch, when BINANCE:BTCUSDT dropped from $ 123,000 to $ 117,000. Even during this recent distribution phase, BTC managed to hold above $113,000, indicating strong market absorption and reduced overhead pressure.
Valuation-wise, the MVRV (Market Value to Realized Value) ratio currently sits at 2.19. Historically, this zone has acted as a reliable launchpad for Bitcoin rallies. Back in June, a similar reading of 2.16 preceded a move from $101,000 to $110,000. And in April, a 2.12 print led to a surge toward $119000. Right now, BINANCE:BTCUSDT sits in the same zone, supported by a quiet shift in trader sentiment. The long/short ratio flipped from a bearish 0.89 to 1.02, indicating more traders are finally betting on the upside.
From a price action standpoint, BINANCE:BTCUSDT needs to make a decisive move. It is currently holding above the 0.382 Fibonacci retracement level at $113,600. This level is derived from the June low of $ 98,000 to the all-time high of $ 123,000.
The next visible support levels sit at $111,900 and $110,000, while $107,000 remains the invalidation zone for any bullish thesis. However, the true pivot remains $ 117,000; a level marked by historical significance, volume clusters, and failed breakouts. Unless BINANCE:BTCUSDT clears and holds above $117,000, the broader uptrend remains vulnerable to yet another failed rally attempt.


Analytics: Market Outlook and Predictions
📈 WHAT HAPPENED?
Last week, US President Donald Trump once again "shook up" the financial markets.
The report published by the White House was received positively and contributed to the recovery of the Bitcoin price. But soon after, new import duties were introduced, which changed the short-term trend of the first cryptocurrency to a downward one. Unfortunately, no one is immune to FUD.
The local minimum was recorded at $112,000, after which the price rebounded slightly, but didn’t reach the key zone of $110,000-$107,000 (accumulated volumes).
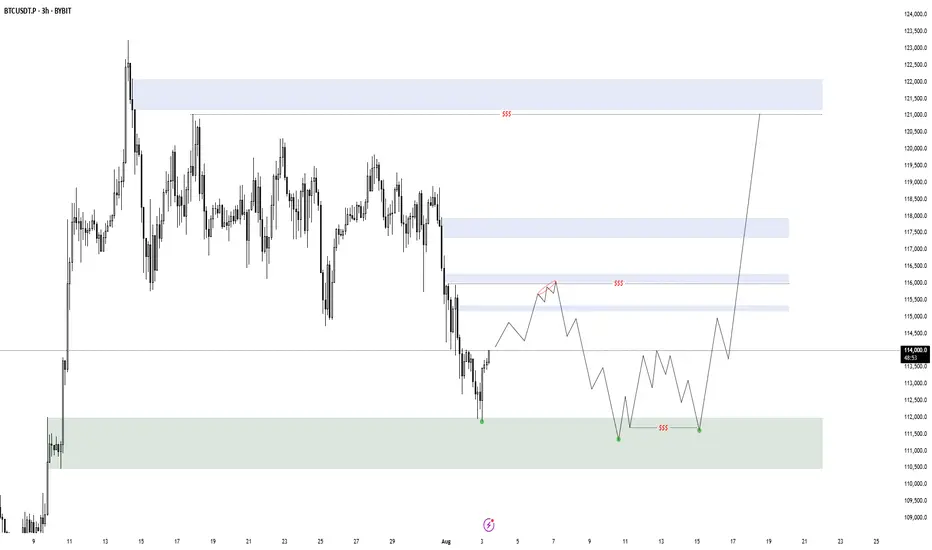
💼 WHAT WILL HAPPEN: OR NOT?
Currently, buyer activity remains weak, with significant volumes concentrated above the current price, and no active demand at the local lows. Another wave of sales is likely from the $115,000-$116,300 zone to the formed low of $112,000.
On the other hand, wave analysis shows the weakening of sellers. The market has already absorbed the last wave of sales, and there was a break on the hourly timeframe. With the growth of buying volumes, a rebound to the nearest volume resistance is possible. However, we’ll most likely not be able to do without strong sales, and we’re highly likely to see Bitcoin at $110,000.
Buy Zones:
$110,000–$107,000 (accumulated volume)
Sell Zones:
$117,600–$118,600 (accumulated volume)
$115,000–$116,300 (mirror volume zone)
📰 IMPORTANT DATES
Macroeconomic events that we’re following this week:
• Tuesday, August 5, 13:45 (UTC) — publication of the business activity index (PMI) in the US services sector for July;
• Tuesday, August 5, 14:00 (UTC) — publication of the US Non-Manufacturing Purchasing Managers' Index (ISM) for July;
• Thursday, August 7, 11:00 (UTC) — announcement of the UK interest rate decision for August;
• August 7, Thursday, 11:30 (UTC) — publication of the Bank of England's letter on UK inflation;
• August 7, Thursday, 12:30 (UTC) — publication of the number of initial jobless claims in the United States for August.
*This post is not a financial recommendation. Make decisions based on your own experience.
#analytics
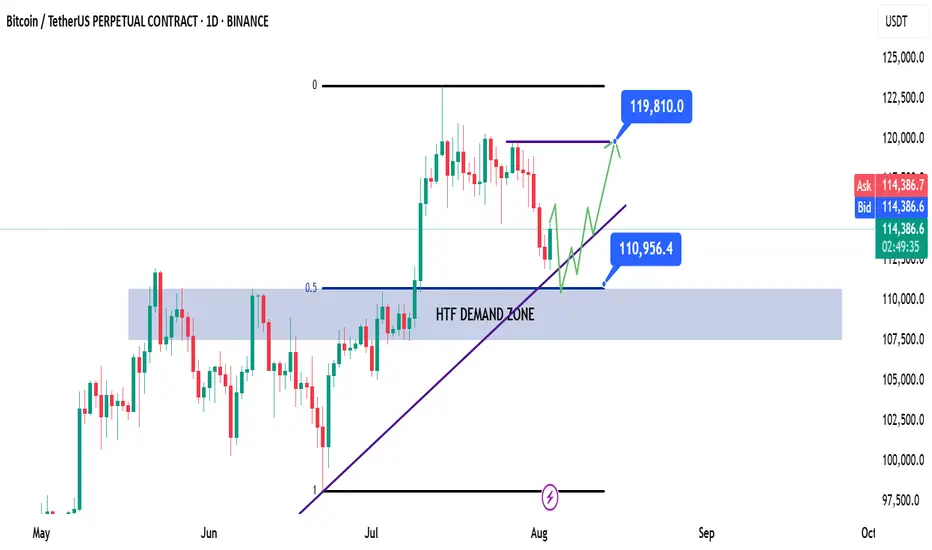
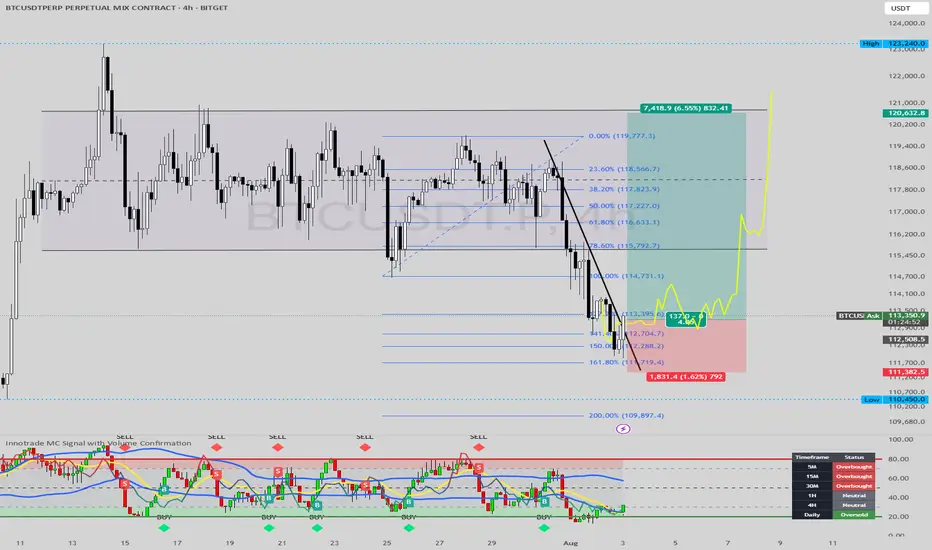
BTC | Bitcoin - Weekly Recap & Gameplan - 03/08/25📈 Market Context:
Traders are currently anticipating a potential 0.25% rate cut at the September FOMC meeting, which continues to support the broader bullish outlook.
While the market pulled back following weaker-than-expected Non-Farm Payroll data, overall sentiment remains optimistic.
Greed has cooled off into a more neutral stance. Historically, August often brings some consolidation or pullbacks — but the structural bias for Bitcoin remains bullish.
🧾 Weekly Recap:
• After printing new all-time highs, BTC began a healthy retracement.
• Price action closely mirrored the Nasdaq's (NQ) pullback during the week.
• We saw a small bounce mid-week, but no strong reversal confirmation yet.
📌 Technical Outlook & Game Plan:
→ I’m watching for price to revisit the long-term bullish trendline.
→ A slight deviation into the HTF demand zone would be ideal for long entries.
→ Bonus confluence: This area also aligns with the 0.5 Fibonacci retracement (Equilibrium level), providing a key discount zone.
🎯 Setup Trigger:
I’ll be watching for a confirmed bullish break of structure (BOS) on the 1H–4H timeframes to signal a reversal.
On confirmation, I’ll look to enter a swing long position.
📋 Trade Management:
• Stoploss: Below the 1H–4H demand swing low
• Take Profit:
→ I’ll trail stops and lock in profits aggressively
→ Main target: $119,820
💬 Like, follow, and comment if this breakdown supports your trading! More setups and market insights coming soon — stay connected!
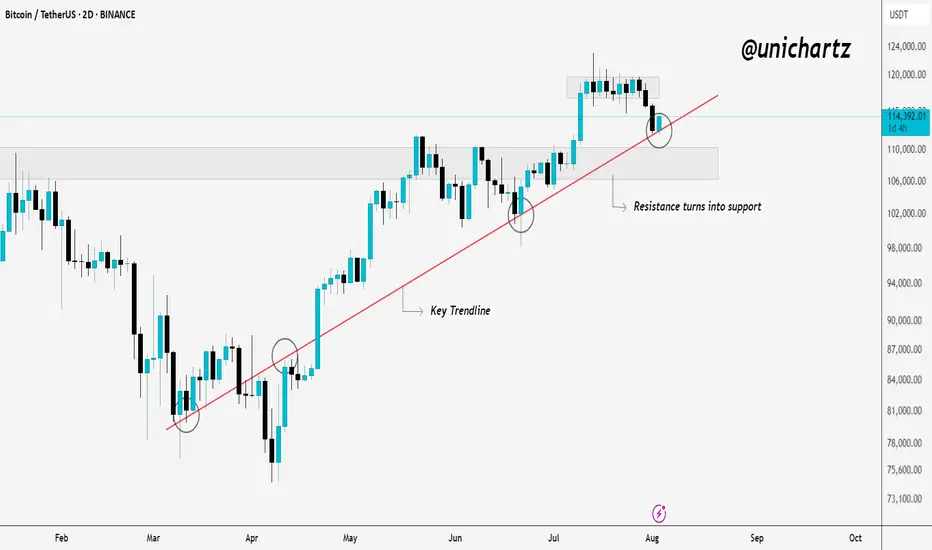
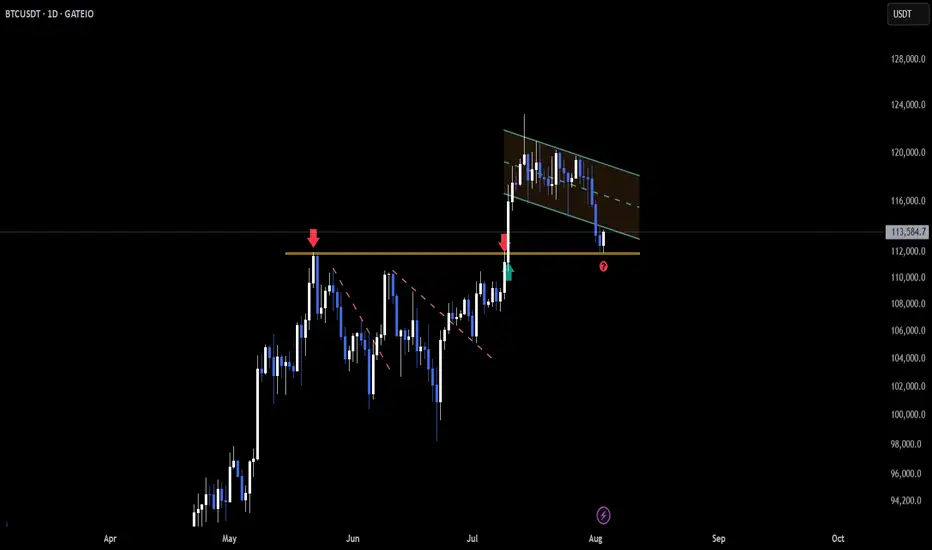
Smart Money Watching This Line — Are You?Bitcoin is holding strong above a key trendline that has acted as dynamic support since March. Every time price touched this line, buyers stepped in, and once again, it’s doing its job.
What was once resistance has now flipped into solid support. The recent pullback seems healthy, and the price is trying to bounce from the trendline area again.
As long as CRYPTOCAP:BTC respects this structure, the bullish momentum remains intact. If it holds, we could see another leg up from here.
DYOR, NFA
Thanks for reading!

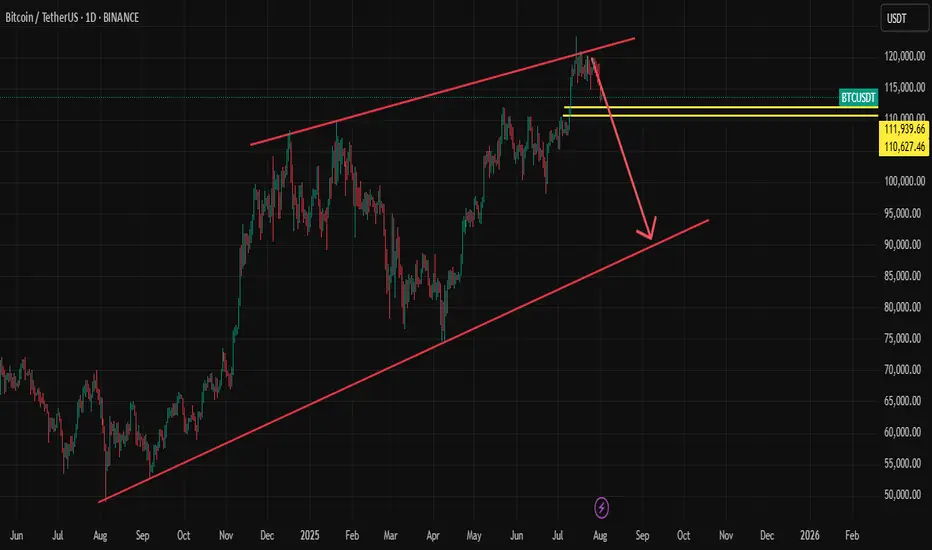
My bullish view on BTCIf we break upwards in this channel we will see 134k and/or 140k depending on the resistance on the trend lines!
BTC AccumulationI'm excited to see how this develops. Might be the first proper accumulation since april at the lows.
BTC/USDTWell, well, well, I see that Bitcoin has hit its main support. Those who bought and made profits can slowly exit.
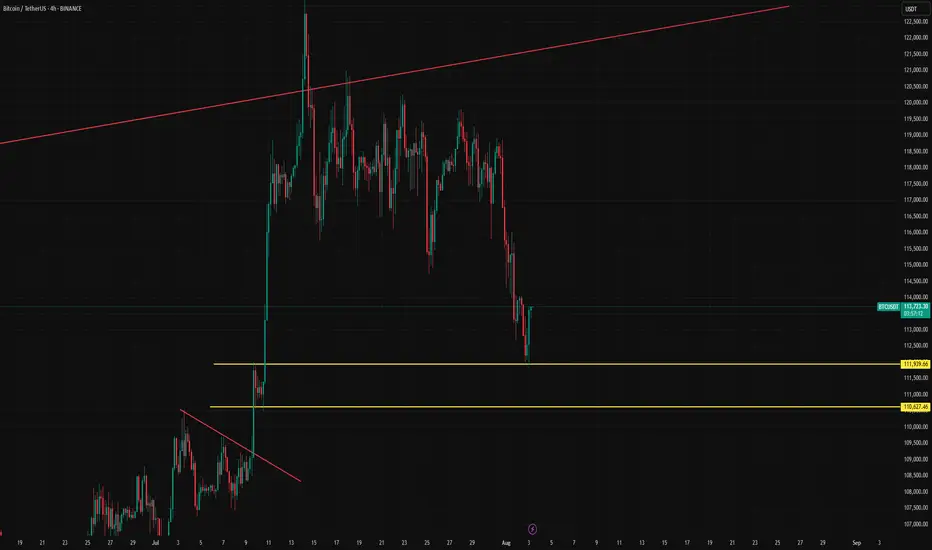
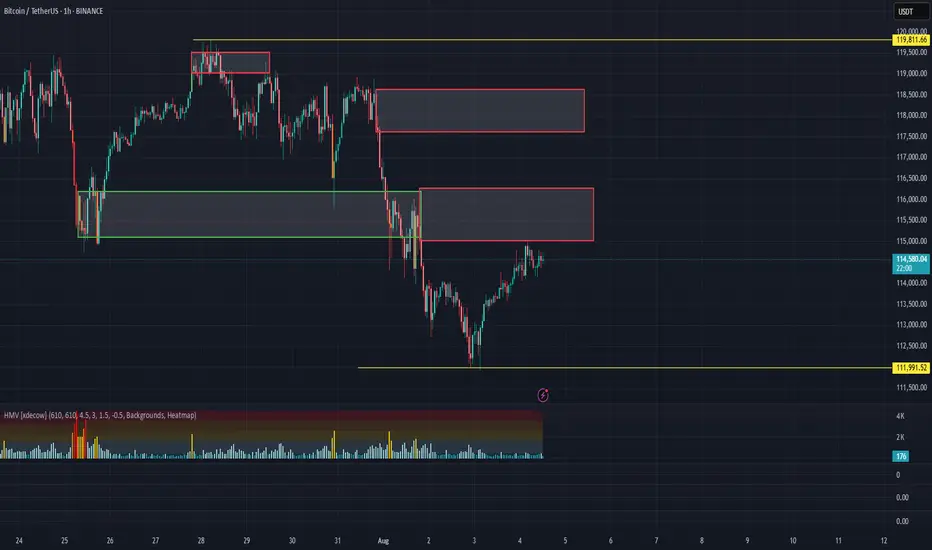
BTC Retests Broken Channel as Daily Support Holds📉 On the 4H chart, CRYPTOCAP:BTC has broken below its descending channel and is now testing the underside — a classic retest zone where bulls and bears collide 👀
📆 Meanwhile, the Daily timeframe shows price still holding above the key 11800 support level 🛡️
This zone remains pivotal — a bounce could reclaim momentum, while a failure might trigger deeper downside.
The next few candles will be critical for directional clarity.
Are we about to reclaim the structure or head lower from here?
Not financial advice.
mBos 15mWe came to 4h OB, swiped some liquidity and received a reaction. Expectations for the price to return back to the wick and continue up to take the liquidity there. As there is no break on the HTF, it is a trade with higher risk.
Entry on the test of 15m wick. Stop below wick. Take on the swim of EQH
BTC LONGAfter major pullback Bitcoin takes Support. Our Algo-based Indicators also showing their first BUY-Signal with Alert.
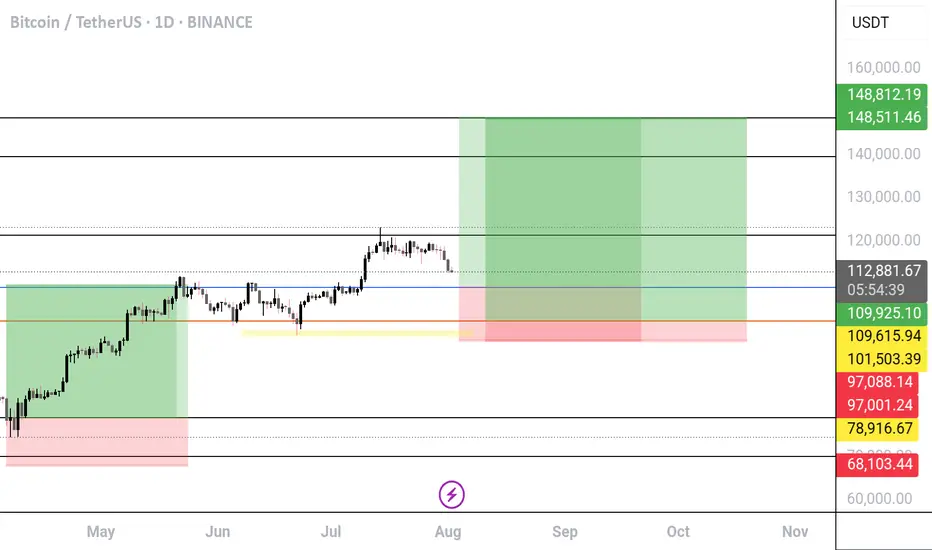
BTC/USDT Long Setup - Dual entry position
🟢 BTC/USDT Long Setup – Dual Entry Position
I’m going to be positioned long on BTC with two entries:
Entry 1: 109K if don't holds
Entry 2: 101k
Stop-loss: 97K
Target: 148.5K
R/R: ~5.4:1
Reasoning:
Market structure remains bullish with clean higher highs and higher lows.
The recent selloff is seen as a healthy pullback into a demand zone — not a trend reversal.
Both entries are placed to catch either a shallow bounce or a deeper liquidity sweep without overexposing risk.
Setup remains valid unless we see a clean daily close below 97K.
Letting price play out — no mid-range noise, no overtrading. Focused on structure, trend, and reward.
---
AUDIO Uptrand Soon ✏️ Use less funds 5% - 10%
💥 Wait & Get The Best Entry
🦊Pair : AUDIO/USDT 🟢
🐢 SPOT
🏎️ Buy :
♻️ 0.0555
♻️ 0.0540
🎉️Sell -
💵 0.0664
💵0.0779