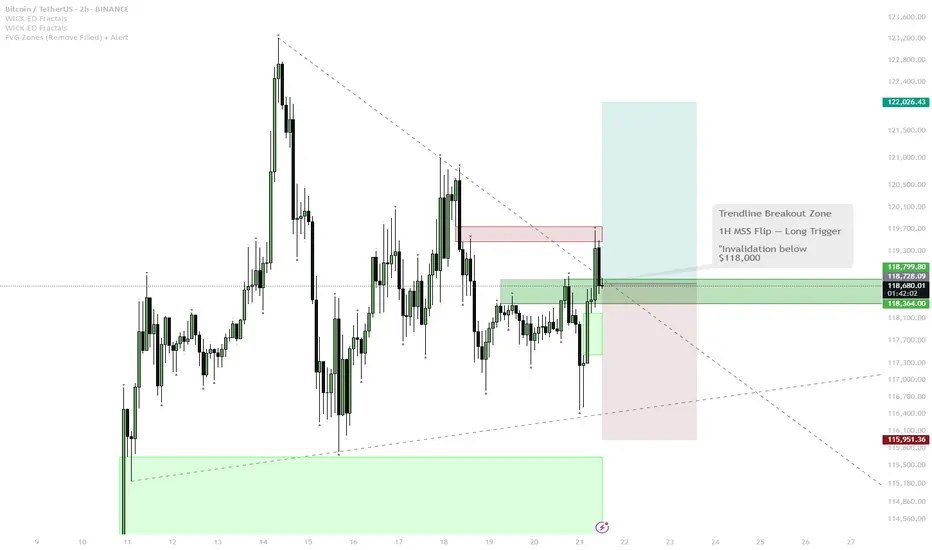
BTC Reloading for Breakout — Watching for 1H MSS Flip
BTC has bounced from local support (green zone) and is challenging the descending trendline.
The price is now testing the red resistance zone and the upper boundary of the 1H MSS (market structure shift) box.
Scenario A (Bullish):
— If BTC cleanly breaks the trendline and flips the 1H MSS box into support (with a strong close above), this is a trigger for a scalp long.
— Target for the move is the upper green box/previous high area near $122,000.
Scenario B (Bearish/Invalidation):
— If price is rejected at the red resistance and falls back below the green support box, risk of deeper pullback toward $116,000 increases.
BTC has shown resilience by quickly reclaiming support after a sweep lower, indicating strong demand. The market looks to be reloading for another push, with liquidity building up just below resistance. The setup favors a breakout if NY Open brings momentum. The flip of the 1H MSS box would confirm bullish intent. However, caution if the breakout fails — structure remains choppy and a failed breakout can trap late buyers.
BTCUSDT.5S trade ideas
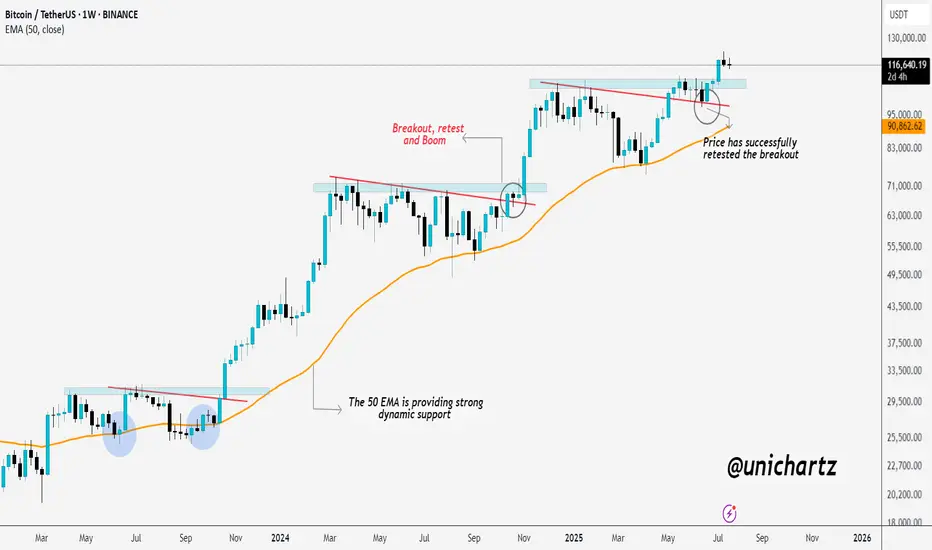
BTC Retested and Ready for the Next Leg Up?This CRYPTOCAP:BTC weekly chart shows a clean pattern of breakout → retest → rally.
The 50 EMA has been acting like a strong dynamic support throughout the uptrend, keeping the structure intact. Every time price broke out of a consolidation or resistance zone, it came back, retested it, and then continued moving higher.
Most recently, BTC broke above a key resistance, pulled back to retest it, and now it looks like the breakout has held. This is a classic bullish continuation setup, and historically, it’s led to strong follow-through moves.
As long as BTC stays above the 50 EMA and holds support, the bullish structure remains intact.
Thanks for reading! Stay sharp and trade safe.
demand and supply strategybuy opportunity setup on BTC
the buyers are taking control in the market and i believe its making a way for a buy opportunity
apply risk management and be safe

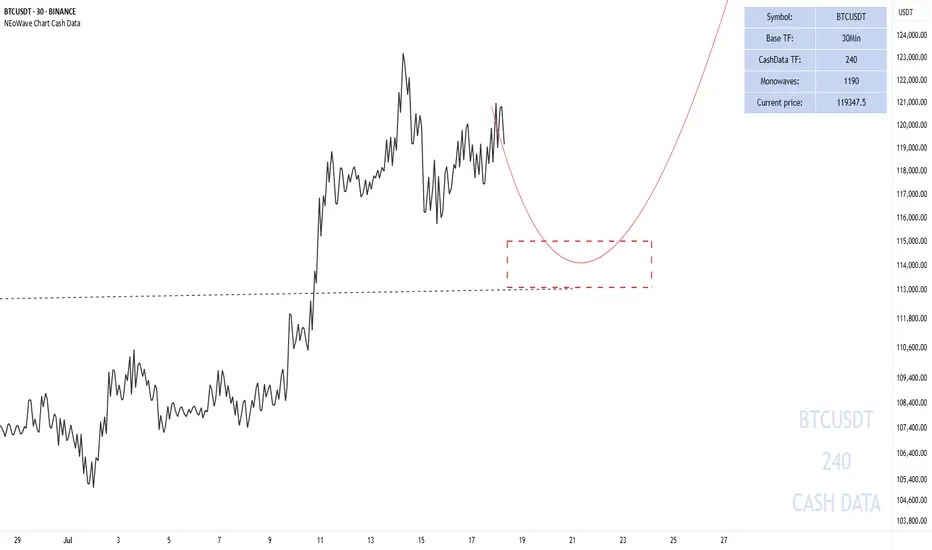
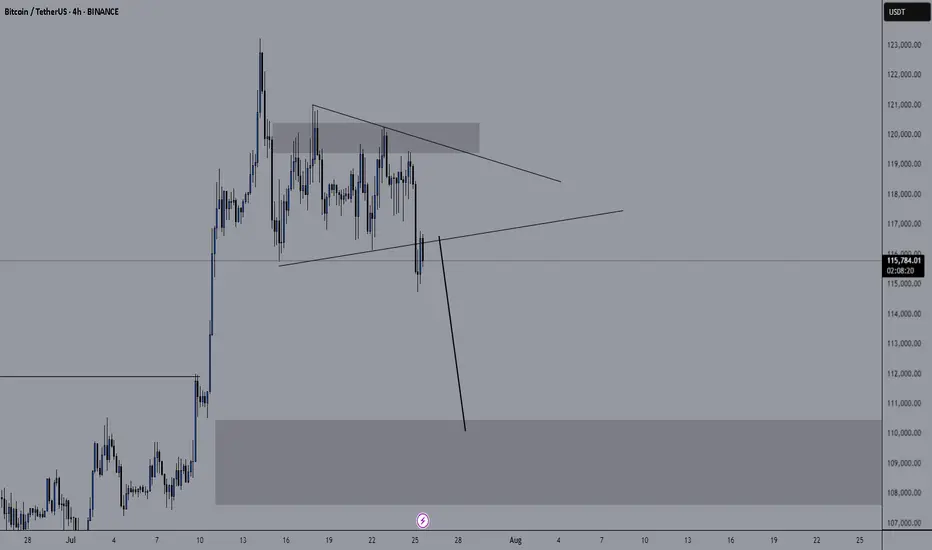
BTC update - July 25 2025After hitting 123,000 zone, Bitcoin has started a downward correction. For the past ten days BTC was mainly showing sideways movement until it crossed below the important support zone of 115,000.
As shown on BTC's chart (on the left), we can expect BTC to continue dropping towards 113,000 zone where there's a midterm trendline and also a fib level. Whether weak or strong, an upward reaction is expected when BTC reaches down there.
BTC CME chart (on the right) also shows there is an unfilled gap located in the 114,380 - 115,635 zone which is most probably going to get filled soon. please note that at the moment BTC CME futures price is about 1,000 dollars more than that of BTC so it is probably safe to assume that 114,000 level on CME Futures chart is equivalent to 113,000 level on BTC's chart.

5 Lessons from My First 100 TradesAfter executing and reviewing over 100 real trades in crypto, forex, and gold — I found patterns. Bad patterns. Repeating mistakes. And lessons I wish someone had told me earlier.
So I broke them down into 5 key insights that changed how I trade — and might just save you thousands.
📘 Here’s what’s inside:
1️⃣ Smart Profit-Taking:
How I turned 10 R/R into 32 R/R using a dynamic exit plan.
📘Further resource:
Cycle Mastery (HWC/MWC/LWC)
---
Multi-Timeframe Mastery
2️⃣ The Sleep Edge:
70% of my losing trades happened after bad sleep. Here’s why that matters more than emotions.
3️⃣ No More Blind Stop Orders:
Why I stopped using buy/sell stops without real candle confirmation — and what I do instead.
📘 Further reading:
Breakout Trading Mastery
---
Indecision Candle Strategy
4️⃣ Multi-Layered Setups Win:
How structure, S/R, patterns, and timing stack into high-probability entries.
5️⃣ News Trading? Just Don’t.
The data behind why most of my SLs were hit near news time — and how I avoid the trap.
💡 These aren’t theories. These are real lessons from real trades.
If this video helped you or sparked an “aha” moment, give it a boost, commenting your takeaway, and sharing it with a fellow trader.
lets grow together :)

Short-term BITCOIN analysisShor-term
In my opinion, Bitcoin could make a move towards $113,000-115,000 and then start moving upwards. In any case, according to previous analysis and apart from short-term fluctuations, it could touch the target of $140,000-150,000.
Good luck
NEoWave Chart
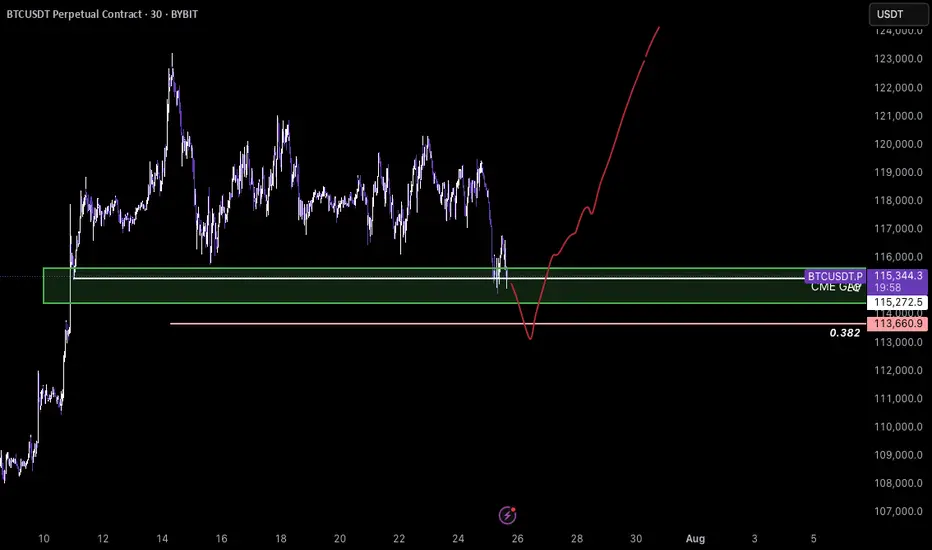
BTC- New ATH?BTCUSDT – Potential Reversal from CME Gap Support
Bitcoin is currently trading around a key demand zone aligned with a CME gap between ~$115,272 and $114,000. Price recently swept local lows with increased volatility and is showing signs of absorption just above the 0.382 Fibonacci retracement ($113,660), which adds confluence to the area.
If BTC continues to hold above this zone and shows volume confirmation, I expect a strong bullish reaction. This move could initiate a rally toward the previous high and potentially lead to a breakout to new all-time highs (ATH), as outlined in the red projected path.
Key levels- LQ, Fibbo 0.382, CME gap - futures
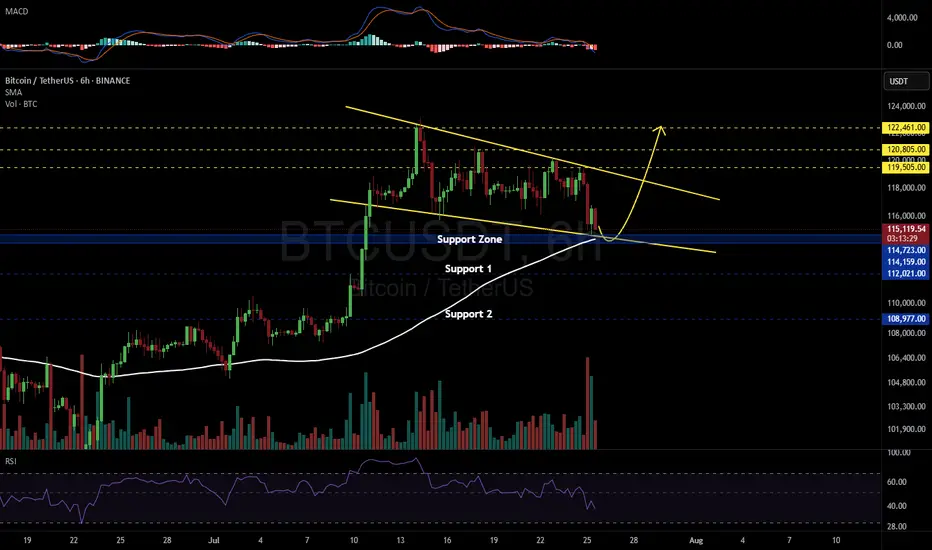
BTCUSDT 6H#BTC is currently working on filling the CME Gap between $115,635 – $114,060 in the Futures chart, as previously mentioned. On the 6H spot chart, a falling wedge has formed, and there's a high probability of a retest of the wedge’s support line.
This support line lies within the support zone at $114,723 – $114,159, and the 6H SMA100 adds another layer of confluence. A dip into this zone is normal and not a cause for concern.
📌 In case of a bounce and breakout above the wedge resistance, the next upside targets are:
🎯 $119,505
🎯 $120,805
🎯 $122,461
However, if the support zone breaks, the potential downside targets will be:
🔻 $112,021
🔻 $108,977
📉 According to the liquidity map, there’s a cluster of liquidity around $114,000, and a brief wick below it is likely. Be cautious with your entries and exits.
⚠️ As always, use a tight stop-loss and apply proper risk management.
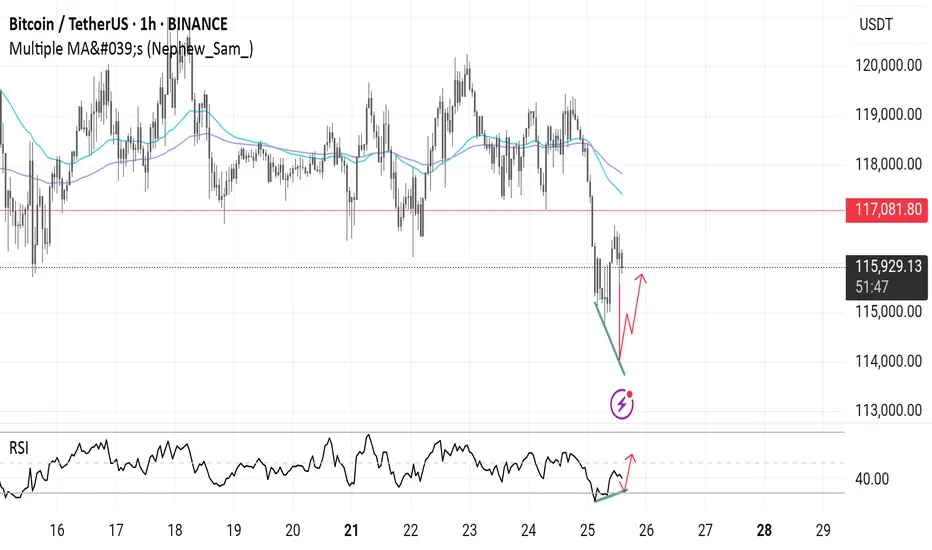
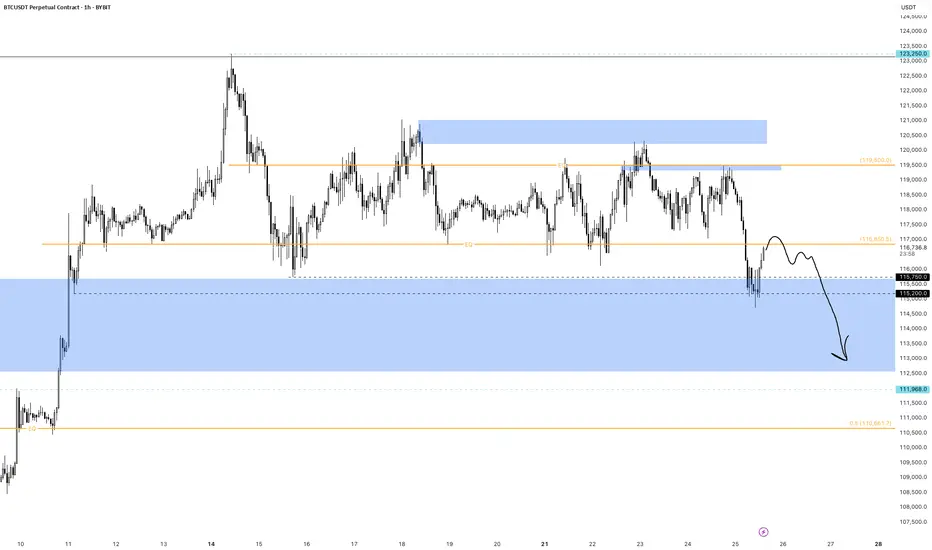
BTC/USDT Analysis. Range Breakout
Hello everyone! This is the daily analysis from a trader-analyst at CryptoRobotics.
Yesterday, Bitcoin bounced off a local sell zone on the 15-minute timeframe (previously mentioned), but a full-fledged bullish move did not follow. Instead, the less likely scenario played out — we broke the range to the downside and tested an important buy zone around ~$115,000 (zone of initiating volumes). Almost immediately, anomalies appeared in the cluster search near this level, and we quickly saw an initial rebound.
At the moment, a retest of ~$115,300 is likely. If buyers show proper reaction there, we could resume an upward move toward the $117,600–$119,200 area (accumulated volumes). To continue the long scenario toward the ATH, we need to consolidate within this area or break through it without a strong seller response — which is less likely.
A short scenario becomes possible if there is no buyer reaction around ~$115,300. In that case, a decline toward the next major support zone is expected.
Buy Zone:
$110,000–$107,000 (accumulated volumes)
Sell Zone:
$117,600–$119,200 (accumulated volumes)
This publication is not financial advice.
BTC dropping like a brick....bound to happen sooner or laterHard drops follow big spikes. Happens every time, just look back in time. But this time it's different? Maybe to some extent, but as long as there are short term profit takers and insane volatility this trend will continue. Only 2 cents is to not SHORT SELL. You will only contribute to the potential squeeze and will lose money. If you're up now, your priority should be to retain value and sell before it goes down to it's next support level which is under 100k! Maybe it does or not, but the dips do happen and with automated trading bots it could hit more aggressively and faster. If anything, but the dip when there's sufficient support. Best of luck!

Bitcoin is correcting ┆ HolderStatBINANCE:BTCUSDT compresses inside a triangle between $132K and $137K. Breakout above $137K could initiate a run toward $143K. Breakdown exposes $132K. Watch for decisive move.

Consider a sales transaction.Hello friends
You can open a sell trade on the 4-hour time frame, but this is a risky trade.
You can open a trade with half a percent risk.
On the higher time frame, the trend is still up.
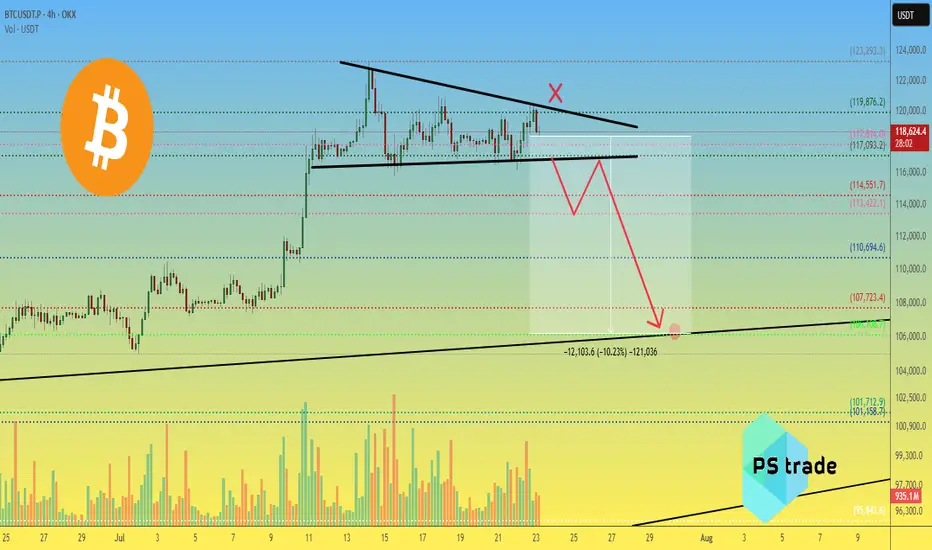
BTCusdt — Descending Triangle. Preparing for a BTC Breakdown?OKX:BTCUSDT chart (4H) shows a well-defined descending triangle.
Price is being compressed under a descending trendline, and volume is steadily declining — a typical signal of an upcoming strong move.
📉 Downside target: $106,100 – $101,700
🔺 Invalidation: breakout above $119,876
📊 Key levels:
Resistance: $117000 / $113,500
Support: $110,694 / $107,723 / $106,108 / $101,712
⚠️ Pay attention — breakout is likely soon.
_____________________
Did you like our analysis? Leave a comment, like, and follow to get more
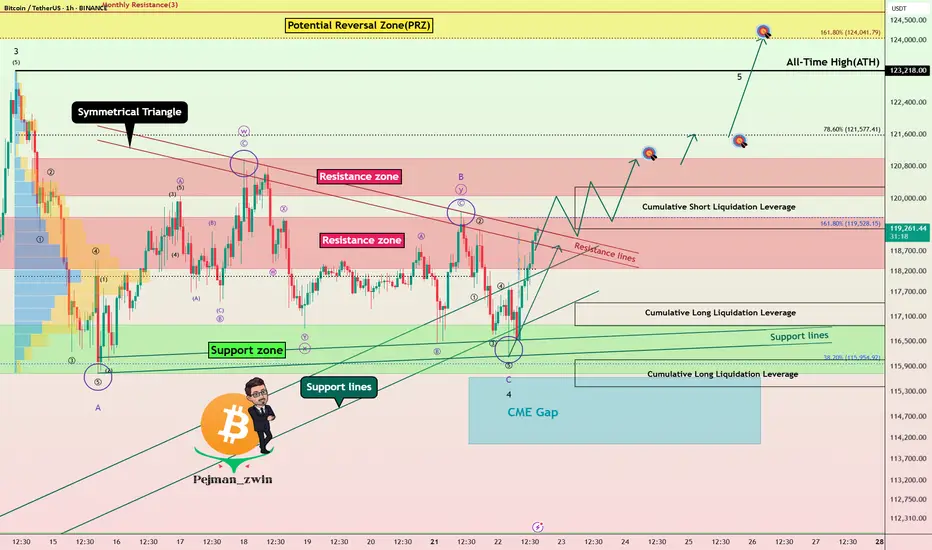
Powell’s Comments Could Decide BTC’s Fate: New ATH or Rejection!Bitcoin ( BINANCE:BTCUSDT ) has attacked the Support zone($116,900-$115,730) several times over the past week but failed to break through, meaning that buyers are still hoping for a BTC increase or even a new All-Time High(ATH) .
Bitcoin has reached a Resistance zone($119,530-$118,270) again and is trying to break the upper lines of the Symmetrical Triangle Pattern . The Cumulative Short Liquidation Leverage($117,255-$116,675) is important and includes high sell orders , so if Bitcoin can break the Resistance zone($119,530-$118,270) and the Resistance lines with high momentum , we can hope for a continuation of the upward trend.
Whether or not the Resistance zone($119,530-$118,270) and the Resistance lines break could depend on the tone of Jerome Powell’s speech today .
Jerome Powell will speak at the opening of the “ Integrated Review of the Capital Framework for Large Banks ” — the final major appearance before the Federal Reserve enters its pre-meeting blackout period.
Market Expectations:
The speech is officially about regulatory frameworks (like Basel III), but traders are watching closely for any hints regarding interest rate policy. Even indirect comments could move risk assets like BTC.
Rate Cut Signals?
With political pressure mounting (including criticism from Trump ) and markets pricing in a potential cut later this year, Powell may adopt a cautious, data-dependent tone emphasizing flexibility in decision-making.
--------------------
In terms of Elliott Wave theory , it seems that the wave structure of the main wave 4 correction is over. The main wave 4 has a Zigzag Correction(ABC/5-3-5) , so that the microwave B of the main wave 4 has a Double Three Correction(WXY) . Of course, the breakdown of the Resistance zone($119,530-$118,270) and Resistance lines can confirm the end of the main wave 4 .
Also, there is a possibility that the 5th wave will be a truncated wave because the momentum of the main wave 3 is high , and Bitcoin may NOT create a new ATH and the main wave 5 will complete below the main wave 3.
I expect Bitcoin to rise to at least the Resistance zone($121,000-$120,070) AFTER breaking the Resistance zone($119,530-$118,270) and Resistance lines .
Second Target: $121,620
Third Target: $123,820
Note: Stop Loss(SL)= $117,450
CME Gap: $115,060-$114,947
Cumulative Long Liquidation Leverage: $117,429-$116,878
Cumulative Long Liquidation Leverage: $116,053-$115,411
Please respect each other's ideas and express them politely if you agree or disagree.
Bitcoin Analyze (BTCUSDT), 1-hour time frame.
Be sure to follow the updated ideas.
Do not forget to put a Stop loss for your positions (For every position you want to open).
Please follow your strategy and updates; this is just my Idea, and I will gladly see your ideas in this post.
Please do not forget the ✅' like '✅ button 🙏😊 & Share it with your friends; thanks, and Trade safe.

Bearish retest or deviation for Bitcoin117000 is key. it’ll decide whether this is a bearish retest or just a deviation. i believe it’s a bearish retest and we’re setting up for 110-114 next.
last drop came when price kept failing to hold above EQ. now we’re below the EQ of the ath/previous ath range. if price can’t reclaim that either, a deeper drop is likely. a 12h close above EQ could open the path toward 120-121k, but that’s the less probable case in my view.
why? nasdaq and spx are in premium zones (fib extensions), and holidays are near for big players. as profit taking hits there, pressure will echo here. simple cause, predictable effect.
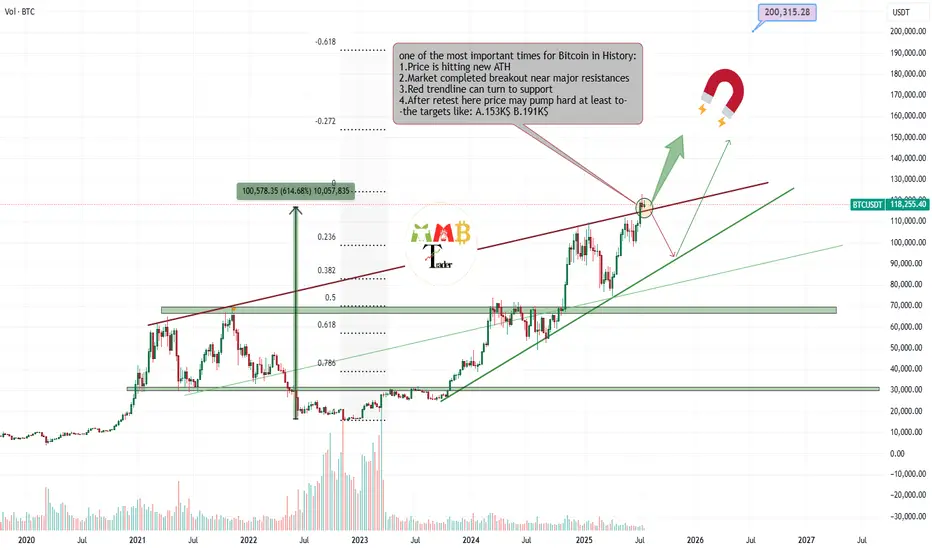
Bitcoin is retesting Critical zone for targeting almost 200K$Most traders around world now don't know what to do with their own trades or spot holdings, because some are in profit and how doubt of more pump and are still holding and some others miss this massive pump and think it can rest and fall now and it is not a good time to enter long.
And many other questions and thoughts At this time is simply check the chart and do these simple steps which are some mentioned and some not due to huge content.
Delete all of my previous drawings and start new Charting the price and see new trendlines or supports and resistances formed.
Then technically check the volume and breakouts and ... once again and here for Bitcoin i still find out chart looks extremely bullish to me and at this orange zone which is price is getting a little slow some important things may happen.
30% is expecting price fall below red trendline again and see short-term fall.
70% is expecting price complete retest of breakout here or pump more ASAP and then hitting targes like 150K$ and more for $BTCUSDT.
DISCLAIMER: ((trade based on your own decision))
<<press like👍 if you enjoy💚
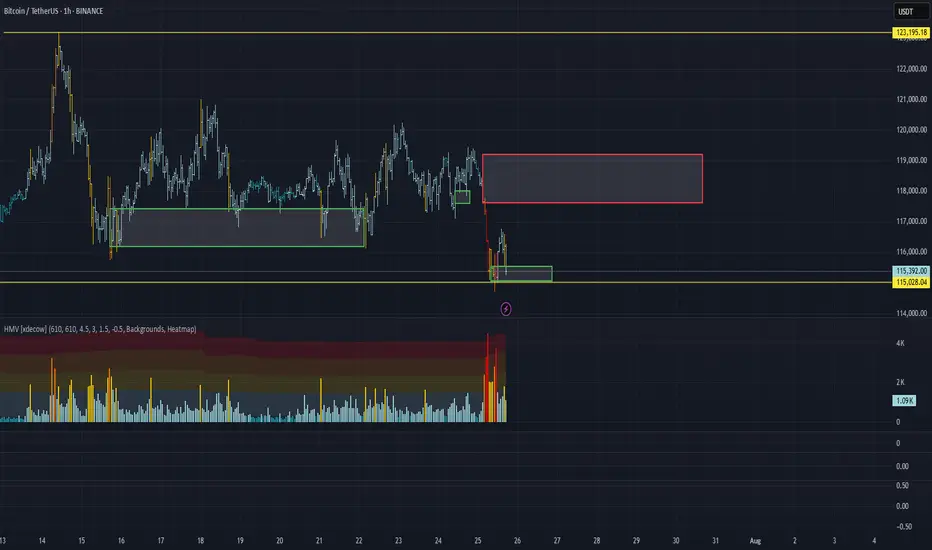
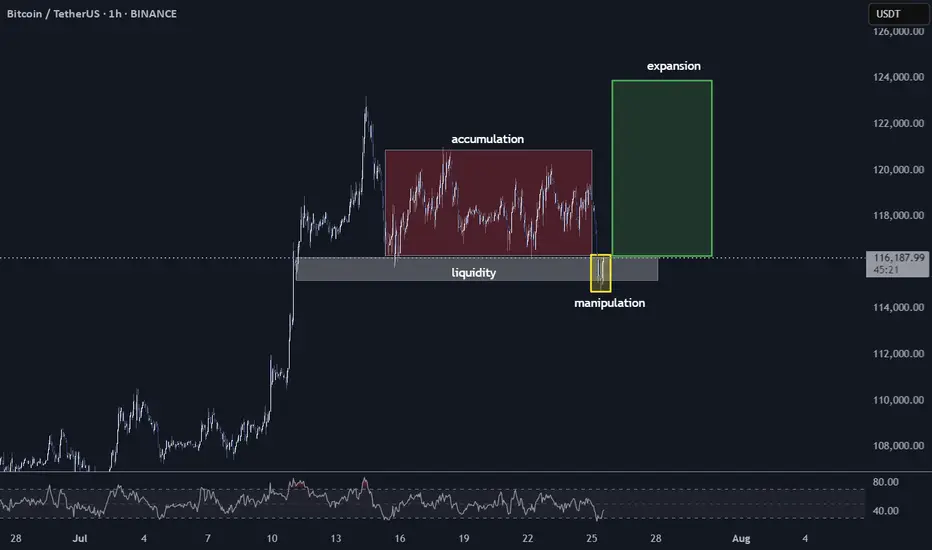
Bitcoin New ATH? A Classic Setup for ExpansionWe've just witnessed a textbook price action sequence unfold. After a period of what I've marked as 'accumulation' (that red box), where price consolidated, we saw exactly what we were looking for: the 'liquidity' below that range (the grey box) has been swept. That yellow bar clearly indicates the 'manipulation' phase, pushing below the perceived support to trap early longs and trigger stop-losses. This move has successfully taken out the easily accessible liquidity.
Now, with that essential 'clean-up' complete and the order books likely reset, the path of least resistance appears to be upwards. Furthermore, if you look down at the RSI, it's currently sitting in a relatively oversold or at least low position, providing additional confluence for a potential bullish move.
My current thesis is that we are now primed for an 'expansion' phase (the green box). The target here, based on this setup, is a retest of the All-Time Highs (ATH) and potentially beyond. We've seen this pattern play out before: accumulation, a liquidity grab/manipulation phase, and then a strong push higher. As always, manage your risk, but the charts are certainly hinting at significant upside potential from here.
BTC 4H Chart Uptrend
➡️ My wave count considers we're now in blue wave 4, and this corrections should finish soon.
➡️ The 125k round number is an interesting target for green wave III.
➡️ This scenario is valid as long as we stay above blue 1 top (at 110.529).

Bitcoin Btc usdt Daily analysis
Time frame daily
If btc can't break the green uptrend line strongly I guess it drops to 87$
But if btc can continue it's sharp way , my target is 170 $

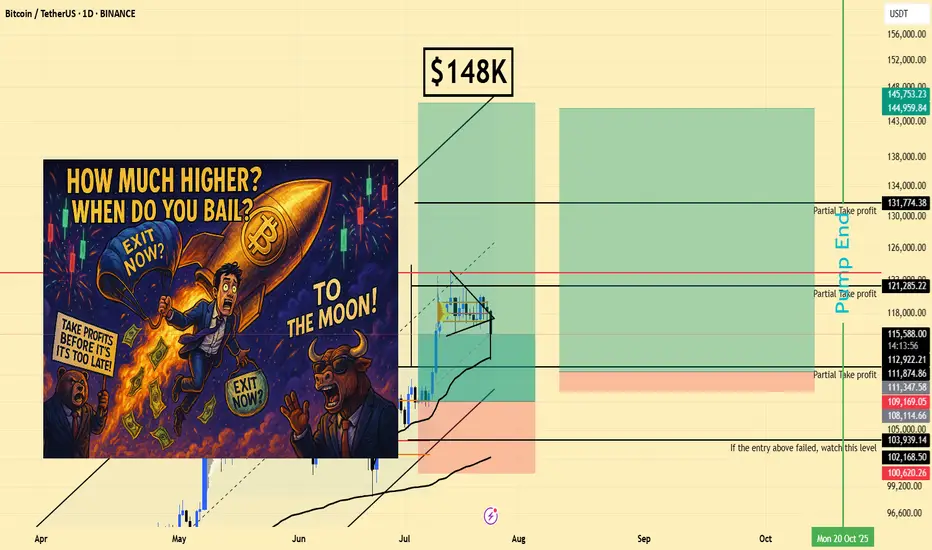
BTCUSD | Long | Volume Confirmation (Jul 25, 2025)BTCUSD | Long | Breakout Momentum & Volume Confirmation (Jul 25, 2025)
1️⃣ Quick Insight:
Bitcoin is showing strong bullish momentum after breaking out of its triangle pattern with volume. The move looks set to continue, and we may see higher levels if momentum holds.
2️⃣ Trade Parameters:
Bias: Long
Stop Loss: $109k (risk-adjusted "invisible" stop)
TP1: $121k (partial take profit)
TP2: $131k (final target if momentum extends)
3️⃣ Key Notes:
Short-term, price could test $96k before reaching higher targets.
Longer-term outlook points to potential upside between $112k–$120k if structure holds.
Watching reaction closely around the $109k area as it will determine if the uptrend stays intact.
I expect the pump phase to potentially wrap up around October 20, 2025.
S&P 500 is also at key levels, and its direction could influence Bitcoin’s momentum.
💬 What are your targets for Bitcoin? 140k? 180k? 240k? Drop your thoughts below!
"Please LIKE 👍, FOLLOW ✅, SHARE 🙌 and COMMENT ✍ if you enjoy this idea! Also share your ideas and charts in the comments section below! This is best way to keep it relevant, support us, keep the content here free and allow the idea to reach as many people as possible."
Disclaimer: This is not financial advice. Always do your own research. This content may include enhancements made using AI.
Understanding ROI in Crypto: More Than Just a NumberHello, Traders! 👏
Return on Investment (ROI) is often the first metric new investors focus on when evaluating an asset, a strategy, or even their trading performance. It’s easy to see why. It's simple, intuitive, and widely used across both traditional finance and the cryptocurrency sector. One formula, and suddenly you have a "score" for your investment. Green is good. Red is bad. Right?
Well…Not quite.
In the crypto market, where price swings can be extreme, timelines are compressed, and risk profiles differ significantly from those in traditional markets, a simplistic ROI figure can be dangerously misleading.
A 50% ROI on a meme coin might look great, until you realize the token is illiquid, unbacked, and you're the last one holding the bag. Conversely, a 10% ROI on a blue-chip crypto asset with strong fundamentals might be significantly more meaningful in risk-adjusted terms.
In this article, we'll delve beyond the basic formula and break down what ROI really tells you, how to use it correctly, and where it falls short. Let's go!
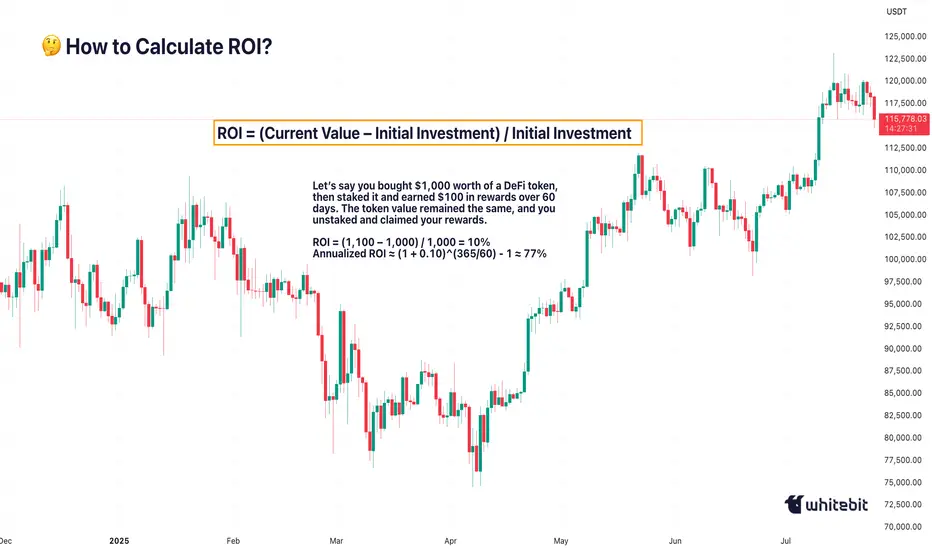
What Is ROI and How Do You Calculate It?
The Basic Formula for Return on Investment Is: ROI = (Current Value – Initial Investment) / Initial Investment.
Let’s say you bought ETH at $2,000 and sold it at $2,600: ROI = (2,600 – 2,000) / 2,000 = 0.3 → 30%. Seems straightforward. You made 30% profit. However, crypto is rarely straightforward.
What if you held it for 2 years? Or 2 days? What if gas fees, staking rewards, or exchange commissions altered your real costs or returns? Did you include opportunity cost and the profits missed by not holding another asset? ROI as a raw percentage is just the beginning. It’s a snapshot. However, in trading, we need motion pictures, full narratives that unfold over time and within context.
Why Time Matters (And ROI Ignores It)
One of the most dangerous omissions in ROI is time.
Imagine two trades: Trade A returns 20% in 6 months. Trade B returns 20% in 6 days.
Same ROI, very different implications. Time is capital. In crypto, it’s compressed capital — markets move fast, and holding a position longer often increases exposure to systemic or market risks.
That’s why serious traders consider Annualized ROI or utilize metrics like CAGR (Compound Annual Growth Rate) when comparing multi-asset strategies or evaluating long-term performance.
Example: Buying a Token, Earning a Yield
Let’s say you bought $1,000 worth of a DeFi token, then staked it and earned $100 in rewards over 60 days. The token value remained the same, and you unstaked and claimed your rewards.
ROI = (1,100 – 1,000) / 1,000 = 10%
Annualized ROI ≈ (1 + 0.10)^(365/60) - 1 ≈ 77%
Now that 10% looks very different when annualized. But is it sustainable? That brings us to the next point…
ROI Without Risk Analysis Is Useless
ROI is often treated like a performance badge. But without risk-adjusted context, it tells you nothing about how safe or smart the investment was. Would you rather: Gain 15% ROI on a stablecoin vault with low volatility, or Gain 30% ROI on a microcap meme token that could drop 90% tomorrow?
Traders use metrics such as the Sharpe Ratio (which measures returns versus volatility), Maximum Drawdown (the Peak-to-Trough Loss During a Trade), and Sortino Ratio (which measures returns versus downside risk). These offer a more complete picture of whether the return was worth the risk. ⚠️ High ROI isn’t impressive if your capital was at risk of total wipeout.
The Cost Side of the Equation
Beginners often ignore costs in their ROI math. But crypto isn’t free: Gas fees on Ethereum, trading commissions, slippage on low-liquidity assets, impermanent loss in LP tokens, maybe even tax obligations. Let’s say you made a 20% ROI on a trade, but you paid 3% in fees, 5% in taxes, and lost 2% in slippage. Your actual return is likely to be closer to 10% or less. Always subtract total costs from your gains before celebrating that ROI screenshot on X.
Final Thoughts: ROI Is a Tool, Not a Compass
ROI is beneficial, but not omniscient. It’s a speedometer, not a GPS. You can use it to reflect on past trades, model future ones, and communicate performance to others, but don’t treat it like gospel.
The real ROI of any strategy must also factor in time, risk, capital efficiency, emotional stability, and your long-term goals. Without those, you’re not investing. You’re gambling with better math. What do you think? 🤓