Cutting-edge Tech, Outperforming Traditional Tools Until now my AI has been defying market odds
The forecasts work on all timeframes, short, medium or long range
My AI is outperforming traditional tools, in real time, thats right...with real time validation
The question is, will the crown remain intact or be dethroned??
BTCUSDT.5S trade ideas

bitcoin, Stay heavy on positionsbitcoin, Stay heavy on positions
Short-term overbought is noise. Focus on the bigger picture. Keeping my position heavy—no plans to reduce yet

Bitcoin’s Epic Run from 80K to 120K: What’s Next for BTC?Yo traders, it’s Skeptic from Skeptic Lab! 🩵 Diving into Bitcoin’s wild ride from 80K to 120K—breaking down the key supports, resistances, and what’s next for BTC.
From the $76k bounce to smashing $110K, we’re eyeing the $120K PRZ. Will it correct or keep soaring? Check the video for the full scoop! Drop your thoughts or coin requests in the comments, boost if it vibes & Let’s grow together!

BTC Unfolds in Complex Way After Hitting 123KBTC Unfolds in Complex Way After Hitting 123K
Bitcoin recently reached a historic all-time high near 123,200, marking a strong bullish run. Over the past two weeks, BTC has been consolidating, showing signs of a potential upward movement.
However, today's price action disrupted that bullish setup and introduced bearish momentum.
At this moment, two scenarios are possible:
1️⃣ Continued Bullish Momentum: The prevailing trend remains strongly bullish. Selling BTC now is risky, as there's a high chance it could resume its aggressive rise again.
False Bearish Breakout: The recent bearish signal may be misleading. BTC may be forming a broader accumulation structure, paving the way for another upward move.
2️⃣ Profit-Taking Phase: This bearish shift might be valid, suggesting that Bitcoin is entering a profit-taking cycle after an extended rally. If this scenario unfolds, a deeper correction may follow, aligning with the current technical pattern.
You may find more details in the chart!
Thank you and Good Luck!
PS: Please support with a like or comment if you find this analysis useful for your trading day

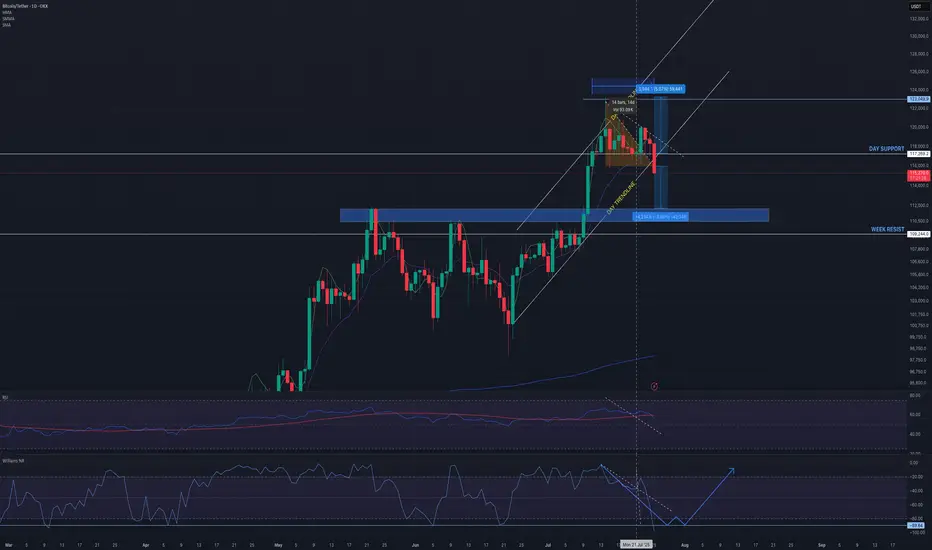
BTC is in a macro-uptrend but undergoing a healthy correction
Structure: BTC recently broke out from a local ascending wedge and is now pulling back toward support.
Current Price: ~$115,250 (at time of chart).
Day Support: ~117,000 (currently lost).
Next Key Support: ~109,244 (marked as WEEK RESIST, now potentially flipping to support).
Upside Target: 123,000 zone remains a key resistance, and aligns with projected measured move from wedge.
RSI: Just broke downward from overbought (divergence present). Currently ~59. A bearish signal in short-term momentum.
Williams %R: Deep in oversold, suggesting short-term bounce potential, but may be early.
200 SMA (blue): Holding well below current price — long-term uptrend remains intact.
Forecast Scenarios:
Base Case: BTC pulls back to 111K–109K, forms support, and continues the uptrend toward 123K.
Bullish Alt : If macro surprises (e.g., ETH ETF approval or FOMC dovish pivot), BTC reclaims 117K swiftly and rallies straight to 131K.
Bearish Risk: Break below 109K support, leading to retest of 98K (200 SMA area).
BTC USDT ANALYSIS CRYPTOCAP:BTC is currently correcting after a long bull ride and knowing your entry level as a trader is very important. Look at this chart and make informed decision

Volatility Period: July 24-26
Hello, traders.
If you "Follow", you can always get the latest information quickly.
Have a nice day today.
-------------------------------------
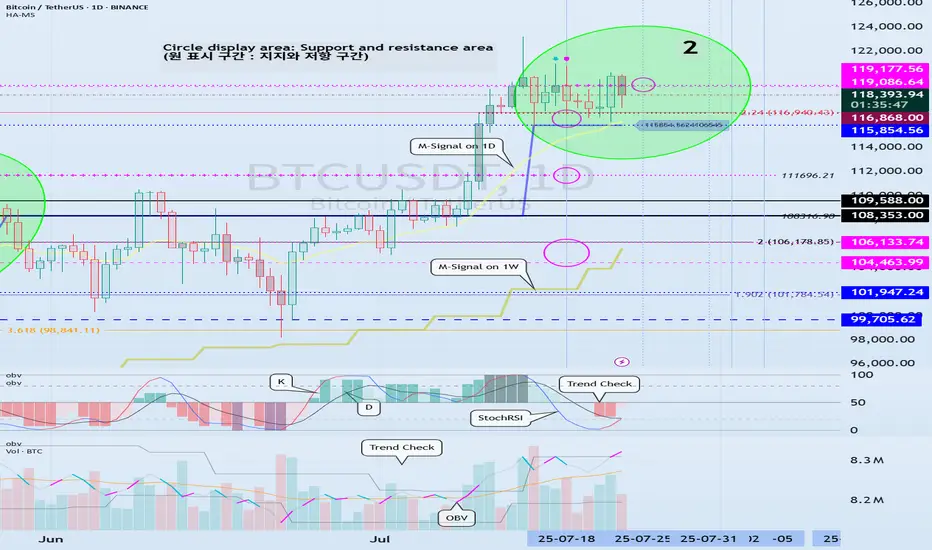
(BTCUSDT 1D chart)
BTC is in a step up trend.
Looking at the bigger picture, it can be seen that it is in the second step up trend.
The important volatility period in this step-up is expected to be around August 2-5 (up to August 1-6).
Therefore, we need to look at what kind of movement it makes as it passes through the previous volatility period of around July 25 (July 24-26) and around July 31 (July 30-August 1).
In other words, we need to check which section is supported and which section is resisted, and see if it breaks through that section.
What we can see now is that it is checking whether there is support in the 115854.56-119086.64 section, that is, the HA-High ~ DOM (60) section.
Since the M-Signal indicator on the 1D chart has risen to the 115854.56 point, the key is whether it can receive support at the 115854.56 point and rise.
If it falls below the M-Signal indicator of the 1D chart and shows resistance, it is likely to meet the M-Signal indicator of the 1W chart.
This flow is an interpretation of the separation learned when studying the price moving average.
Therefore, we can see that the maximum decline point is when it meets the M-Signal indicator of the 1M chart.
-
Industries (coins, tokens) that are renewing the ATH are actually outside the predictable range.
Therefore, we should think of it as a situation where it is not strange whether it falls or rises at any time and think of a response plan.
Since it is currently within the predictable range, we can create a response strategy by checking whether there is support in the 115854.56-119086.64 section.
However, as I mentioned earlier, the volatility period is about to begin, so caution is required when making new transactions.
That is, you need to check whether it breaks out of the 115854.56-119086.64 range during the volatility period that continues until July 26.
And if it breaks out, you need to check whether it is supported or resisted in that area and respond accordingly.
-
The OBV indicator of the Low Line ~ High Line channel is showing a pattern of rising above the High Line.
Accordingly, if the OBV indicator is maintained above the High Line, it is expected to show an additional rise.
In accordance with this, you need to check whether the K of the StochRSI indicator shows a movement to rise in the oversold range and a transition to a state where K > D.
You also need to check whether the TC (Trend Check) indicator continues its upward trend and can rise above the 0 point.
If these conditions are met, it is expected that BTC will rise above 119086.64 or show a pattern of rising.
-
This decline created a low trend line, creating a perfect rising channel.
Therefore, we need to see how far we can go up along the rising channel created this time.
In that sense, we should pay close attention to the movement during the volatility period around July 25th (July 24-26).
-
Thank you for reading to the end.
I hope you have a successful trade.
--------------------------------------------------
- This is an explanation of the big picture.
(3-year bull market, 1-year bear market pattern)
I will explain more details when the bear market starts.
------------------------------------------------------
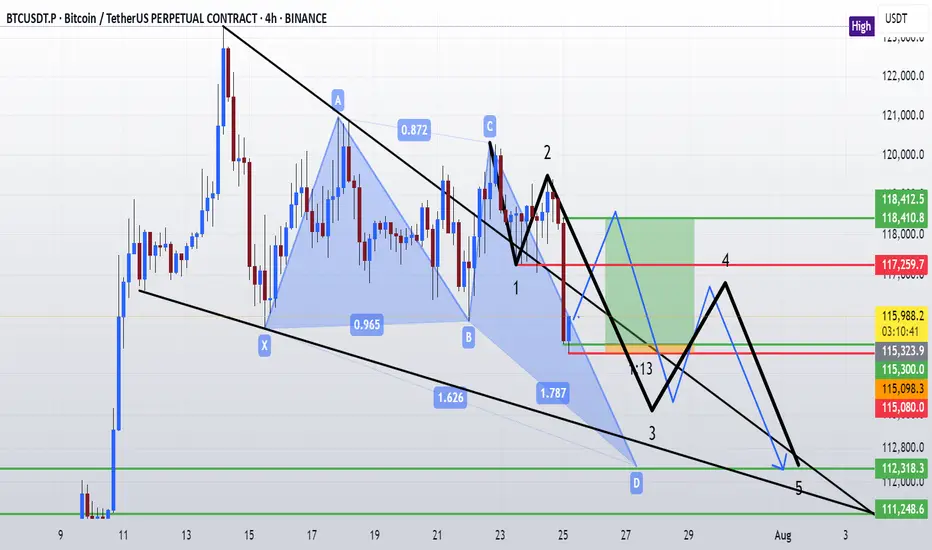
Btc 4hr time frame forward test3 possible scenarios,
Scenario 1 (Red): If it bounces at 1.272 and fails to break the previous high, a more bearish move is possible.
Scenario 2 (Green): This scenario involves a bounce at 1.272 and consolidation above the previous high.
Scenario 3 (Orange): This is a continuation of the bearish breakdown.
General Notes: All bounce points (indicated by the "yellow line") show a gap-up move (SMC entry area). TP3 is a good entry area, considering all confluences.

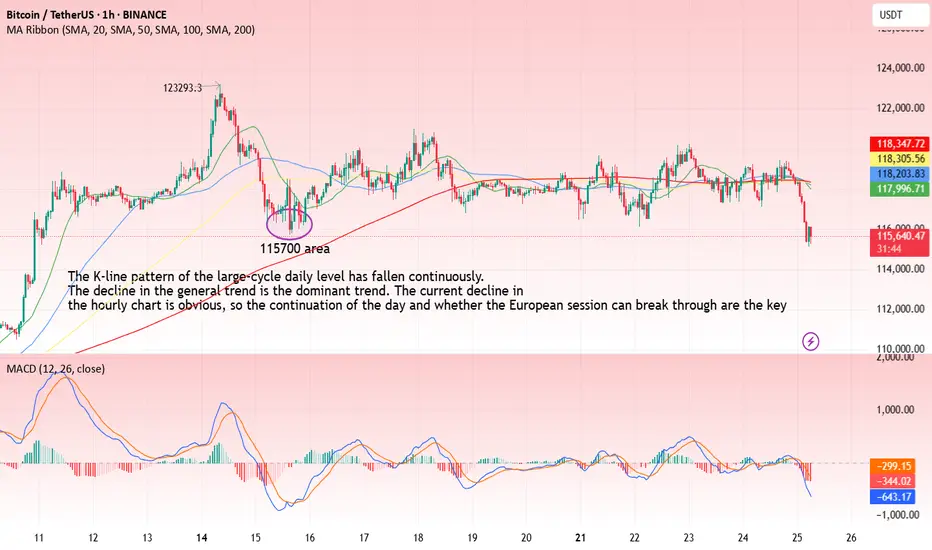
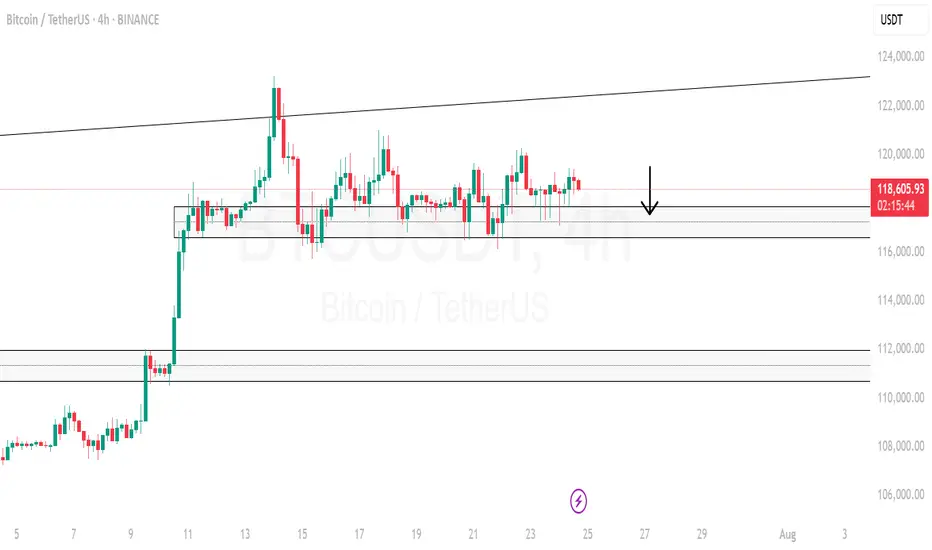
BTC-----Sell around 118000, target 116500 areaTechnical analysis of BTC contract on July 25:
Today, the large-cycle daily level closed with a small negative line yesterday, and the K-line pattern continued to fall. Although the price is at a high level, the attached indicator is dead cross. The current big trend is falling. From the overall trend and the trend law, the pullback is not strong. Instead of breaking the high, the decline is strong and continuous. Then the trend is also slowly changing. The key support position below is 115700 area, which is the position to pay attention to today and next week; the short-cycle hourly chart currently has a continuous negative K-line pattern, the price is below the moving average, and the attached indicator is dead cross. The continuation of the intraday decline is a high probability trend, and whether the European session can continue to break the previous low is the key. The current short-term resistance position is in the 118000 area.
Today's BTC short-term contract trading strategy:
Sell at the 118000 area of the pullback, stop loss at the 1118500 area, and target the 116500 area;
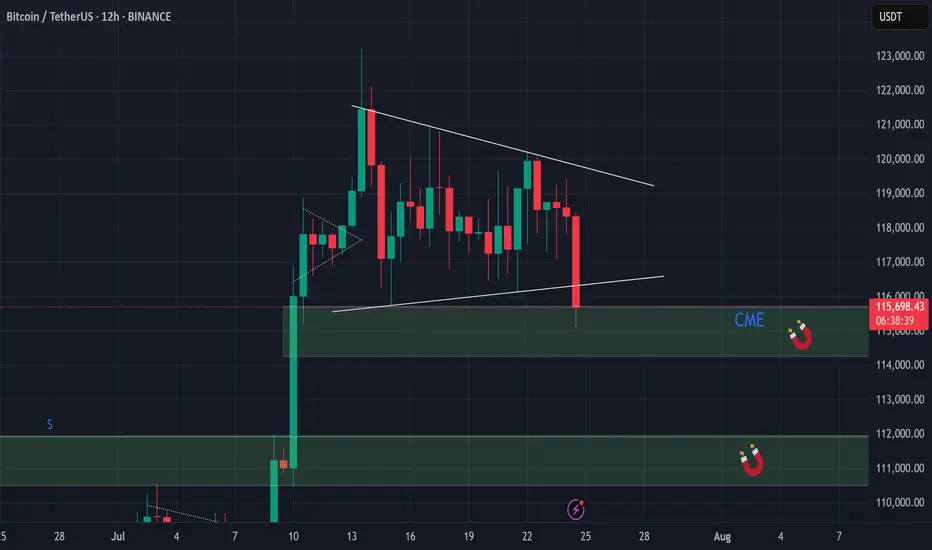
BTC - shake out!BTC Correction 📉
After observing the recent price action, it now seems clear that the inevitable correction is taking the stage.
I revisited the chart and drew potential bullish trendlines for a bull pennant on the 12h timeframe, but even those appear to be breaking down, confirming that we're currently experiencing a clear shakeout/correction.
I'm now expecting at least a full fill of the CME gap, and potentially even a drop toward $112,000.
Keep in mind that the CME price often lags behind spot prices on other exchanges, so in order to properly fill the gap down to $114,000 , a dip toward the $112,000 zone remains a very realistic scenario.
Take note that a lot of new retail investors are coming in recently by all the sounds of a ‘’possible altseason’’ around the corner, especially during the summer holidays when they have more time on their hands to look deeper into this.
all this in combination with a lot of long positions around and beneath the price range of 114k and 116k I expect a shake out and liquidity grab.
The only bullish short-term possibility that remains would be if this turns out to be a massive fakeout from the pennant structure, but I find that unlikely.
Personally, I’m watching for signs of a bottom sometime next week before looking for new upward momentum.
The BTC.D began a dive towards 60%, still: BTC remains dominant, which strongly impacts altcoins.
That’s why I’m currently staying cautious and holding off on entering new trades till we see clear support.
Let’s reach the summit together!
📝 Note
I'm currently building a portfolio of crypto analyses here on TradingView. Your feedback, tips, or validation are greatly appreciated, especially as I continue developing this skill further!
BITCOIN IS CREATING A SECRET PATTERN! (Huge move incoming?!)Yello paradisers! I'm describing to you what's going on with Bitcoin right now. We are creating a secret pattern that is forming, and once its neckline is reclaimed, we are going to have a huge movement.
In this video, I'm sharing with you the most important support and resistances on multiple time frames. We are describing Elliott wave theory wave count, and taking a look at candlestick patterns. We are talking about confirmations necessary for bullish and bearish cases. I'm explaining to you what the professional trading signals need for long-term profitability.
Some of the points are great risk-reward ratios. I'm talking about that in the video. One of them is taking only the highest probability trade setups, and having the patience and discipline to wait for them.
I'm talking about proper strategy which is needed, and systemology in your overall trading and how important it is. Here on TradingView, I'm describing to you the overall bias I have on Bitcoin right now.
Don't be a gambler. Don't try to get rich quick. Make sure that your trading is professionally based on proper strategies and trade tactics.

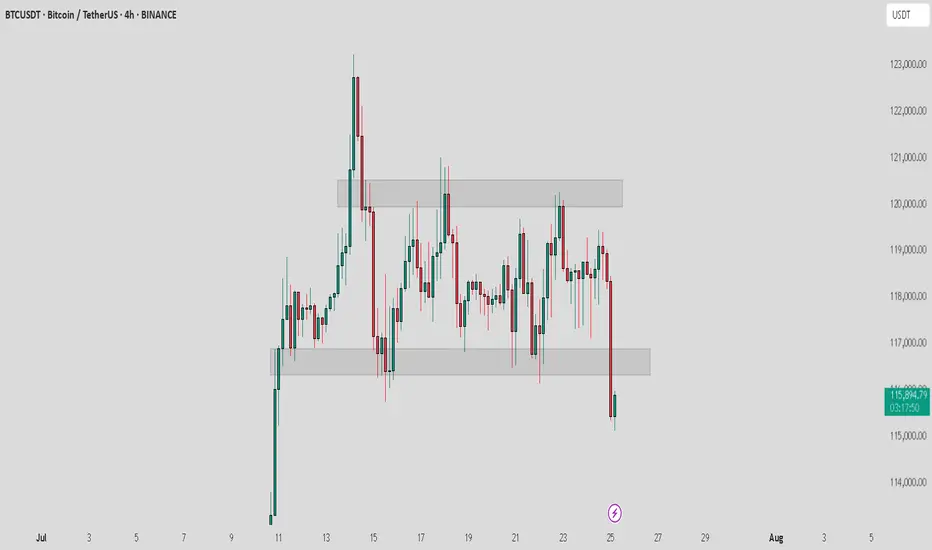
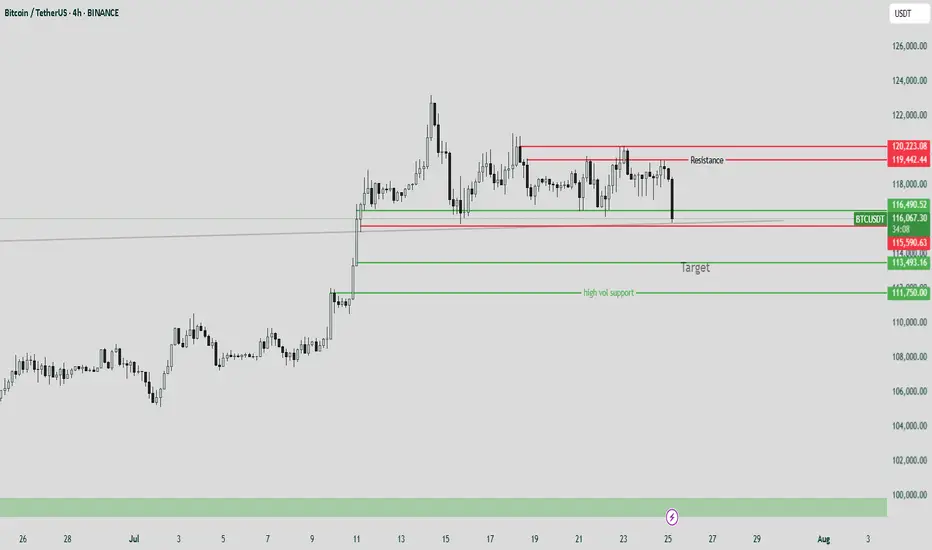
BTC / USDT : Broke down and now going for retestBitcoin Analysis:
Bitcoin has broken down and is now retesting the support zone. As mentioned earlier, a shakeout can happen at any time, and this looks like the potential retest phase.
Bullish Scenario:
Reclaims Resistance: If BTC manages to break through the resistance after the retest, it will stabilize for the short term. This could lead to a move towards higher levels.
Bearish Scenario:
Failure to Break Resistance: If the retest fails and BTC can't reclaim the resistance, further downside could be expected.
Targets: Keep an eye on the CME gap at $114,000 and 92K as key levels to watch for potential price action.
Note:
Manage your risk carefully. The market is volatile, and a shakeout could happen anytime. If BTC fails to break resistance after retest, more pain may be ahead.
Bitcoin possible bounce setupsThis is the only ideal long setups for bitcoin right now to keep bullish momentums
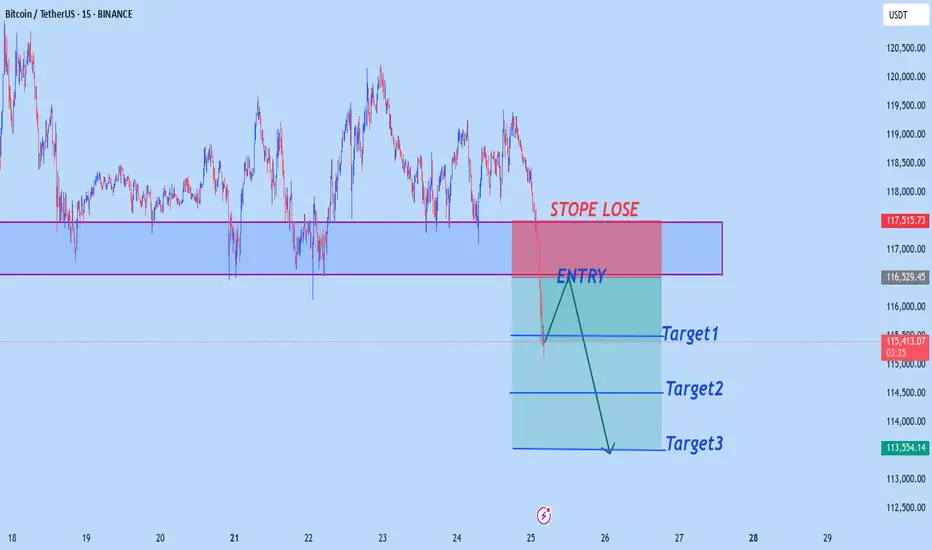
BTCUSD M15 OUTLOOKBtcusd sell from 116,500
target1 115,500
target2 114,500
target3 113,500
Stope Lose 117,500
Trade at your own risk
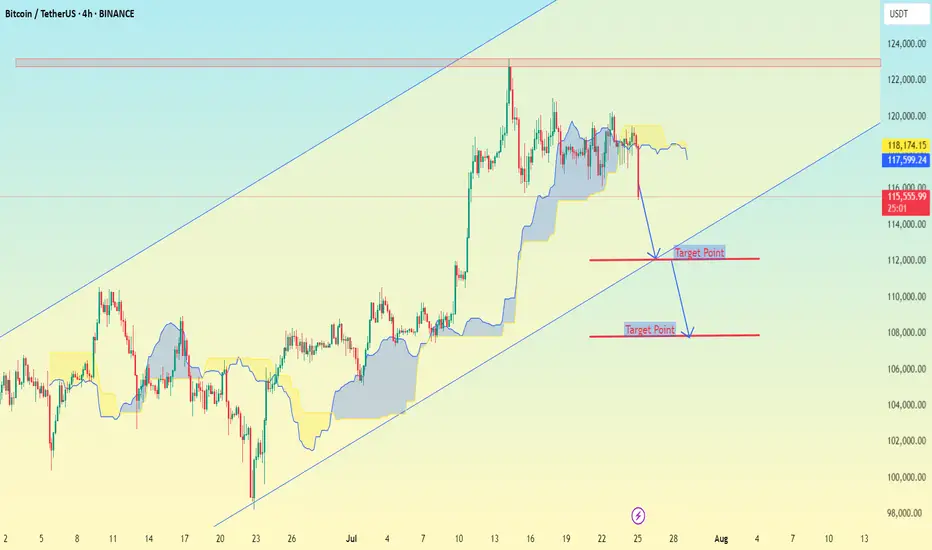
SHORT TERM BEARISH TARGETS ON THE H4 TIMEFRAME on THE BTCUSD, here are the downside target levels (short-term bearish targets) for BTC/USDT:
🎯 Target Levels:
1. Target Point 1:
112,000 USDT
This is a minor support zone where a temporary bounce or consolidation could occur.
It aligns with previous price action support and is near the lower Ichimoku edge.
2. Target Point 2:
106,000 USDT
This is a major support level near the lower boundary of the ascending channel.
If price breaks below Target 1 decisively, this becomes the high-probability target.
BTC SHORT IDEA114500 is TP1
113 is TP2
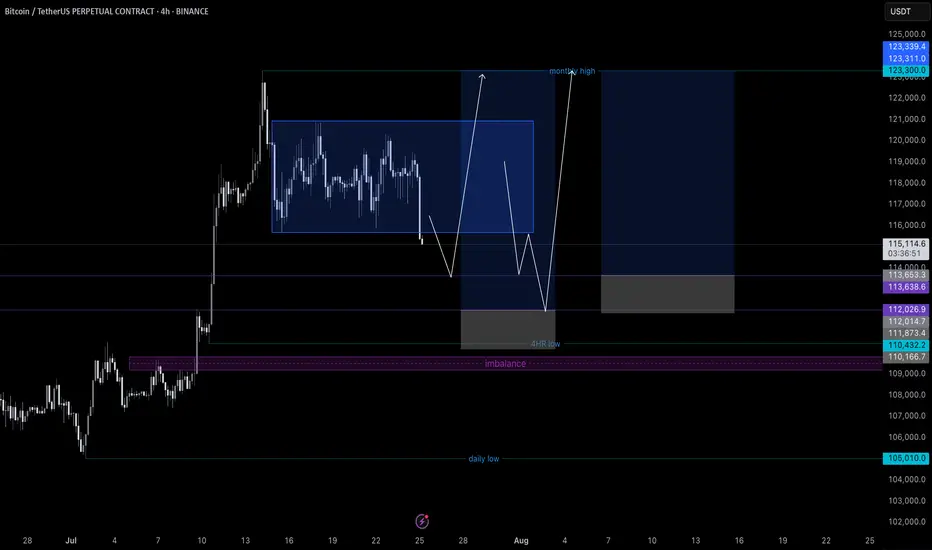
BTC is in Price Discovery Mode...
New ATH was created recently.
500M Shorts were Liquidated at 122k Region.
All the dips are healthy.
BTC - Nuke down to 104k?Hahhaa noo, but payttern shall commence in orange for a good move altogether!

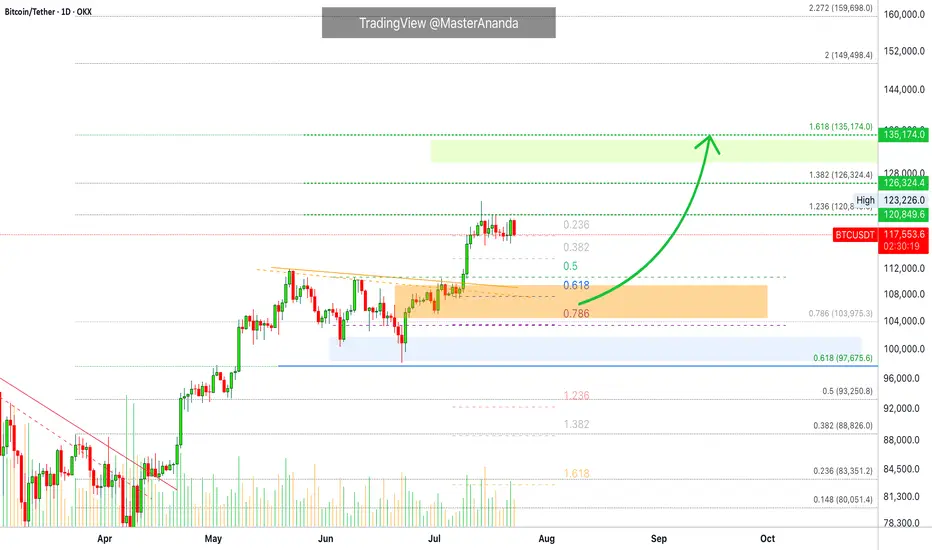
What's The Lowest Bitcoin Can Go? (Top Altcoins Choice —Comment)Bitcoin just hit a new all-time high recently and is consolidating just below resistance. I have a question: How far down can Bitcoin go on a sudden retrace?
That's a great question. Assuming that Bitcoin will continue growing mid-term and long-term, we can expect some more consolidation before higher prices. A retrace is not mandatory but is possible. A correction is almost impossible; low probability; not likely.
The worst case scenario Bitcoin does go down and the action should stop right at the previous high. Resistance turned support. That is, $112,000 to $110,000 would the first and main support range. Harder for Bitcoin to move much lower but these levels are not active yet.
If Bitcoin were to produce an extreme shakeout before additional growth, I would say the worst possible would be a touch of $104,000, but this is still a low probability setup. The chances are that Bitcoin will continue sideways while the altcoins grow. The fact that the altcoins are bullish means that Bitcoin will resume growing in due time. The next major move is another advance exceeding $130,000. It can happen within weeks or next month.
Patience is key on Bitcoin, the altcoins need to catch up.
Sometimes, Bitcoin can go sideways for months wile the altcoins grow. Prepare to wait or switch yourself to some mid-sized and small-cap altcoins. The big pairs tend to move like Bitcoin. Each chart needs to be considered individually.
Thanks a lot for your support.
Feel free to leave a comment with your favorite altcoin for an update. I will do an analysis for you in the comments section below.
Namaste.
BITCOIN Indicates Consolidating Moves Before StronBitcoin (BTC) Market Analysis Report
Summary and Conclusion
Bitcoin (BTC) is currently trading around $117,000 to $118,000, showing a slight pullback from its recent all-time high near $123,000. The market sentiment is moderately bullish but cautious, with technical indicators signaling some overbought conditions and short-term consolidation. Institutional interest appears to be cooling off slightly, as evidenced by recent outflows from Bitcoin ETFs, while accumulation continues across various investor tiers, including whales and retail holders.
Key resistance is near $119,400-$120,000, and support lies around $117,200-$116,900. The market is in a "perfect accumulation" phase, with strong buying support despite some profit-taking. The Fear & Greed Index is at 70, indicating greed but not extreme euphoria.
Recent news highlights a mixed picture: Bitcoin remains dominant and stable, but altcoins are gaining some momentum. Institutional flows are shifting somewhat from Bitcoin to Ethereum and other altcoins. Experts predict potential for Bitcoin to reach $200,000 to $250,000 later this year, driven by macroeconomic factors like credit expansion and fiat inflation.
Detailed Analysis
1. Price and Market Data
Market Type Last Price (USD) 24h Change 24h High 24h Low 24h Volume (USD) Funding Rate (Contract)
Spot 116,959.8 -1.65% 119,498.4 116,946.6 1.43B N/A
Contract 116,962.7 -1.65% 119,492.9 116,935.5 8.91B 0.0001
Bitcoin is consolidating below $120,000 after reaching a peak of $123,218 on July 14.
Trading volume remains robust, indicating active market participation.
2. Technical Indicators
Bullish Signals: No strong bullish technical indicators currently detected.
Bearish Signals: RSI indicates overbought conditions, suggesting short-term caution.
Support and Resistance:
Resistance: ~$119,416.6
Support: ~$117,227.4
MACD and other momentum indicators show indecisiveness, implying possible sideways movement or minor corrections before the next major move.
3. Market Sentiment
Fear & Greed Index: 70 (Greed)
Investor sentiment is bullish but tempered by profit-taking and cautious positioning.
ETF flows show a recent reversal with $68 million outflows from Bitcoin ETFs, ending a 13-day inflow streak.
Ethereum and altcoins are attracting more inflows, signaling a rotation in institutional interest.
4. Recent News Highlights
Bitcoin remains dominant but has been mostly stagnant below $120K, while altcoins struggle for momentum.
Institutional investors are shifting some capital from Bitcoin to Ethereum and other altcoins.
Bitcoin is in a "perfect accumulation" phase, with all investor tiers building positions despite some whale transfers.
Experts like Arthur Hayes predict Bitcoin could reach $250,000 by year-end, driven by credit expansion and macroeconomic factors.
Network activity shows a slight dip in active addresses, indicating a short-term pause.
Support levels around $116,952 and $114,354 are critical to watch for downside risk.
Bitcoin's dominance remains strong at around 61%.
5. Outlook
Short-term: Bitcoin may continue to consolidate between $117,000 and $120,000, with potential minor pullbacks due to overbought RSI.
Medium to Long-term: Positive macro factors and accumulation trends suggest potential for new highs, possibly targeting $150,000 to $250,000.
Watch for a breakout above $120,000 to confirm bullish momentum continuation.
Monitor ETF flows and on-chain activity for signs of renewed institutional interest or caution.
Recommendations for Traders and Investors
Traders: Consider cautious trading around current levels, watching for RSI and MACD signals for entry/exit points. Be mindful of resistance near $120,000.
Investors: Accumulation phase suggests good opportunities for long-term holding, especially if Bitcoin holds above $117,000.
Risk Management: Keep stop-loss orders near support levels to mitigate downside risk in case of a correction.
Btc bullish as long as weekly holds CRYPTOCAP:BTC 4H Analysis - Current: $117,150 (-0.97%)
Range-bound between $115,687 week low and $120K+ resistance. Monday low at $116,500 serving as immediate support - critical inflection point.
4H Fair Value Gap clearly defined - institutional liquidity zone demanding respect. Market structure showing inducement above $120K highs with potential liquidity sweep of Monday lows to trigger directional move.
Order blocks forming around $116.5K-$117K zone. Break below $116,500 targets $115,687. Reclaim of $118,500 needed for bullish continuation.
Higher timeframes remain constructive despite 4H consolidation.
#Bitcoin #BTC #SMC

BTCUSD SHORTI've spotted a potential short-term bearish move in Bitcoin. Taking a closer look at the 4-hour chart, it seems like we're on the brink of a short-term reversal that could align perfectly with the higher time frame trend. Let's see how this plays out
BTC - RotationsStill pingponging between VAL and VAH, so there is not much to update on BTC.
I think patience is key here, most of all don't chase moves but position at the extremes for opposite side, then you are much better placed for continuation moves.
I never try to have much expectations, but there is a smol gut feeling that ETH puts in a new high locally (let's say around 3920-50) while BTC takes out the internal highs at 121k and makes a lower high.
I can be wrong and we simply keep drifting higher, but divergences between ETH and BTC are often worth watching, because the market as a whole usually struggles to maintain strength when alts attract more capital than BTC does (relative to mc).
