Bitcoin Price Prediction 2025–2030 | EMA & MACD AnalysisBitcoin trades near $114K in August 2025, sitting below EMA 9 and EMA 15 while holding above the EMA 200. The MACD shows weakening momentum, but support at $114K remains firm. This analysis highlights key support and resistance levels ($114K, $120K, $125K) and outlines scenarios for September, with long‑term forecasts pointing toward $300K–$350K by 2030.
BTCUSDT.5S trade ideas

BTC/USDT | Bitcoin Eyes Rebound from $110K Support Zone! (READ)By analyzing the Bitcoin chart on the 4-hour timeframe, we can see that after reaching a new high at $123,218, the price began to pull back and has now corrected down to around $112,500. I expect the current volatility to ease soon. The next critical support zone lies between $110,500–$112,000 — watch price action closely here, as BTC could bounce from this area and push back toward $116,000+. Other key demand zones are located at $109,000, $107,900, and the $105,000–$106,000 range.
Please support me with your likes and comments to motivate me to share more analysis with you and share your opinion about the possible trend of this chart with me !
Best Regards , Arman Shaban

Lingrid | BTCUSD Consolidation PHASE ContinuesBINANCE:BTCUSDT is bouncing from the confluence of an upward trendline and the $112,175 support level, forming a higher low structure. Price remains within an upward channel, with the current pullback holding above key structural support. As long as the higher low remains intact and price stays above $112,175, a continuation toward $120,500 is likely. Momentum appears to be rebuilding within the bullish framework after a period of consolidation.
📉 Key Levels
Buy trigger: Break and hold above $114,680
Buy zone: $111,500 – $112,500
Target: $120,500
Invalidation: Break below $111,000
💡 Risks
Failure to hold the trendline could trigger deeper downside
Resistance at $114,680 may reject early attempts to move higher
Market may stay range-bound if volume remains low
If this idea resonates with you or you have your own opinion, traders, hit the comments. I’m excited to read your thoughts!
BTC/USDT Bearish Continuation SetupChart Identification:
Timeframe: Likely 1H or 4H
Pair: BTC/USDT
Indicators: Ichimoku Cloud
Pattern: Price broke down from cloud resistance and is retesting previous support
Setup: Bearish continuation with consolidation before next leg down
---
✅ Trade Setup (Sell):
🔹 Entry Point:
Sell Entry: Below 113,500.84
This level marks the neckline of a small consolidation zone.
Wait for clean candle close below this level.
---
🎯 Target Levels (Take Profit):
1. TP1: 110,955.16
Previous minor support
2. TP2: 108,091.84
Key support/demand area
---
🧠 Optional Confirmation:
You can wait for:
Bearish candlestick pattern at 112.1K zone
Rejection of retest near 113.7K–114.3K (top of cloud)
---
📌 Summary:
> BTC/USDT Short Setup
🟢 Entry: Below 113,500.84
🎯 Target 1: 110,955.16
🎯 Target 2: 108,091.84
Bearish bias as price remains below the Ichimoku cloud and shows signs of continuation.

TradeCityPro | Bitcoin Daily Analysis #148👋 Welcome to TradeCity Pro!
Let’s move on to Bitcoin’s analysis. Yesterday, Bitcoin made an upward move, but now it’s back around the same levels and has essentially faked most of that move. Let’s see what its next move could be.
⏳ 4-Hour Timeframe
Two changes have been made to the chart. First, I turned off the Fibonacci tool because the key levels in this corrective phase have already been identified, so there’s no need to use Fibonacci levels right now.
✔️ The second change is that I moved the Maker Buyer zone slightly higher because I think this placement is more accurate and the price has reacted better to it.
✨ With this updated zone, we can see that yesterday the price reached it, got rejected, and is now moving down.
📊 Volume during this correction has been decreasing, which is a positive sign for buyers. However, RSI faked the 61.67 zone, which isn’t great from a momentum perspective, but since the market doesn’t have a clear trend right now, it’s not very important for us.
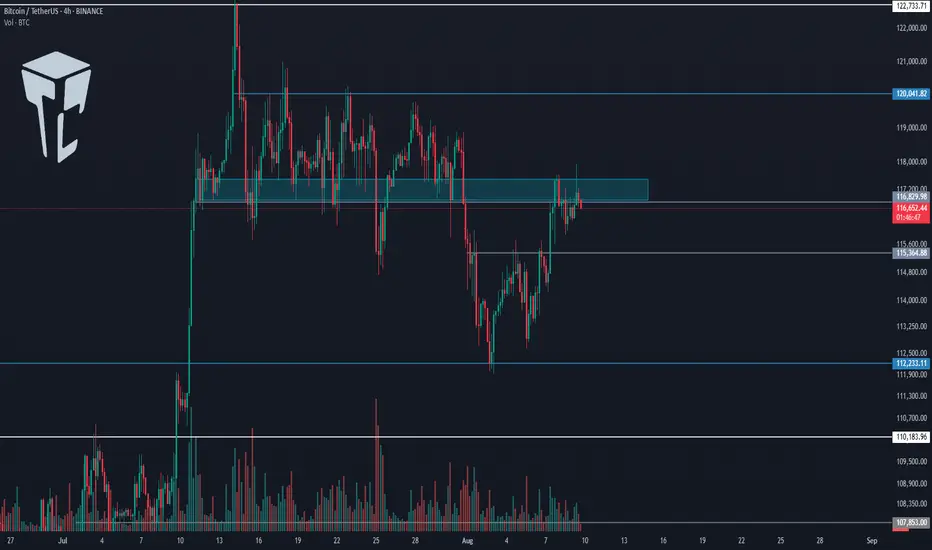
💥 In my view, as long as the price stays above 115364, this correction is logical and doesn’t harm the bullish leg. But if the correction deepens, the probability of a drop back to 112233 increases.
💫 Confirmation of a bullish move will come after breaking the current zone. For the start of longer-term bullish legs, the 120041 and 122733 triggers are very important.
⏳ 1-Hour Timeframe
In the 1-hour timeframe yesterday, we could have opened a position using a candle setup, which could have given us a 2:1 risk-to-reward. But if you didn’t take profit, you likely hit the stop-loss by now.
🔔 I personally opened this position on my sub-account, while on my main account, I currently hold long-term Bitcoin positions with wider stops.
📈 At the moment, for opening a new position on Bitcoin, we can enter on a break of 116829. However, I’ll personally wait for the price to test this zone multiple times, form a clear main trigger, and then enter upon its breakout.
🔽 As for shorts, there’s no short trigger as long as Bitcoin is above 115364.
❌ Disclaimer ❌
Trading futures is highly risky and dangerous. If you're not an expert, these triggers may not be suitable for you. You should first learn risk and capital management. You can also use the educational content from this channel.
Finally, these triggers reflect my personal opinions on price action, and the market may move completely against this analysis. So, do your own research before opening any position.
TradeCityPro | Bitcoin Daily Analysis #144👋 Welcome to TradeCity Pro!
Let’s dive into Bitcoin analysis. Today is the first day of the week and Bitcoin has made a bullish move.
⏳ 4-Hour Timeframe
After the weekly candle closed, Bitcoin made an upward move and pulled back up to the 0.5 Fibonacci zone.
✔️ The long trigger I provided yesterday in the 1-Hour timeframe has been activated. If you opened a short-term position, it has likely already hit the target. If it was a long-term position with a larger stop, then it should still be open for now.
💫 The current 4-Hour candle has wicked into the 0.5 Fibonacci zone, which indicates a strong rejection from this area. If the candle closes red, the probability of starting the next bearish wave will increase significantly.
📊 Besides the resistance from the Fibonacci level, the SMA25 is also overlapping with this zone, so this upward move could also be seen as a pullback to the SMA25 before another drop begins.
✨ However, the candle hasn't closed yet, so it's too early to decide anything. In my opinion, Bitcoin has re-entered a choppy and sideways phase that doesn’t provide good and clean positions — most trades like yesterday’s need to be scalps.
🔍 If a deeper correction happens, our lower support levels are already identified (with the most important one being the 110000 zone). For shorts, I’ll look for entries below 110000. As for longs, I’ll wait for confirmation and stabilization above 116000. For now, I’m only observing this box between 110000 and 116000.
❌ Disclaimer ❌
Trading futures is highly risky and dangerous. If you're not an expert, these triggers may not be suitable for you. You should first learn risk and capital management. You can also use the educational content from this channel.
Finally, these triggers reflect my personal opinions on price action, and the market may move completely against this analysis. So, do your own research before opening any position.

BITCOIN PREDICTION: a SECRET PATTERN is FORMING (watch out)!!!Yello paradisers! In this Bitcoin prediction, I'm updating you about the crash we predicted earlier in previous videos. I'm showing you on a high timeframe chart the ABC corrective mode wave; we are now forming the C wave. The C wave subdivides itself into five smaller waves because it's a motive mode wave. We are taking a look at the volume. We understand that bears are still in power, so we are waiting for some nice volume from bulls. We are spectating a bullish divergence on the MACD indicator. On RSI, there is exaggerated bullish divergence, and in stochastic RSI, we are in an oversold area.
Then, we are shifting our focus to a medium timeframe. We are zooming into the fourth wave, where we are making our sub-waves right now. On the medium timeframe, we are also spectating bearish divergence. We are waiting for the second booby that will basically increase the probabilities of absorption.
As we have seen previously, that helped us to predict that Bitcoin will be crashing. We are also taking a look at our head and shoulders target, which is at $109,000.
Then we are shifting our focus to a lower timeframe, where we are seeing the secret pattern, triple three. Right now, we are creating a sub-wave XX, which is forming itself as a possible zigzag. Paradisers, make sure that you are trading professionally, focus on long-term growth, and avoid get-rich-quick schemes. Any shortage in trading usually ends up sooner or later in bankruptcy.
Remember, don’t trade without confirmations. Wait for them before creating a trade. Be disciplined, patient, and emotionally controlled. Only trade the highest probability setups with the greatest risk to reward ratio. This will ensure that you become a long-term profitable professional trader.
Don't be a gambler. Don't try to get rich quick. Make sure that your trading is professionally based on proper strategies and trade tactics.

BTC/USDT🩸 CRYPTOCAP:BTC ⁀➷
$Bitcoin. Macro chart Another
💯 Intermediate Target — 60 500 $
🚩 Macro Target 1 — 55 000 $
🚩 Macro Target 2 — 47 000 $
🚩 Macro Target 3 — 37 000 $
- Not financial advice, trade with caution.
#Crypto #Bitcoin #BTC #Investment
✅ Stay updated on market news and developments that may influence the price of Bitcoin. Positive or negative news can significantly impact the cryptocurrency's value.
✅ Exercise patience and discipline when executing your trading plan. Avoid making impulsive decisions driven by emotions, and adhere to your strategy even during periods of market volatility.
✅ Remember that trading always involves risk, and there are no guarantees of profit. Conduct thorough research, analyze market conditions, and be prepared for various scenarios. Trade only with funds you can afford to lose and avoid excessive risk-taking.

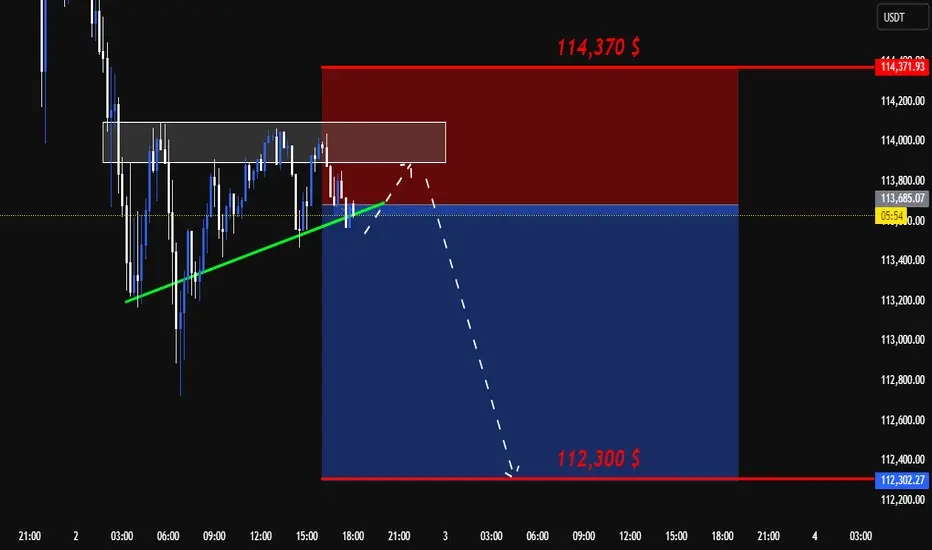
BTC SHORT SETUP INTRADAY ( 02 AUG 2025 )If you have doubt on our trades you can test in demo.
Details:
Entry: 113,680 $ - 113,450 $
Target Price: 112,300 $
Stop loss: 114,370 $
Trade Ideas:
Idea is clearly shown on chart + we have some secret psychologies and tools behind this.
What is required to Join VIP?
- Nothing just you have to share 10% of your profit with us at the end of the month which you earned from our signals. Yeah this is just the requirement, trade where ever you like your favorite broker or else you don't need to pay fees first or create account thru our link.
Trade Signal:
I provide trade signals here so follow my account and you can check my previous analysis regarding BITCOIN. So don't miss trade opportunity so follow must.
BINANCE:BTCUSDT BINANCE:BTCUSDT.P BINANCE:BTCUSD
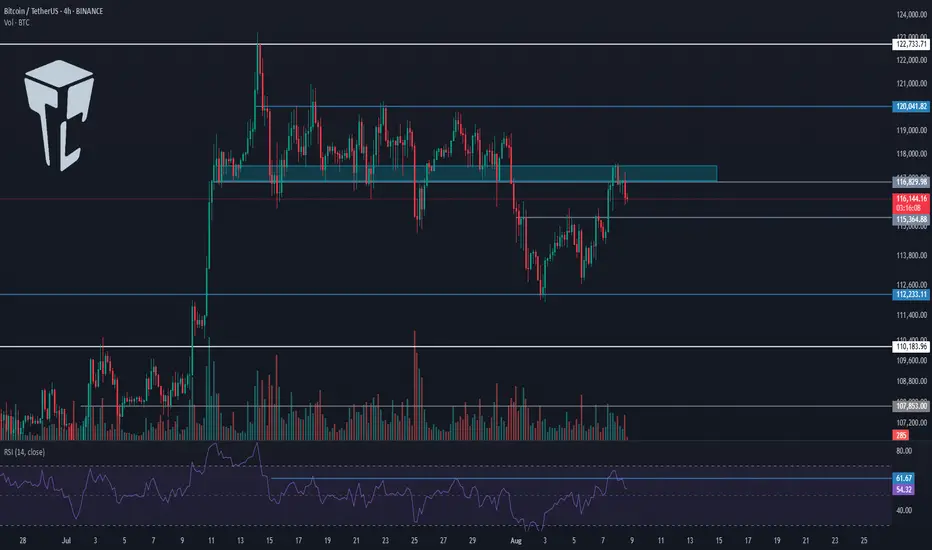
TradeCityPro | Bitcoin Daily Analysis #149👋 Welcome to TradeCity Pro!
Let’s move on to Bitcoin’s analysis. Today, Bitcoin has once again moved toward a certain range, and we need to see whether it can break this zone this time or not.
⏳ 4-Hour Timeframe
On the 4-hour timeframe, Bitcoin has once again moved toward the 117000 zone today, faced a rejection candle from this level, and now it seems to be heading for a correction.
✔️ Considering tomorrow is also a holiday, the likelihood of ranging and correcting is much higher than continuing the trend, because for the uptrend to continue, the price needs volume inflow — and today and tomorrow, significant volume is unlikely to enter Bitcoin. That’s why the probability of correction and ranging is higher.
📊 If, during the correction, the price can hold above 115364, then with the start of the new week, the probability of a new bullish wave increases significantly. In that case, we can open a long position upon breaking the 117000 zone.
✨ However, if the price breaks below 115364, the correction could extend down to 112233. This still won’t change the overall trend, but it would fake the entire move made during the week — which is not a good sign for the bullish trend.
🔍 As long as the price remains above 112233, I am still only looking for long triggers and will not open any shorts for now.
❌ Disclaimer ❌
Trading futures is highly risky and dangerous. If you're not an expert, these triggers may not be suitable for you. You should first learn risk and capital management. You can also use the educational content from this channel.
Finally, these triggers reflect my personal opinions on price action, and the market may move completely against this analysis. So, do your own research before opening any position.
Next Volatility Period: Around August 13th (August 12th-14th)
Hello, fellow traders!
Follow us to get the latest information quickly.
Have a great day!
-------------------------------------
(USDT 12M Chart)
A lot of money has been flowing into the coin market through USDT.
A decline in USDT indicates capital outflow from the coin market.
(USDT.D 12M chart)
As USDT continues to rise, its dominance naturally rises.
However, if USDT is used to purchase coins (tokens) in the coin market, its dominance will decline.
USDT dominance peaked in 2022 and is showing a downward trend.
This indicates that a significant amount of capital flowing into the coin market was used to purchase coins (tokens).
USDT dominance is expected to fall to around 2.84 this year before beginning an upward trend, marking the end of its three-year bull market.
I believe this trend will inject new vitality into the coin market.
For the coin market to maintain an upward trend, USDT dominance must remain below 4.91 or show a downward trend.
If this fails and the price rises above 4.91, the coin market is likely already in a downward trend.
A decline occurred on May 8, 2025, creating a reverse trend.
To maintain this reverse trend, we need to see if it can fall below 4.24.
If USDT dominance declines, the coin market is likely to show an upward trend.
------------------------------------------------------
(BTCUSDT 1D chart)
As the new week begins, the HA-High indicator on the 1W chart is showing signs of forming a new level at 114454.57.
Accordingly, the key question is whether the price can rise after finding support in the 114454.57-115854.56 range.
The formation of the HA-High indicator means that the price has fallen from its high.
This also means that further declines are highly likely.
Therefore, if possible, the price should rise above the 114454.57-115854.56 range and maintain its upward momentum.
This period of volatility is expected to last until August 6th.
Therefore, the key question is whether the price can rise above the 114454.57-115854.56 range after the volatility period.
If not, we assume the price will decline until it meets the HA-Low indicator and consider countermeasures accordingly.
This is because the HA-Low and HA-High indicators are paired.
As the price declines, indicators such as the HA-Low or DOM(-60) may appear.
Therefore, if the price declines, you should monitor for the emergence of indicators such as the HA-Low or DOM(-60).
The basic trading strategy is to buy between the DOM(-60) and HA-Low ranges and sell between the HA-High and DOM(60) ranges.
-
If the price falls below the M-Signal indicator on the 1D chart, it is highly likely that the trend will be re-established upon meeting the M-Signal indicator on the 1W chart.
Therefore, if the price fails to rise to the 114454.57-115854.56 range, it is highly likely that the price will eventually meet the M-Signal indicator on the 1W chart.
At this time, a key support and resistance level is expected to be around 108353.0.
When new support and resistance levels are formed, they must remain horizontal for at least three candlesticks to function as support and resistance.
In other words, the HA-High indicator on the 1W chart is showing signs of forming, but it hasn't yet.
Therefore, if the current price holds this week, it will form next week.
Therefore, for the HA-High indicator to function properly as support and resistance, it must remain horizontal for three candlesticks, or three weeks.
This rule must be acquired through significant time and observation.
-
If you sold partially in the 115854.56-119177.56 range according to your basic trading strategy, you will find it easier to observe the current movement. If not, you will likely become anxious.
The key to trading is maintaining a stable psychological state.
If you begin to feel anxious, you should consider how to stabilize your psychological state.
Otherwise, you'll end up making the wrong trades.
-
Thank you for reading to the end.
I wish you successful trading.
--------------------------------------------------
- Here's an explanation of the big picture.
(3-year bull market, 1-year bear market pattern)
I'll explain more in detail when the bear market begins.
------------------------------------------------------

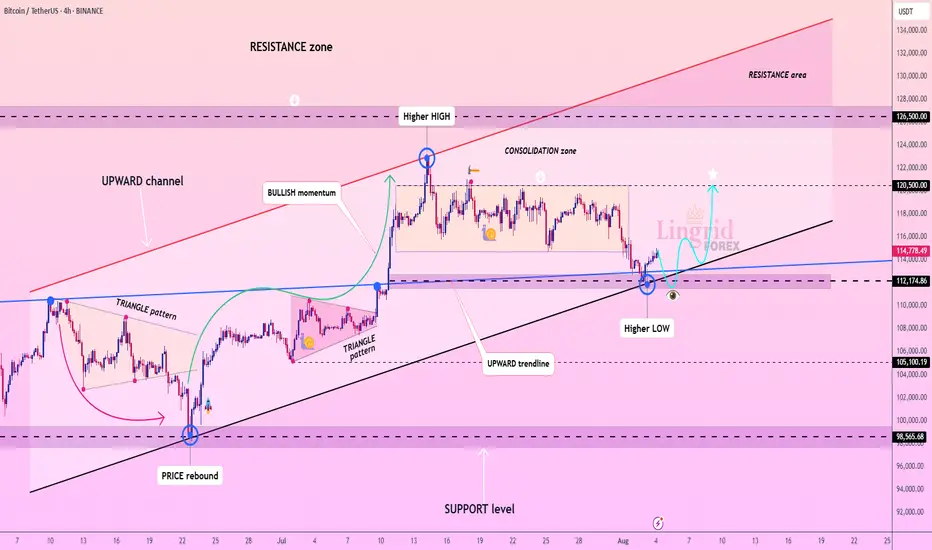
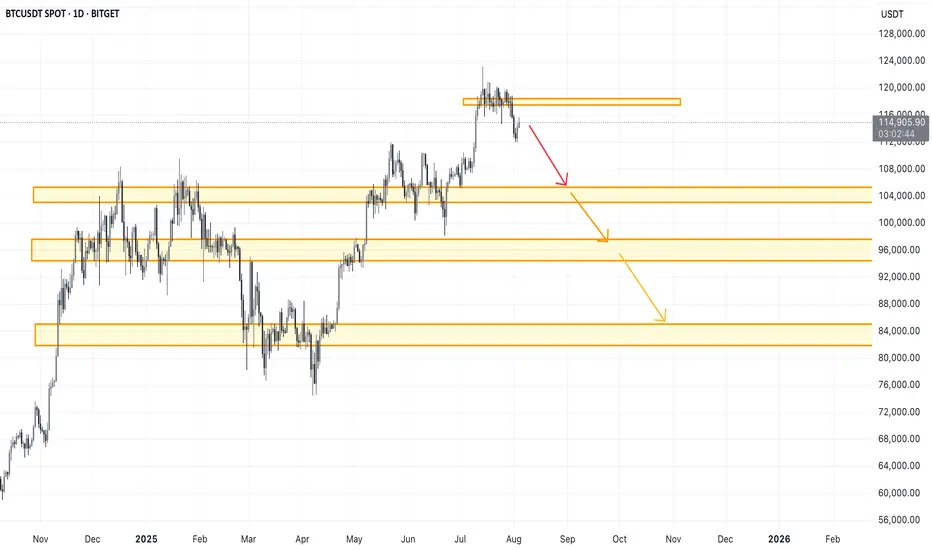
BTCUSDT local correction is expectedExpecting local correction on BTC, as the price didn't manage to fix above 118500. Main target is around 103-105. In case of the deeper correction - next targets are mentioned on chart.
Invalidation will occur when price will fix above 118500 at least with one full candle.
BTC 4hHello to all traders. 😎😎
I hope all your deals will hit their targets. 🎉🎉
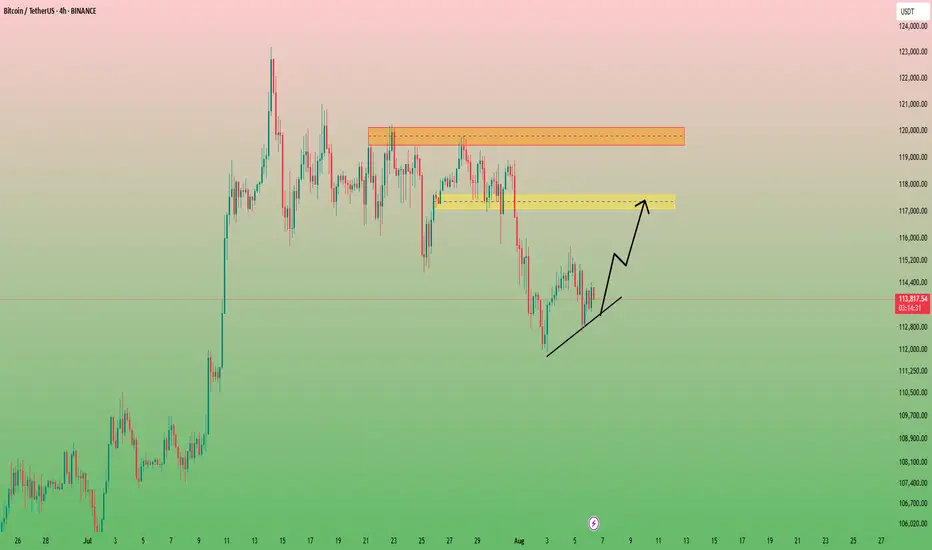
I think Bitcoin can grow to the $117,000 range and then even to $119,000. Even if it wants to do it in a downtrend, it must first grow to collect the short positions from above and then fall.
⚠️⚠️⚠️⚠️Don’t forget to apply proper risk management!
What Do You Think?
Which scenario do you think is happen? **Share your thoughts!** ⬇️
Don't forget that this is just an analysis to give you an idea and trade with your own strategy. And don't forget the stop loss🛑🛑🛑
❤️❤️❤️The only friend you have in financial markets is your stop loss❤️❤️❤️
Please support me with your ✅' like'✅ and comments to motivate me to share more analysis with you and share your opinion about the possible trend of this chart with me 🙏😊
Be Happy , Ali Jamali
DeGRAM | BTCUSD reached the support level📊 Technical Analysis
● BTCUSD has bounced from confluence support at 112.3k–114.8k, reclaiming the ascending support line and validating the lower boundary of the rising triangle.
● Price action suggests a bullish continuation setup with targets at 119.9k and extension to the upper resistance near 122.5k–125k.
💡 Fundamental Analysis
● US labor data slowdown and dovish Fed commentary have pulled real yields lower, boosting crypto demand.
● Glassnode reports ongoing whale accumulation and rising stablecoin inflows, signaling positive capital rotation into BTC.
✨ Summary
Long above 114.8k. Targets 119.9k → 122.5k+. Setup invalidated on a break below 112.3k support.
-------------------
Share your opinion in the comments and support the idea with a like. Thanks for your support!
The Great Trap: How Billionaires Are Winning, and You're Not!The Great Crypto Trap: How Billionaires Are Winning—And You're Not
The ETFs, Saylor, and all of Trump's billionaire friends are getting richer—thanks to crypto.
Meanwhile, most retail traders are just trying to stay above water. Leverage trades are wiped out, charts feel rigged, and the market makes you feel like you're swimming against a riptide.
Why?
Because these rich guys have a plan: manipulate you and take your money. That’s how they stay rich.
Understanding their strategy is the first step to stop being their exit liquidity.
🧠 The New Battlefield
Crypto is no longer a playground for cypherpunks and tech rebels. It’s fully institutional now. We're not just trading against whales—we're fighting the same entities that own the media, control Wall Street, and write the rules.
So forget the old ways of thinking. The tables have turned.
🗓 The Sunday Rekt Routine
To maximize destruction, they need to avoid friendly fire. So they pump on the weekend when retail is free and optimistic, then dump on Monday to close the CME gap—like clockwork.
The playbook:
Weekend: Pump. Trap your long.
Monday: Dump. “Fill the gap.” Liquidate everyone.
Response:
Don’t fall for weekend FOMO. Exit Sunday afternoon. Wait until Tuesday to re-enter, once Monday’s high and low are set. Trade smart, not emotional.
📈 Top-of-the-Market FOMO
You’ve seen it before. Just before the crash, the media frenzy begins. Influencers say “Don’t miss this pump!” or “99% will miss the next big move!” The ETF gods hint at new inflows. It's a setup.
They're not hyping it for your benefit—they're offloading their bags in your face.
Just look at the charts:
BlackRock bought billions to drive BTC to 121K.
Then, in 72 hours, they dumped billions.
Saylor? Silent. No new buys. That’s not coincidence—it’s coordination.
Response:
Check the MACD, RSI, and Stochastic RSI on daily or weekly timeframes. If they're maxed out and the influencers are screaming green—it’s probably too late.
When they stop buying, the dump is already planned.
🧰 How to Outsmart Them
Watch the MACD for crossovers and divergence.
Monitor RSI zones—don’t long into extreme overbought conditions.
Use Stoch RSI to anticipate momentum shifts.
Rule: When everything is overheated, and FOMO is peaking—step back. Let them dump into each other. You’ll get your entry later, cleaner and cheaper.
⚔️ This Is War
Make no mistake: this is a war for your money.
They want yours. You want theirs.
Only the smart survive.
To be continued.
DYOR.

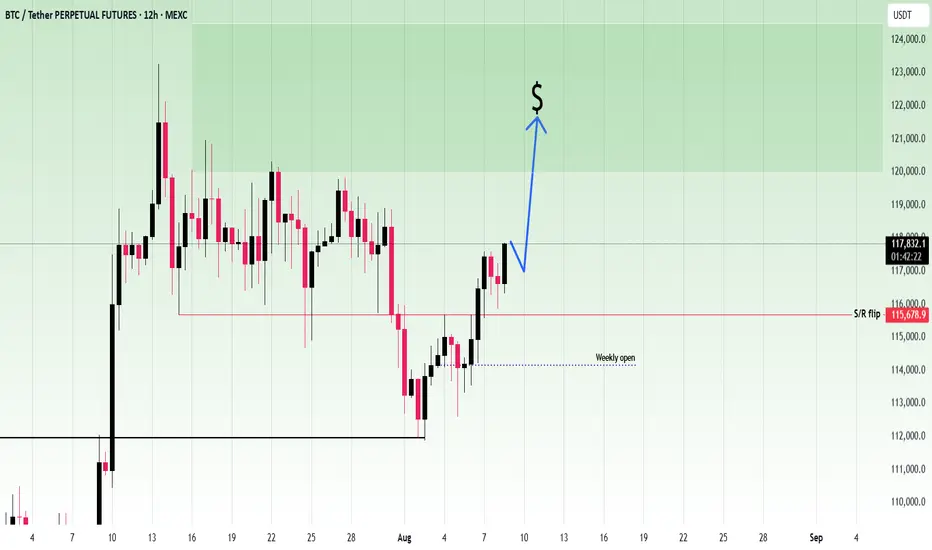
BTC/USDT.dIt looks like BTC is establishing support above this trendline if you study the line chart on a daily timeframe. A bounce here could mean serious growth... a fake out to go lower.. can be catastrophic. So far we are solid on track to go higher. Lets see

What is likely going to happen.BTC close back inside the range(S/R flip)
The liquidity above 119k is likely going to get tapped if BTC holds inside the range.

LETS FRKN GO!!!!2 days ago I released a 'Make or Break' video
It is with GREAT joy that I say I'm made!
My high ideals of revolutionizing the trading game is materializing...there's no counter argument
THANK YOU for all of the amazing humans who have been apart of my journey.
LETS FRKN GO!!!!

BTC-What is likely going to happen.BTC close back inside the range(S/R flip)
The liquidity above 119k is likely going to get tapped if BTC holds inside the range
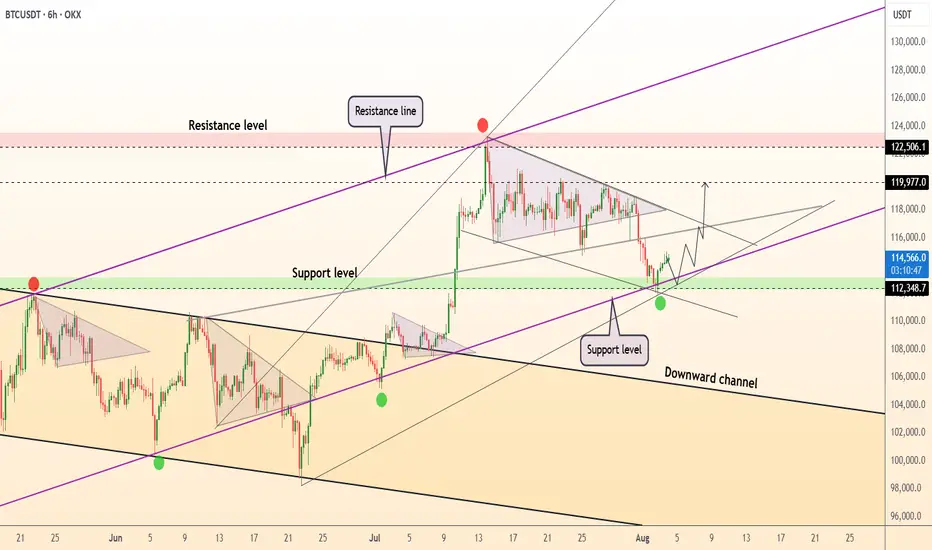
Bitcoin above $116k ┆ HolderStatOKX:BTCUSDT reclaimed the 115k pivot after breaking a local channel that formed within a larger wedge. The surge from triangle consolidation, followed by a controlled pullback and higher‑low, suggests accumulation rather than distribution. As long as 113–115k holds, targets line up at 118.5k, 121k and the extension toward 124–126k along the rising trend fan. Only a decisive close below 112k would invalidate the immediate bullish bias and reopen 109–110k. For now, constructive momentum and structure favor continuation.
Buying Idea For BITCOIN
dont be aggresive dont be greedy
Trading is 80% of waiting 20% (open position, money management, etc)
Lets wait and see BINANCE:BTCUSDT

End of Bitcoin's Bull CycleEnd of Bitcoin's Bull Cycle: Is October 2025 the Final Peak?
"This is my personal opinion and does not constitute any investment advice."
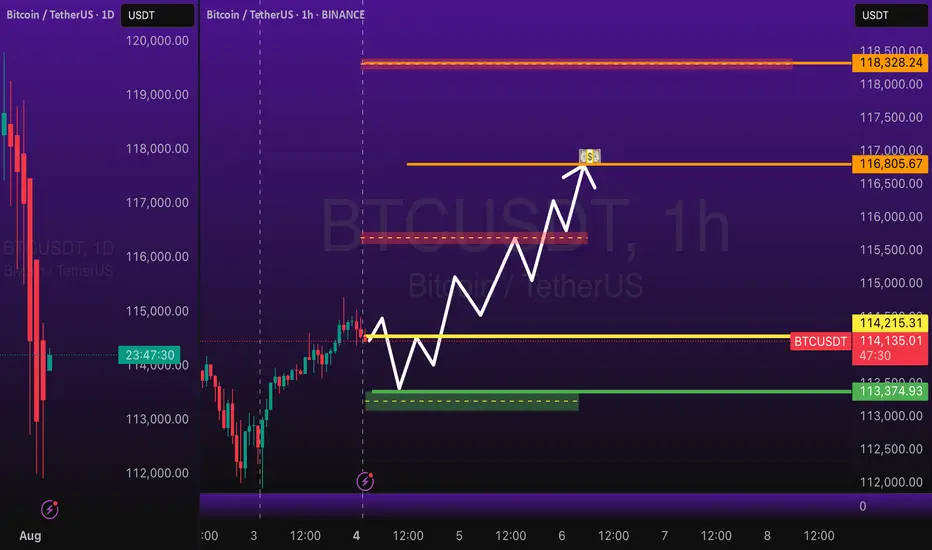
BTCUSD going to touch 116,800BITSTAMP:BTCUSD Long trade, with my back testing of this strategy, BTCUSD need to touch 116,800
This is good trade, don't overload your risk like greedy, be disciplined trader, this is good trade.
Use proper risk management
Looks like good trade.
Lets monitor.
Use proper risk management.
Disclaimer: only idea, not advice