BTC Consolidates Below Key Resistance – Is a Breakout Imminent?Bitcoin is currently consolidating beneath the major psychological resistance near $120,000. The medium-term trend remains bullish, supported by a series of higher highs and higher lows. However, recent candlesticks with long upper wicks reflect hesitation among buyers at elevated levels, pointing to potential exhaustion in short-term momentum.
Despite this, there are no clear signs of bearish divergence or strong reversal patterns. The sideways range between $112,000–$120,000 likely represents a healthy consolidation phase after a strong rally. If the price maintains support around $113,000 and breaks above $120,000 with convincing volume, the next leg higher could follow swiftly.
For now, buyers remain in control, provided BTC holds key structural supports. A breakout confirmation is crucial for bullish continuation.
BTCUSDT.5S trade ideas
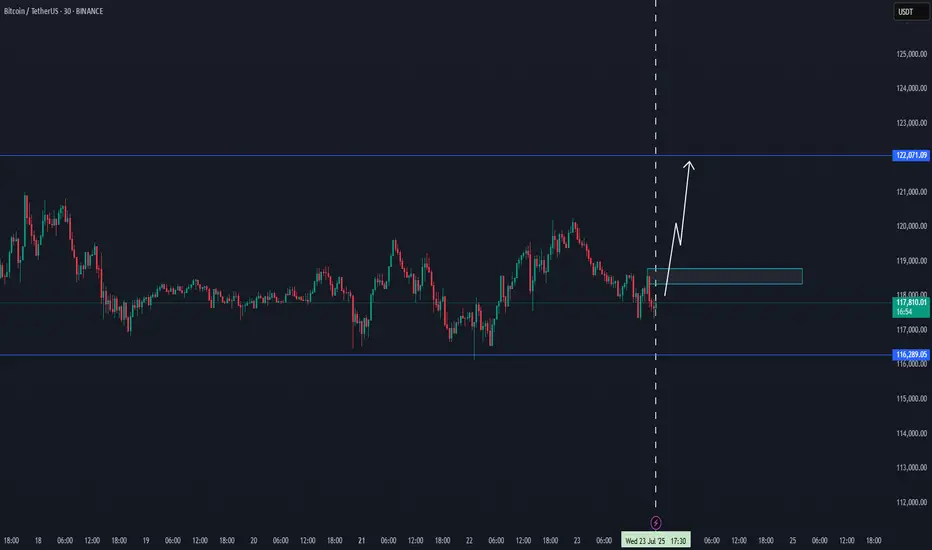
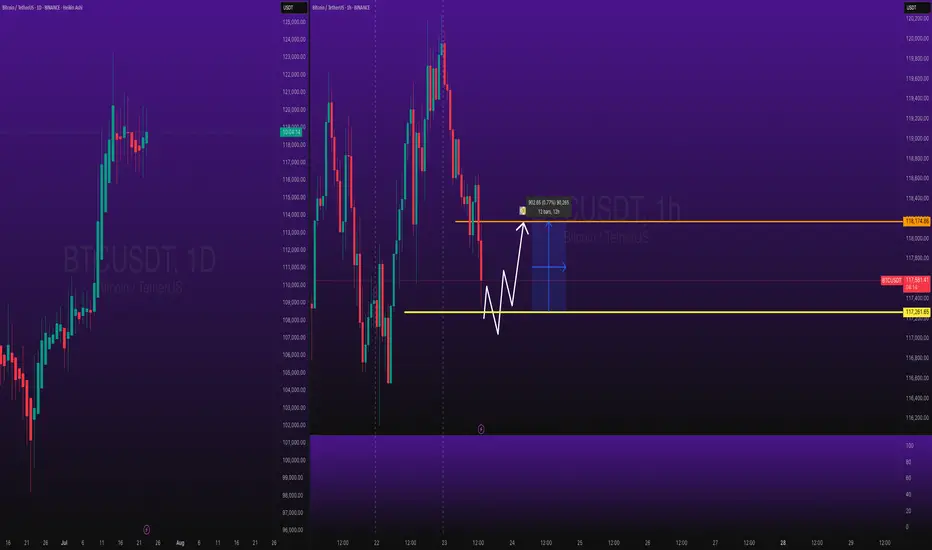
BTC NEW VOLUME TREND 122KThis is a small time frame update, where BTC can try to target 22K again in the coming time frames. Since the last 15H breakdown volume, BTC can enter new uptrend volume
From the box level, there is a good chance for a new uptrend.
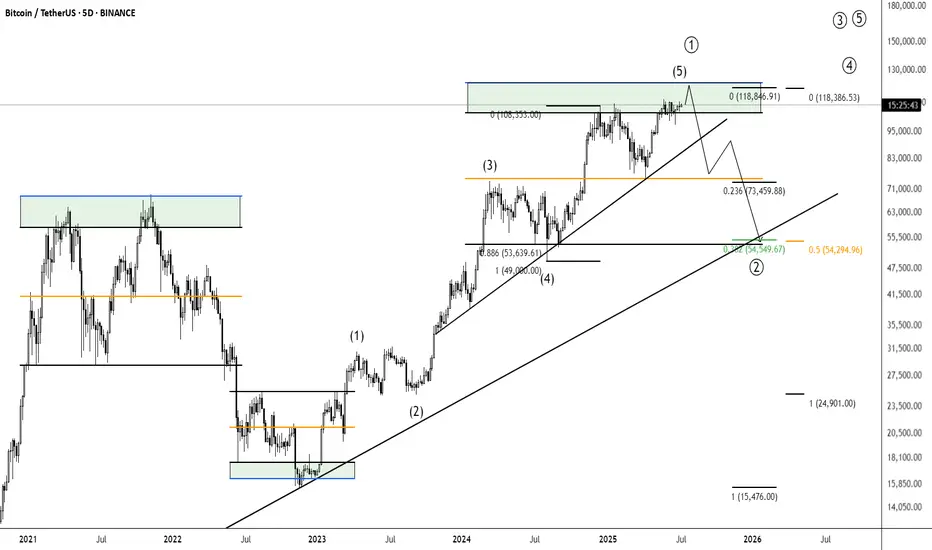
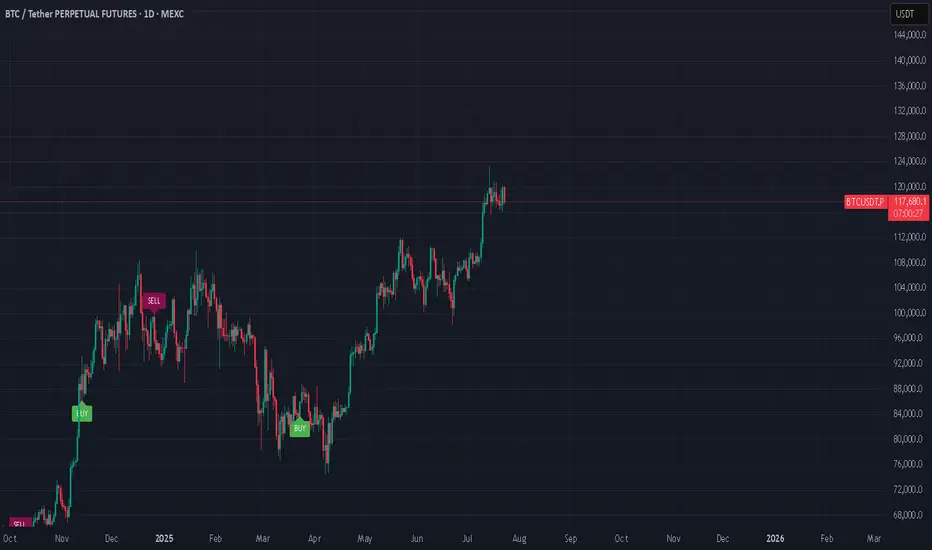
A bearish 12 Month candle could be in the cardsBitcoin made an yearly high of 20% after 6 months in on the yearly candle
This does not make me feel great about the rest of the year
a clear sell signal would be an higher timeframe close under 100k after an upthrust to new ath around 110k - 120k
around 50k-54k for me is an good buy level to build an longterm position:
0.382 fib retracement for an primary 1-2 wave
0.500 fib retracement from the 25k low
0.886 fib retracement from 49k low
50% pullback from current high to projected low
where will bitcoin go ? i don't know, but i do know where i want to buy and when i want to sell
BTC market update Bitcoin Market Update:
Bitcoin is currently consolidating, and the market is indecisive. It's better to watch closely for a breakout or breakdown before making any trades.
Bullish Scenario:
Breakout above resistance could lead to a strong bullish rally. Target: Next resistance level.
Pro Tip: Confirm with high volume for a valid breakout.
Bearish Scenario:
Breakdown below support could trigger strong selling. Target: Next support level.
Pro Tip: Watch for confirmation with increased selling volume to avoid fakeouts
Conclusion:
Wait for clear breakout or breakdown to trade. Avoid entering blindly.
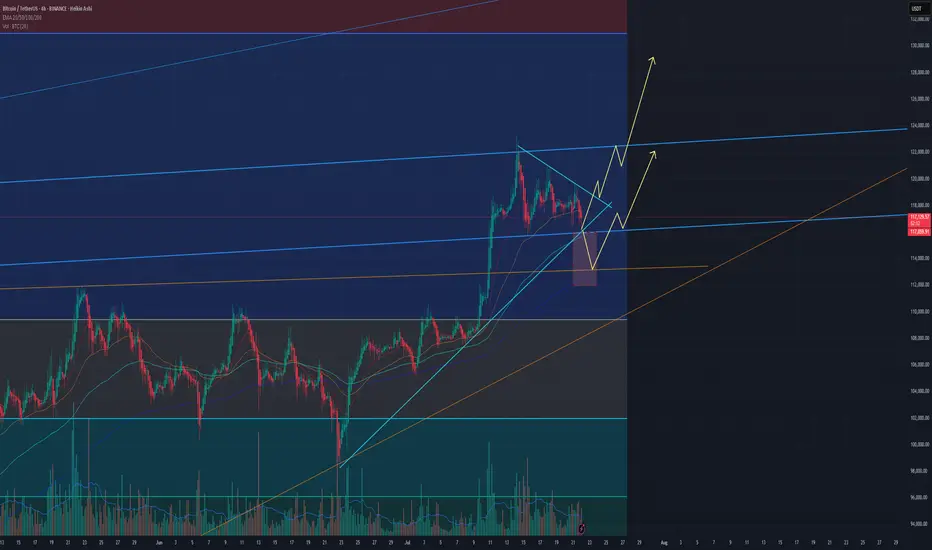
BTC Triangle Consolidation: Ready for TakeoffBTC is gearing up for its next move following a triangle consolidation
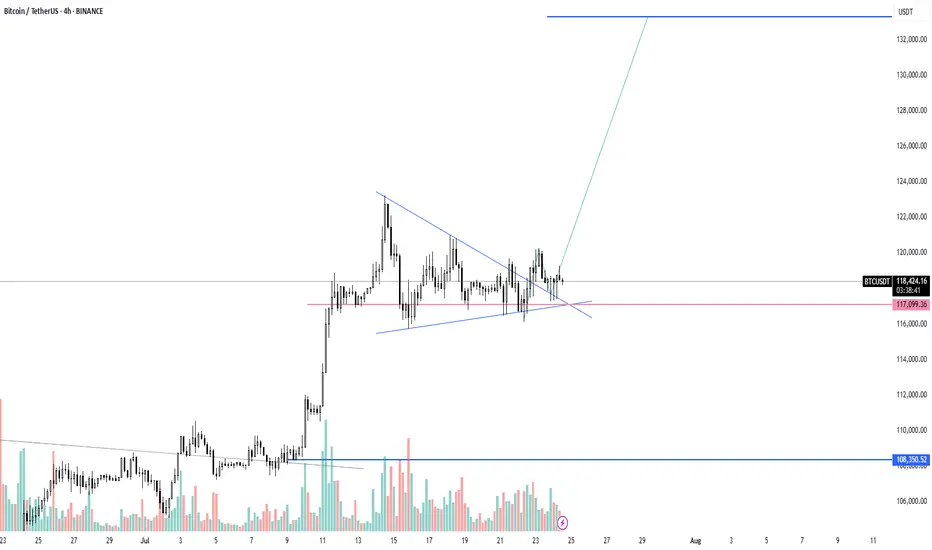
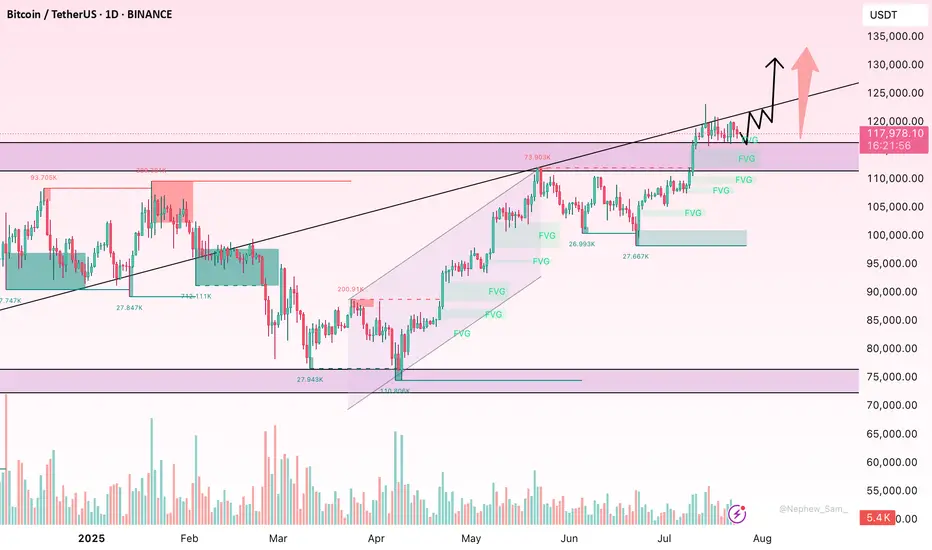
Bitcoin · $137,000 Next Target Followed by $155,000There won't be a correction for Bitcoin. Not now, not yet. The reasons why I already explained in several earlier publications that predicted the current scenario. The bullish breakout that is from the long-term consolidation range. That's the reason, that's the reason why Bitcoin will not go lower without first going higher.
Since Bitcoin consolidated for 7 months below $110,000, it will continue climbing until it reaches higher.
The next target is $137,000. At this point a correction can develop and if it does, we don't expect this correction to last long. The correction can be strong, deep, surprising, but it cannot be long in duration. That is because Bitcoin is headed toward $155,000 and that's the main level for this bullish wave. Until this target is achieved, nothing can stop the future of finance, Bitcoin is moving ahead.
The proof is in the altcoins market. "The altcoins follow Bitcoin." In the current situation, Bitcoin is consolidating while the altcoins grow. If Bitcoin were to crash, the altcoins wouldn't move one dollar higher. In fact, they would be crashing even stronger and faster.
Bitcoin would need to just falter for one day for the altcoins to crash to new lows. What is happening now? Bitcoin can shake; Bitcoin drops; Bitcoin consolidates, and the altcoins continue to grow. That's the proof that the next main—major—move is an advance for Bitcoin. Never SHORT Bitcoin when the market is bullish and strong.
Bitcoin is a growing phenomenon, it is very young. Just think of the US Dollar or Gold. How old are these instruments? How old are market securities and stocks? Some corporations are hundreds of years old. Countries? Thousands of years and still living... Bitcoin can have a life span of 80 years, 140 years, 200 years, 500... who knows. It is a question market. But there is no doubt that it is young. When you are young, you cannot stop your own growth. Bitcoin is already growing and will continue to do so. I will not be surprised when I see Bitcoin trading at $1,000,000+. It might take several years, but several years back Bitcoin was trading at $5k. What's the price now?
$120,000. Trading near resistance is bullish. No corrections. No drops. No retrace.
Thank you for reading.
Namaste.

BTCUSD Long Trade BITSTAMP:BTCUSD Long Trade - this trade is basically based on Key Levels, prices are very intact as exactly shown.
This is good trade, don't overload your risk like greedy, be disciplined trader.
I manage trade on daily basis.
Use proper risk management
Looks like good trade.
Lets monitor.
Use proper risk management.
Disclaimer: only idea, not advice
BTC - Long SET-UP BINANCE:BTCUSDT
Bitcoin AMC Pattern Forming?
BTC is showing signs of an AMC-style accumulation after a range-bound consolidation. A clean breakout is possible if price respects the 113k–113.8k support zone — potential entry zone for smart money 📈
Alternatively, deeper liquidity may be tapped at the 110k–112k OB zone, offering another high-probability buy setup🔁
Watch for signs of bullish intent in these key zones — price structure suggests upside potential once liquidity is swept✅

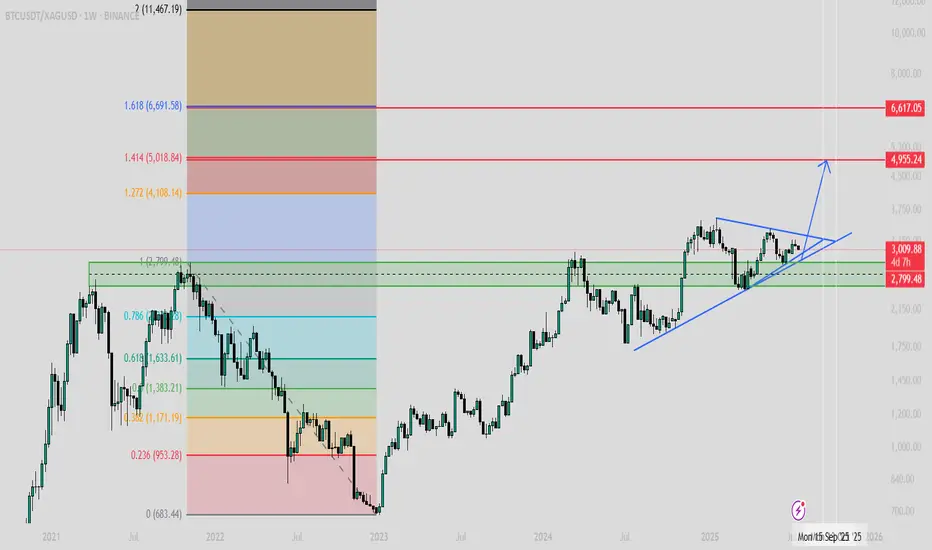
$BTCXAG - BITCOIN TO SILVER - BULLMARKET IS NOT OVER!I bet you haven't seen this chart anywhere! The Bitcoin to Silver chart is preparing for another explosion!
And yes, BULLMARKET IS NOT OVER!
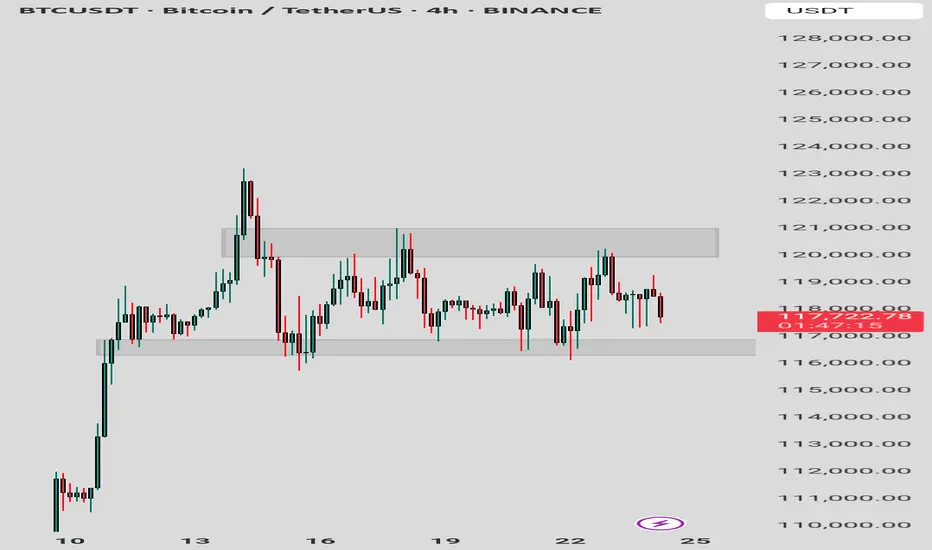
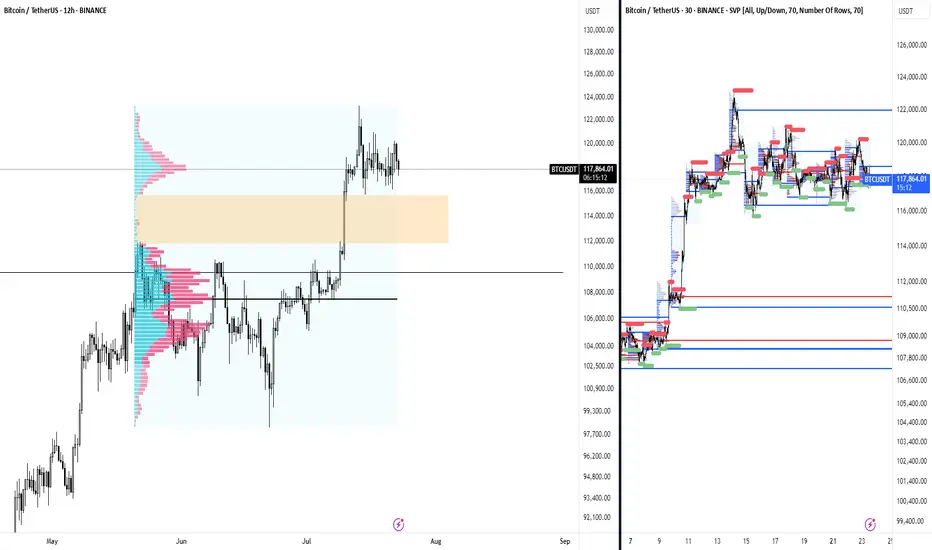
BTC possible failed range breakout - Aggressive Move The BTC ATH rally began post cash close and had very thin volume on the break out before setting this range on the higher time frames. Normally, a range after ATHs are made I would be extremely bullish and I am.
Aside from the failed breakouts at the highs, the attempts paired with nuances such as the crypto week impulses, the day of signing GENIUS and new regulatory acts being drafted now, the attempts to break those ATHs were nudged off.
Sometimes come failed moves come fast moves, and so I have to be prepared that BTC will trade between these thin areas on the volume profile from 111k to 115k. 113k being the most noticeable node in the entire profile.
Similar to my analysis on the break to ATHs, I would expect this move to be aggressive and remind us of a 2020 cycle style flush in Altcoins. Kind of already seeing it with the performance of alts today preempting the failed move up on BTC at range highs.
I will NOT be shorting anything in crypto, these are just areas that I am heavily interested in buying. Currently flat perps and will wait for BTC to make its mind up.
BTC/USDT 15min - Liquidity Sweep + OrderBlockPrice is approaching sell-side liquidity resting below equal lows, aligning with a key bullish order block. A potential W-pattern formation, combined with a volume spike at the sweep zone, suggests smart money accumulation. If confirmed, price may target the buy-side liquidity above, offering a high-probability reversal setup.

Tariffs incoming...July 23: Markets are booming.
August 1st: Tariffs.
I'm just saying, it might be a nice discount...
#market #finance #tariff #trump #crypto #forex #stocks #economy #trading
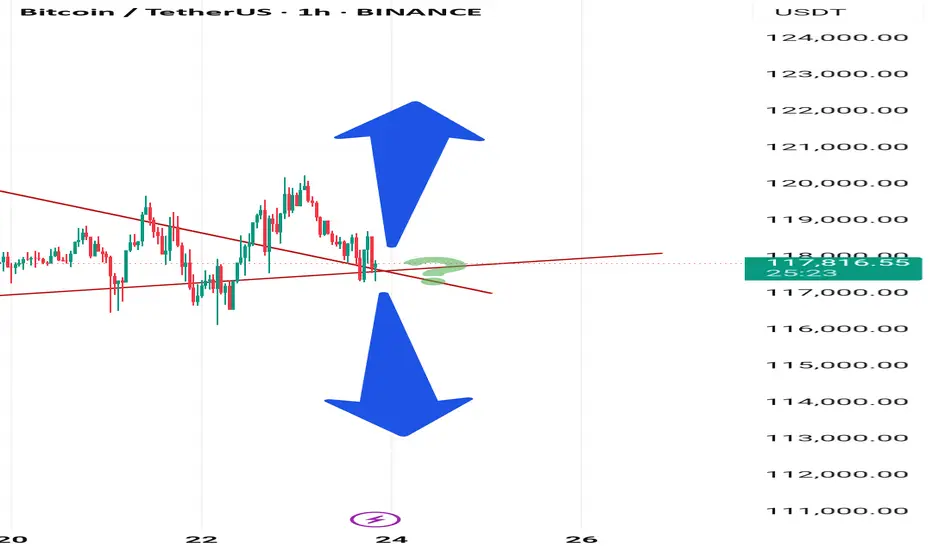
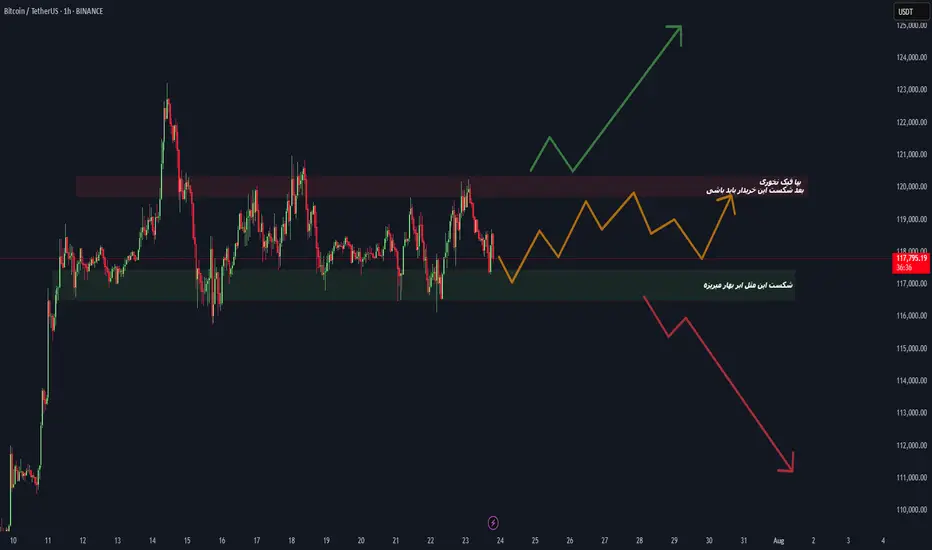
BTC at Make-or-Break Level! Which Side Are You On?#Bitcoin #BTCUSDT #CryptoTrading #TradeWithMky
📉 Scenario 1 – Bearish Breakdown
If BTC loses the green zone (~117K), expect a heavy drop toward 113K and beyond. This is a key demand zone — break it, and bears dominate.
📈 Scenario 2 – Bullish Reversal
Watch for accumulation between the green & red zones. A breakout above the red supply zone (~119K) will signal buyers are back in charge.
🗣️ As the chart says: "بیا فیک نزن، بعد شکست این محدوده باید بخری!"
🚀 Whether you're a breakout trader or a range player — this is the zone to watch.
📊 Chart by TradeWithMky — Where Altcoins Speak Louder than Bitcoin!
👇 Share your thoughts and setups below! Let's ride this move together.
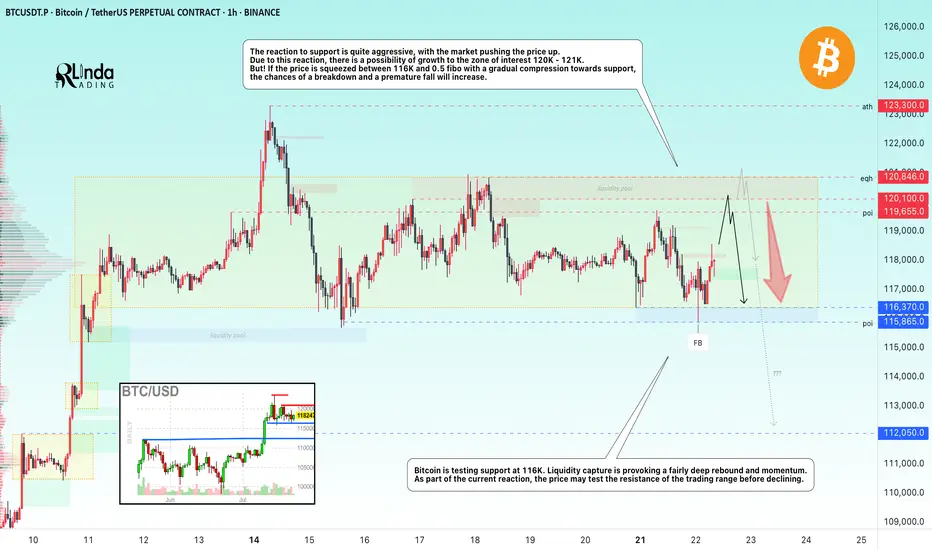
BITCOIN → Consolidation and compression to 116K. Correction?BINANCE:BTCUSDT.P continues to consolidate, with the price testing support at 116K, leaving behind the zone of interest at 120K-121K. Are there any chances for further growth?
(Alternative scenario (if growth to 120K does not occur))
Fundamentally, there is nothing particularly new, and the hype surrounding Bitcoin is stagnating. Technically, on D1, consolidation is underway with pressure from bears against the backdrop of an outflow of funds into altcoins. However, the dominance index is starting to rise, which could trigger some correction in the market. The price on the working timeframe, without updating local highs, is testing lows, and the latest retest of the liquidity zone is provoking a fairly aggressive reaction that could bring the price to retest the zone of interest at 120K-121K.
But! If the price is squeezed between 116K and 0.5 Fib with a gradual squeeze towards support, the chances of a breakdown and a premature fall will increase.
Support levels: 116370, 115860
Resistance levels: 119650, 120100
Technically, the market needs a breather or correction, which is generally a sign of health. The nuance with Bitcoin is that below 115860 there is no support until 112K, and if the market breaks the current consolidation boundary, the further correction could be quite deep. In the current situation, I do not yet see any drivers or reasons for another rally.
Best regards, R. Linda!
Wave Analysis: "Peak Breeds Peak, Trough Breeds Trough".This chart presents a custom technical model relying on only two points to generate a series of expected price levels, integrating multiple factors for high-precision time and price forecasting.
Unlike the traditional ABCD pattern, this method provides both timing and pricing predictions and is designed to detect potential explosive moves (“pumps”) early on.
The analysis is applied to Bitcoin, highlighting key support zones, targets, and stop levels derived from a neural network approach.

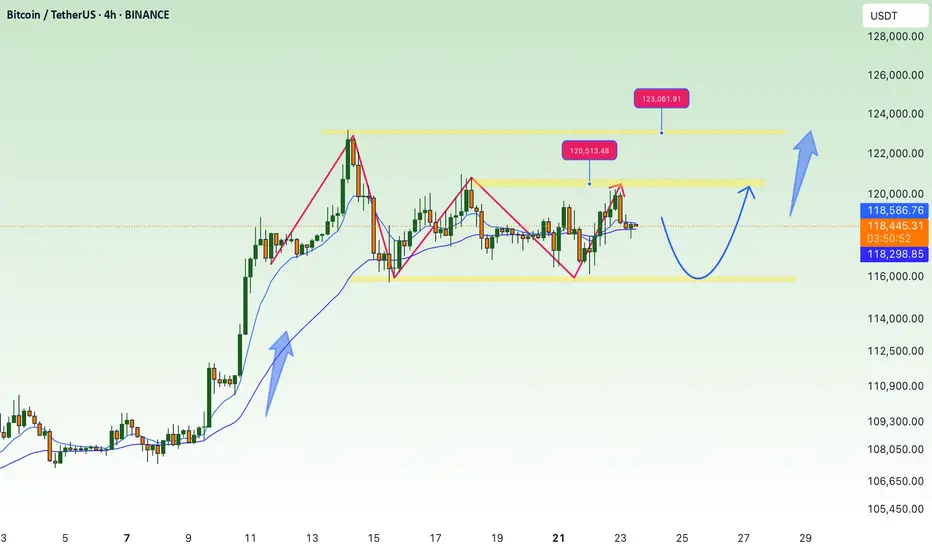
BTC/USDT Analysis: Inside the Range
Hello everyone! This is a daily analysis from a trader-analyst at CryptoRobotics.
Yesterday, Bitcoin continued moving toward the upper boundary of the sideways range. Strong market buying emerged near that level, but unfortunately, it was absorbed by sellers.
At the moment, we are testing the POC (Point of Control) of the current trading range. Buyer activity is already appearing at this level. If bulls regain initiative, we can expect a move back to the upper boundary. However, if the price drops below the current level, there is a high probability of stop-loss hunting and a liquidity grab near $115,000.
Buy Zones:
~$115,000 (zone of initiating/pushing volumes)
$110,000–$107,000 (accumulated volumes)
This publication is not financial advice.

TradeCityPro | Bitcoin Daily Analysis #135👋 Welcome to TradeCity Pro!
Let’s move on to the analysis of Bitcoin and major crypto indices. In this analysis, as usual, I’m going to review the futures triggers for the New York session.
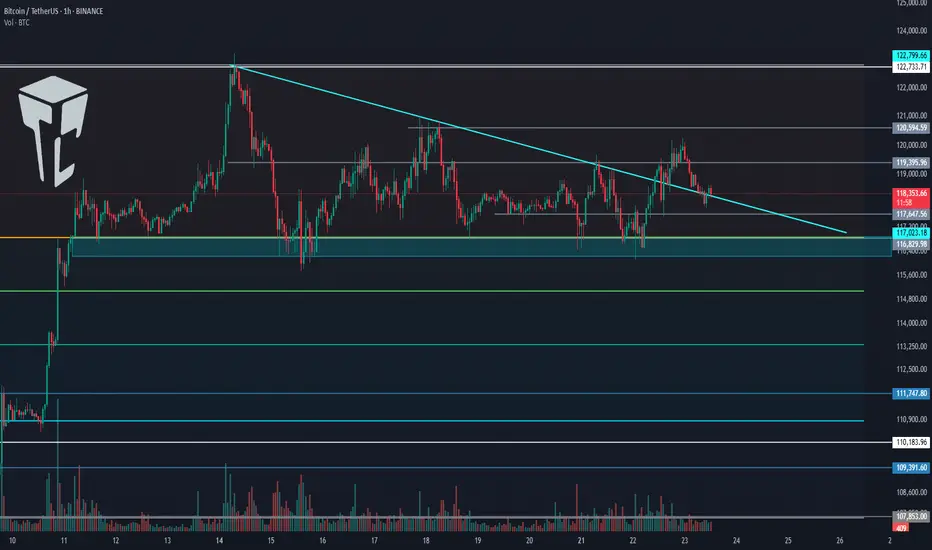
⏳ 1-Hour Timeframe
Yesterday, Bitcoin broke the 119,395 level but couldn’t hold above it and has now returned below this level, currently sitting on its previous trendline.
✔️ Today, the market will probably try to form more structure, and I think Bitcoin will range.
⭐ However, if it wants to move, we can enter a long position with the trigger at 120,594.
🔽 For a short position, we can enter if the 116,000 support area breaks.
👑 BTC.D Analysis
Let’s move on to Bitcoin Dominance. Yesterday, dominance had a bullish move, and finally, a support floor managed to prevent further drop in dominance.
🧩 A retracement to 61.20 has occurred. If this retracement continues, the upper levels are 61.53 and 62.
A break of 60.46 will start the next bearish leg.
📅 Total2 Analysis
Let’s go to Total2. This index has formed a range box between 1.48 and 1.55 and is still oscillating within it.
🎲 If 1.55 breaks, we can open a long position, and on the other hand, if 1.48 breaks, the price could correct to lower support levels.
📅 USDT.D Analysis
Let’s move on to Tether Dominance. This index also has a range box and is still moving inside it.
🔑 Breaking 4.13 is very important for the future market trend and could lead to a drop in dominance.
Accumulate BTC over 115K💎 BTC PLAN UPDATE (July 23rd)
NOTABLE NEWS ABOUT BTC
Bitcoin (BTC) and Ripple (XRP) are approaching their all-time highs, while Ethereum (ETH) continues to grow steadily toward the important $4,000 mark. These top three cryptocurrencies by market capitalization are showing signs of a new bullish momentum, supported by strong technical structures and increasing investor interest.
TECHNICAL ANALYSIS PERSPECTIVE
1. Main Trend
The overall trend remains bullish, with a clearly rising price channel (black diagonal line).
However, BTC is currently in a short-term correction phase, consolidating sideways after the recent strong surge.
2. Key Price Levels
🔵 Strong Support Zone: 116,000 – 117,000 USDT
This zone includes the 200-day moving average (MA200), horizontal support, and a previous bottom — making it a decisive area for the short-term trend.
If this zone breaks, BTC could fall to a deeper support area around 111,000 USDT.
🔴 Resistance Zone: 122,000 – 123,000 USDT
This is a previous peak and a recently “false breakout” area — a strong psychological resistance.
If broken convincingly, BTC could surge to the 130,000 USDT zone (Fibonacci extension 1.618).
3. Possible Scenarios
✅ Bullish Scenario:
Price retests the 116,000 – 117,000 support zone and then bounces.
If it breaks through the 122K resistance, the next target is 130,000 USDT.
❌ Bearish Scenario:
If price breaks below MA200 and the 116K support zone → it could drop to the deeper zone around 111,000 USDT.
4. Technical Signals
There is a triangle accumulation pattern (with flat tops and bottoms).
The “false breakout” at the resistance zone shows that buyers are not yet strong enough and a retest of support is needed.
Follow the channel for the latest and continuous updates on XAUUSD, CURRENCIES, and BTC.
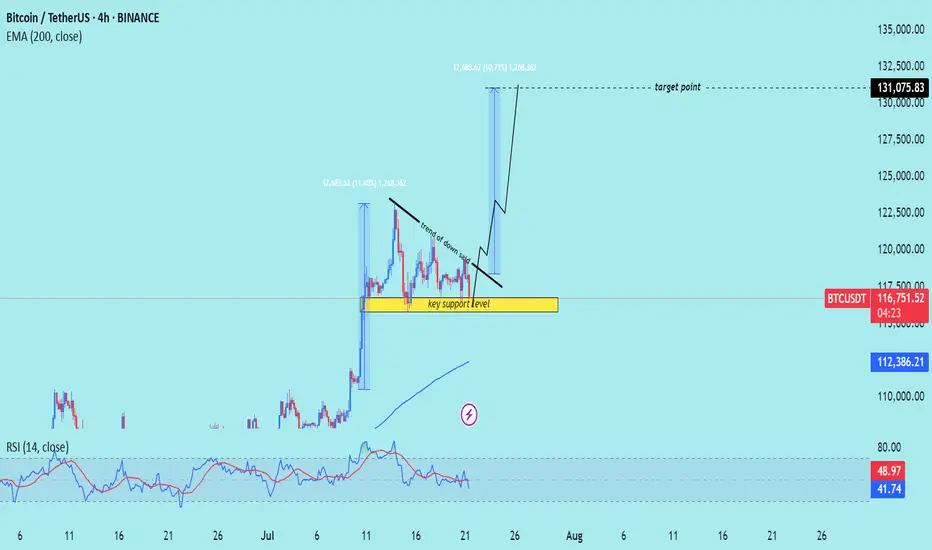
BTC/USD) Bullish trend analysis Read The captionSMC Trading point update
Technical analysis of Bitcoin (BTC/USDT) on the 4-hour timeframe, indicating a potential upward continuation after a period of consolidation above a key support level.
---
Analysis Summary
Pair: BTC/USDT
Timeframe: 4H
Current Price: 116,810.90
Bias: Bullish breakout continuation
---
Key Technical Insights
1. Key Support Zone:
The yellow box marks a strong support level, where price has bounced multiple times.
Acts as a launchpad for the next move higher.
2. Descending Trendline:
A trend of lower highs suggests short-term selling pressure.
Break above this trendline would signal a bullish breakout.
3. Projected Move:
If the breakout occurs, the projected target is around 131,075.83, representing a ~12% gain.
Similar move structure as the previous breakout earlier this month.
4. EMA 200 (Supportive):
Price remains above the 200 EMA at 112,386.80, affirming bullish trend bias.
5. RSI (14):
RSI hovering around 42–49, slightly oversold area, suggesting upside potential remains.
---
Target Point
Target: 131,075.83 USDT
Stop-Loss Suggestion: Below key support zone (~114,000)
---
Trade Idea
Direction Entry Stop-Loss Target
Buy Break above 118,000 Below 114,000 131,000–132,000
Mr SMC Trading point
---
Summary
Bitcoin is consolidating above a strong support zone and under a descending trendline. A confirmed breakout from this pattern could lead to a bullish rally toward 131,000+.
-
Please support boost 🚀 this analysis)
BTC AI Prediction Dashboard - 6h Price Path (23.07.25)
Prediction made using Crypticorn AI Prediction Dashboard
Link in bio
BTCUSDT Forecast:
Crypticorn AI Prediction Dashboard Projects 6h Price Path (Forward-Only)
Forecast timestamp: ~11:15 UTC
Timeframe: 15m
Prediction horizon: 6 hours
Model output:
Central estimate (blue line): -118,153
Represents the AI’s best estimate of BTC’s near-term price direction.
80% confidence band (light blue): 117,892 – 118,573
The light blue zone marks the 80% confidence range — the most likely area for price to close
40% confidence band (dark blue): 117,390 – 119,187
The dark blue zone shows the narrower 40% confidence range, where price is expected to stay with higher concentration
Volume on signal bar: 85.84
This chart shows a short-term Bitcoin price forecast using AI-generated confidence zones.
Candlesticks reflect actual BTC/USDT price action in 15-minute intervals.
This helps visualize expected volatility and potential price zones in the short term.

BTC correction august/septemberBTC has reached overbought territory, there is also bearisch divergence. It also didnt go above 123k anymore. i expect a correction in august/september.
dont chase FOMO, be prepared. Nothing goes in a straight line. there are always corrections.
CRYPTO:BTCUSD BINANCE:BTCUSD CME:BTC1! BINANCE:BTCUSDU2025
