BTCUSDT Smart Zone Entry + Take Profit MapThe BTCUSDT chart on both the 1H and 4H timeframes shows a clear consolidation above a high-timeframe support zone with early signs of bullish continuation. This setup outlines a well-defined "Buy Zone," backed by recent demand re-tests, with Take Profit (TP) levels mapped out based on prior highs and price inefficiencies.
Buy Zone (Demand Zone):
The shaded area on the 1H/4H chart marks a critical support zone between ~$117,800 and $119,300. This range aligns with past consolidation, a 4H EMA cluster, and prior bullish reactions. Entries within this zone offer a high reward-to-risk setup.
Support Level:
$117,800, the base of the demand zone, is the final line of support. A clean break and close below this level would invalidate the current long bias.
Take Profit Levels (TPs):
TP1 (~$122,000): Previous local resistance and recent high.
TP2 (~$123,300): Upper wick high and liquidity zone.
TP3 (~$124,500): Untapped zone from early July, likely liquidity pool.
Supporting Indicators:
RSI: Recovering from mid-range, showing hidden bullish divergence on lower timeframes.
QQE MOD: Flipping from bearish to bullish momentum.
ATR: Declining volatility post-drop indicates possible accumulation before breakout.
After a sharp pullback, BTC is stabilizing above a demand zone and forming a potential base. As long as price remains above ~$117,800, there's confluence for a continuation higher, with the outlined TP levels offering natural exit points for partial or full profits.
BTCUSDT.5S trade ideas

BTC AI Prediction Dashboard - 6h Price Path (18.07.25)
Prediction made using Crypticorn AI Prediction Dashboard
Link in bio
BTCUSDT Forecast:
Crypticorn AI Prediction Dashboard Projects 6h Price Path (Forward-Only)
Forecast timestamp: ~11:30 UTC
Timeframe: 15m
Prediction horizon: 6 hours
Model output:
Central estimate (blue line): -118,806
Represents the AI’s best estimate of BTC’s near-term price direction.
80% confidence band (light blue): 118,801 – 119,424
The light blue zone marks the 80% confidence range — the most likely area for price to close
40% confidence band (dark blue): 118,228 – 119,973
The dark blue zone shows the narrower 40% confidence range, where price is expected to stay with higher concentration
Volume on signal bar: 171.10
This chart shows a short-term Bitcoin price forecast using AI-generated confidence zones.
Candlesticks reflect actual BTC/USDT price action in 15-minute intervals.
This helps visualize expected volatility and potential price zones in the short term.

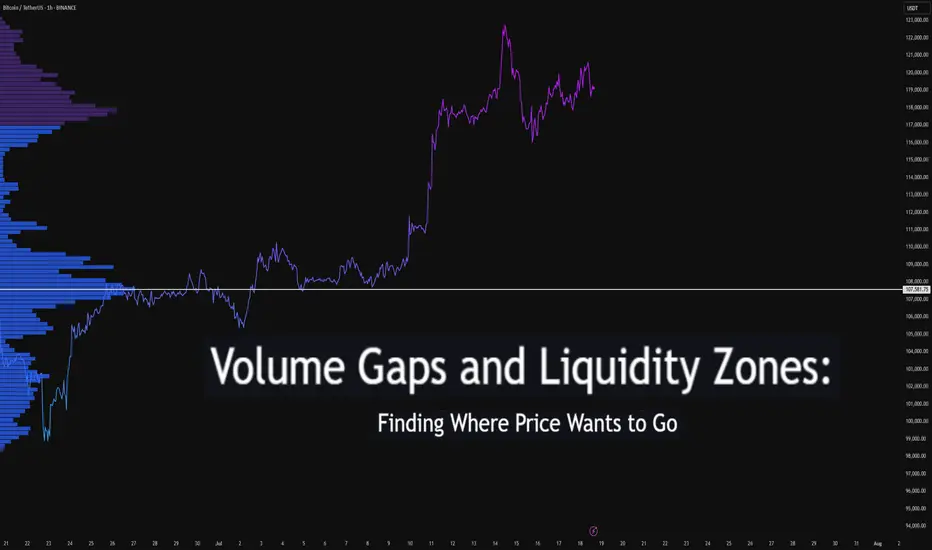
Volume Gaps and Liquidity Zones: Finding Where Price Wants to GoDifficulty: 🐳🐳🐳🐋🐋 (Intermediate+)
This article is best suited for traders familiar with volume profile, liquidity concepts, and price structure. It blends practical trading setups with deeper insights into how price seeks inefficiency and liquidity.
🔵 INTRODUCTION
Ever wonder why price suddenly accelerates toward a level — like it's being magnetized? It’s not magic. It’s liquidity . Markets move toward areas where orders are easiest to fill, and they often avoid areas with little interest.
In this article, you’ll learn how to identify volume gaps and liquidity zones using volume profiles and price action. These tools help you anticipate where price wants to go next — before it gets there.
🔵 WHAT ARE VOLUME GAPS?
A volume gap is a price region with unusually low traded volume . When price enters these areas, it often moves quickly — there’s less resistance.
Think of a volume gap as a thin patch of ice on a frozen lake. Once the market steps on it, it slides across rapidly.
Volume gaps usually show up on:
Volume Profile
Fixed Range Volume tools
Session or custom volume zones
They’re often created during impulsive moves or news events — when price skips levels without building interest.
🔵 WHAT ARE LIQUIDITY ZONES?
Liquidity zones are price areas where a large number of orders are likely to be sitting — stop losses, limit entries, or liquidation levels.
These zones often form around:
Swing highs and lows
Order blocks or fair value gaps
Consolidation breakouts
Psychological round numbers
When price approaches these areas, volume often spikes as those orders get filled — causing sharp rejections or breakouts.
🔵 WHY THIS MATTERS TO TRADERS
Markets are driven by liquidity.
Price doesn’t just move randomly — it hunts liquidity, clears inefficiencies, and fills orders.
Your edge: By combining volume gaps (low resistance) with liquidity zones (target areas), you can forecast where price wants to go .
Volume gap = acceleration path
Liquidity zone = destination / reversal point
🔵 HOW TO TRADE THIS CONCEPT
1️⃣ Identify Volume Gaps
Use a visible range volume profile or session volume. Look for tall bars (high interest) and valleys (low interest).
2️⃣ Mark Liquidity Zones
Use swing highs/lows, OBs, or EQH/EQL (equal highs/lows). These are magnet areas for price.
3️⃣ Watch for Reactions
When price enters a gap, expect speed.
When it nears a liquidity zone, watch for:
Volume spike
Wick rejections
S/R flip or OB retest
🔵 EXAMPLE SCENARIO
A strong bearish move creates a volume gap between 103 000 – 96 000
Below 96 000 sits bullish order blocks — clear liquidity
Price enters the gap and slides fast toward 96 000
A wick forms as buyers step in, volume spikes — the reversal begins
That’s price filling inefficiency and tapping liquidity .
🔵 TIPS FOR ADVANCED TRADERS
Use higher timeframes (4H/1D) to define major gaps
Look for overlapping gaps across sessions (Asia → London → NY)
Align your trades with trend: gap-fills against trend are riskier
Add OB or VWAP as confirmation near liquidity zones
🔵 CONCLUSION
Understanding volume gaps and liquidity zones is like reading the market’s intention map . Instead of reacting, you start predicting. Instead of chasing, you’re waiting for price to come to your zone — with a plan.
Price always seeks balance and liquidity . Your job is to spot where those forces are hiding.
Have you ever traded a volume gap into liquidity? Share your setup below
The Setup: Bullish Breaker in Play!Yesterday, BTC smashed into a strong bullish breaker and bounced like a champ. Today, it’s retracing back to this key level, setting up for what I expect to be another explosive buy reaction. Why? Because this breaker is rock-solid, and the price action is giving us all the right signals! Plus, it’s Friday—the last trading day of the week—and I’m betting BTC will stretch its legs to cover the weekly range. 🏃♂️
🎯 Trade Details: Where to Jump In
Buy Area: Right now, the price is teasing the breaker zone.
Stop Loss: Protect your capital with a stop loss at around ~117,700.
Target: We’re aiming for the Buyside Liquidity sitting pretty around 121,000. That’s a juicy move with solid risk-reward potential! 💪
🧠 Why This Trade Makes Sense
Bullish Breaker Strength: This level has proven itself as a springboard for price action.
Weekly Range Play: Fridays often see BTC push to cover its weekly range, and we’re in prime position to catch it.
Liquidity Grab: The Buyside Liquidity at 121,000 is like a magnet for price—let’s ride it there!
⚠️ Risk Management Reminder
Always trade smart! Use proper position sizing, stick to your risk management rules, and don’t go all-in like it’s a casino. Keep those stops tight to avoid getting wrecked by any sudden volatility. 😎
💬 Join the Conversation!
What do you think of this setup? Are you jumping on this BTC train or waiting for more confirmation? Drop your thoughts in the comments below! 👇 Also, if you like this idea, smash that LIKE button ❤️ and follow for more trade ideas to keep your portfolio poppin’! 🚀
Happy trading, and let’s stack those pips! 💰
#BTC #CryptoTrading #BuyTrade #Bullish #TradingView

BTCUSDT Another correction and Bounce to topBTCUSDT strong support in the 1H timeframe, with quick rejection and recovery from the lower levels. This behaviour often signals stop-hunting activity, followed by a potential bullish reversal, suggesting accumulation by smart money.
📊 Key Technical Levels:
Immediate Resistance: 118,500
A break and 1H candle close above 118,500 would be a bullish trigger. If price holds and builds above this level, we could see momentum towards: 120,000 / 122,000 / 124,000 (next potential targets)
You May find more details in the chart.
PS: Support with like and comments for more analysis Thanks for Supporting.

Possible correction toward a 112,600$📥 On the lower timeframes, a head and shoulders pattern has formed, which could trigger selling pressure down to the 112,600 level in the short term. This correction on the lower timeframes might also cause a minor pullback in the altcoin market, potentially creating a good buying opportunity

Bitcoin (BTC): Small Correction Happening | Attentions at $116KBitcoin still looks bullish, with no major signs of potential sell-side movement to happen. The least we look for here is the retest of the current ATH, which is the $123K zone, and we will keep this game plan as long as the price stays above $116K.
If we see any signs of a breakdown happening, we might be heading for a bigger correction towards $108K (only if we see a break of $116K).
Swallow Academy

Bitcoin Bullish, but a Correction Might Be AheadHello traders!
Obviously, Bitcoin has a strong bullish momentum.
However, after noticing a minor shift in market structure, we may see a correction toward the 112,000 area.
If the supply area doesn’t break, we can look for a sell position here.
#BTC #Bitcoin

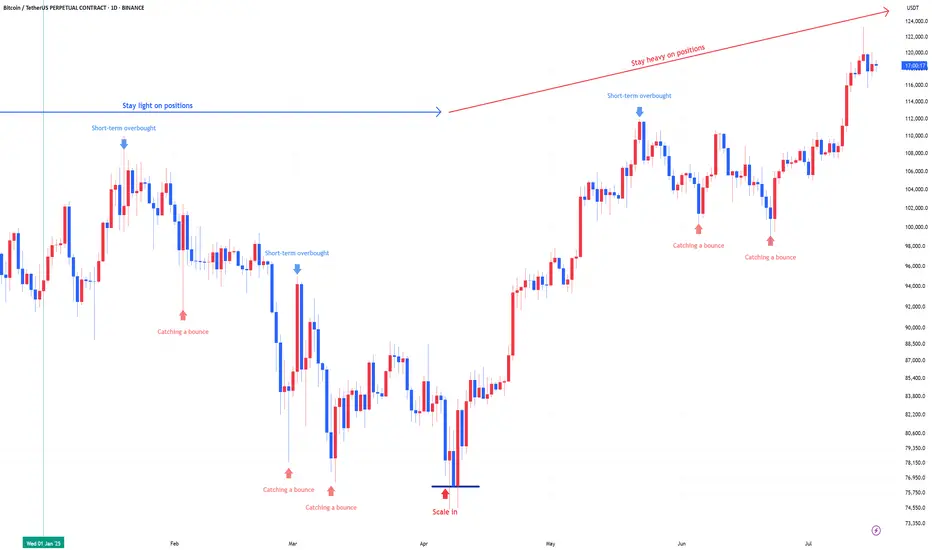
Bitcoin : Stay heavy on positionsApril was the scale-in zone:
Back in April, the US stock market flashed a split-entry buy signal—a classic zone for gradual accumulation.
That same setup applied to Bitcoin. Buying the fear worked again.
We’ve moved out of the fear zone:
Both Bitcoin and equities have left the extreme fear territory behind. Sentiment has shifted.
Short-term overbought now:
Bitcoin is currently in a short-term overbought phase. Some consolidation or cooling off is natural here, but no major trend reversal signs yet.
Stay heavy on positions:
I’m maintaining an overweight position in Bitcoin as long as the US stock market stays intact. The Nasdaq is holding up, so Bitcoin likely stays in risk-on mode.
Warning:
If US equities take a hit, expect Bitcoin to follow.
Negative moves in the stock market will likely translate directly into crypto weakness.
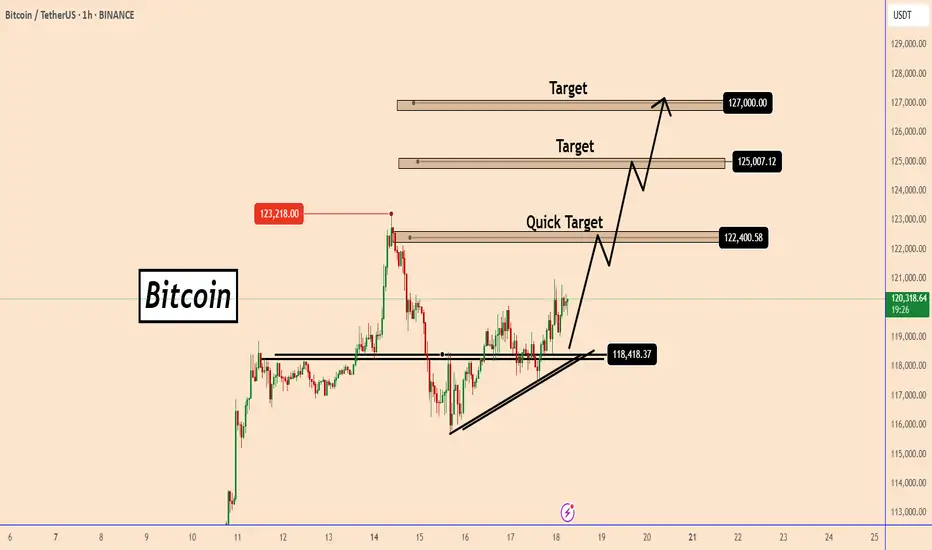
BTC - Make way for $126k!SO likely YOO, If it holds the orange box it gets to that part as supposed!

BTC Could Start Another Bullish WaveBTC Could Start Another Bullish Wave
Over the past two days, bitcoin has been holding strong above 118400. It seems that this small structural area could push BTC higher.
For now, ETH has performed better and BTC may follow suit.
I am looking for short-term targets near 122400, 125000 and 127000.
You may find more details in the chart!
Thank you and Good Luck!
PS: Please support with a like or comment if you find this analysis useful for your trading day
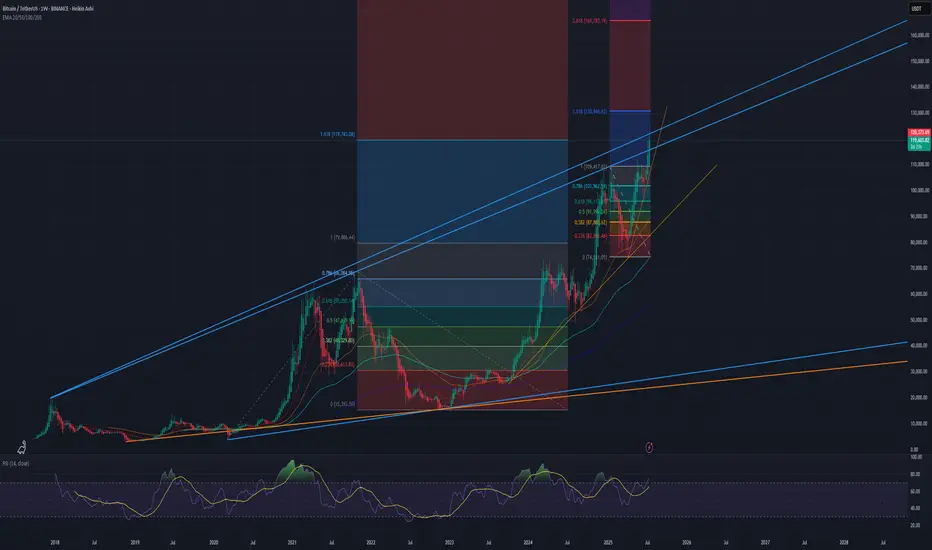
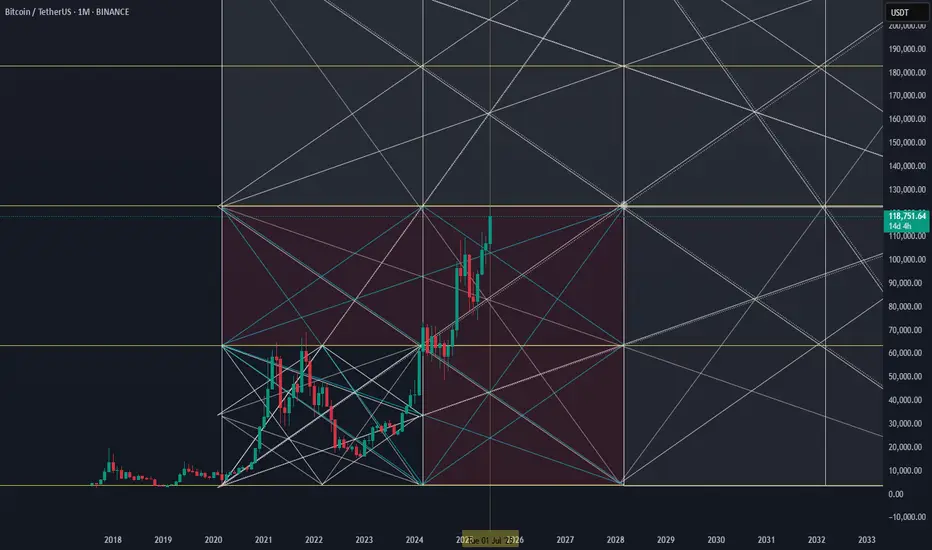
Bitcoin is ULTRA MEGA Bullish!See the trend lines and fib levels for your resistance and support levels. It's great that Bitcoin is breaking through the blue trend line on top. If it chops sideways here for a while at this level, this will serve as a strong new support level for bitcoin when it comes back down in Q4.
I believe $130k is the lowest potential target for bitcoins ATH this cycle. Until that level is approaching, I'm ultra mega bullish and trading altcoins with leverage. USDT Dominance and BTC Dominance are in free fall right now so altcoins are pumping hard while bitcoin chills at the resistance levels.
Check support at 115854.56-119086.64
Hello, traders.
If you "Follow", you can always get new information quickly.
Have a nice day today.
-------------------------------------
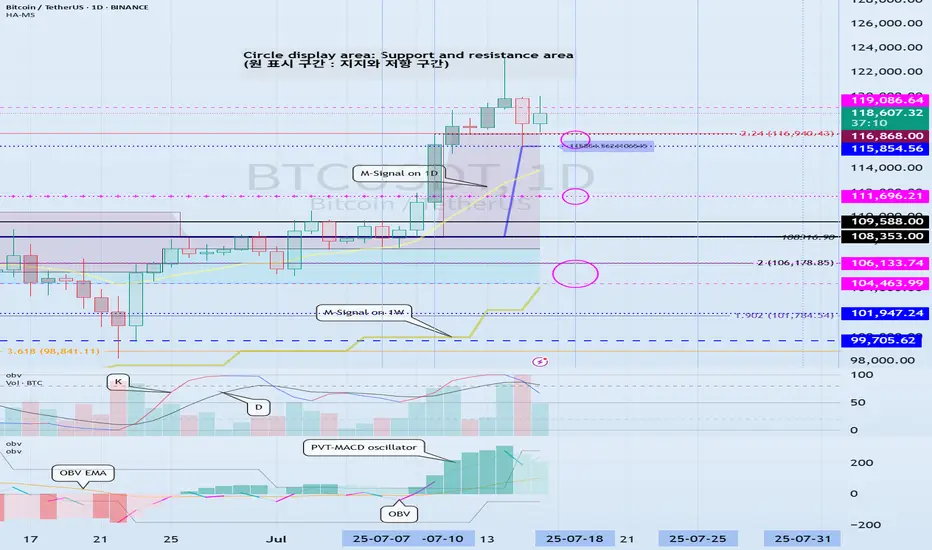
(BTCUSDT 1D chart)
On the 1W chart, the DOM(60) indicator was created at the 119086.64 point.
Accordingly, the key is whether it can be supported near 119086.64.
The meaning of the DOM(60) indicator is to show the end of the high point.
In other words, if it rises above HA-High ~ DOM(60), it means that there is a high possibility of a stepwise upward trend.
On the other hand, if it fails to rise above DOM(60), it is likely to turn into a downtrend.
The basic chart for chart analysis is the 1D chart.
Therefore, if possible, check the trend of the 1D chart first.
The DOM(60) indicator of the 1D chart is currently formed at the 111696.21 point.
And, the HA-High indicator was created at the 115854.56 point.
Therefore, since it cannot be said that the DOM(60) indicator of the 1D chart has been created yet, if the price is maintained near the HA-High indicator, it seems likely to rise until the DOM(60) indicator is created.
We need to look at whether the DOM(60) indicator will be created while moving sideways at the current price position or if the DOM(60) indicator will be created when the price rises.
If the price falls and falls below 111696.21, and the HA-High indicator is generated, the HA-High ~ DOM(60) section is formed, so whether there is support in that section is the key.
-
Since the DOM(60) indicator on the 1W chart was generated, if it fails to rise above the DOM(60) indicator, it is highly likely that the HA-High indicator will be newly generated as it eventually falls.
Therefore, you should also look at where the HA-High indicator on the 1W chart is generated when the price falls.
-
The next volatility period is around July 18 (July 17-19).
Therefore, you should look at which direction it deviates from the 115854.56-119086.64 section after this volatility period.
Since the K of the StochRSI indicator fell from the overbought section and changed to a state where K < D, it seems likely that the rise will be limited.
However, since the PVT-MACD oscillator indicator is above 0 and the OBV indicator is OBV > OBV EMA, it is expected that the support around 115845.56 will be important.
-
Thank you for reading to the end.
I hope you have a successful trade.
--------------------------------------------------
- Here is an explanation of the big picture.
(3-year bull market, 1-year bear market pattern)
I will explain the details again when the bear market starts.
------------------------------------------------------
BTC/USD bearish conf. finally?BTC printed a double top on the 5m and on the 1h.
BTC being very weak all over the day, even running against ETH and co.
That might be the signal for the retracement "everybody" is waiting for.
BYBIT:BTCUSDT.P

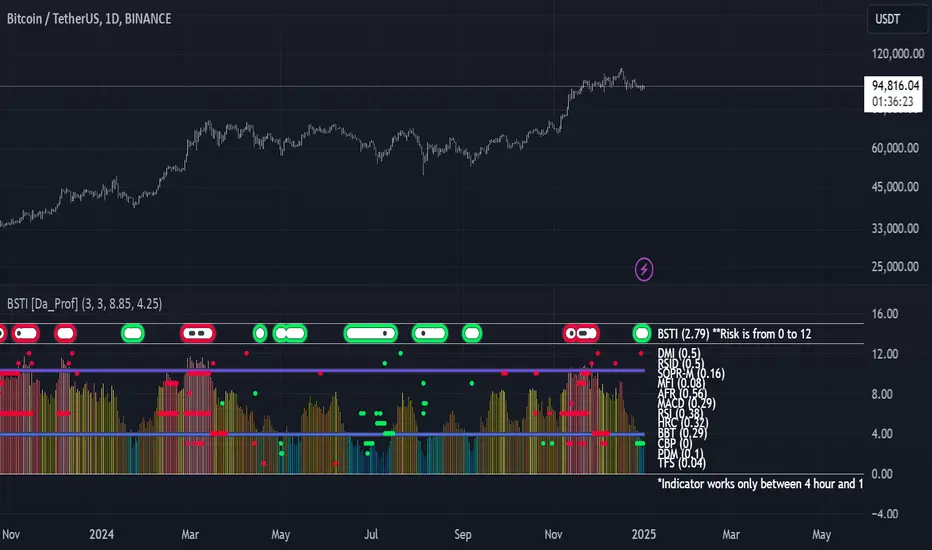
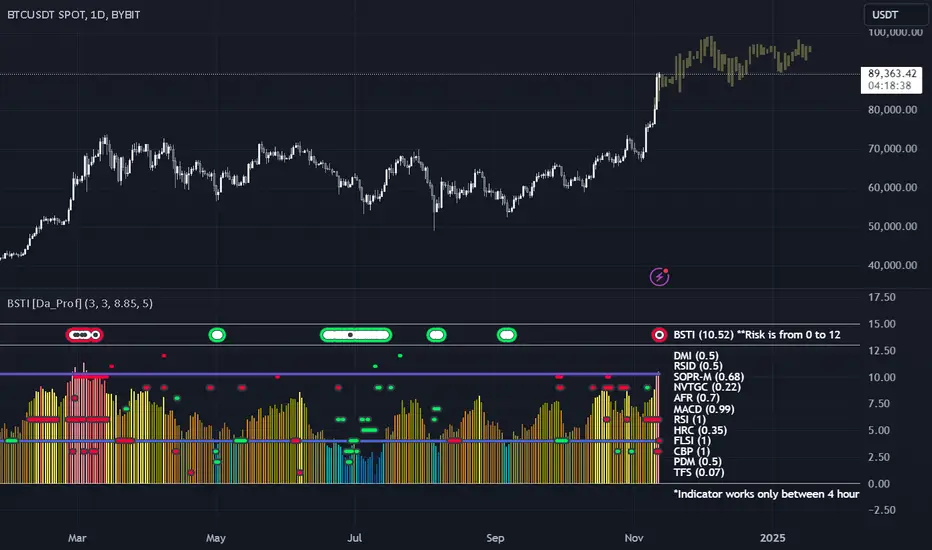
The $BTC Swing Indicator Signals Low RiskHappy New Year! The indicators that make up the Bitcoin Swing Trade Indicator (BSTI) are bottoming in aggregate. I've been searching for nice daily swing trade indicators and have been swapping them out in the BSTI. Therefore, the BSTI has gone through changes, but it is almost ready for prime time. I'm thinking of changing out one more indicator. The solid ones I'm keeping are the SOPR momentum, money flow, aggregate funding rate (AFR), MACD, RSI, hash rate capitulation, Bollinger band trend, Coinbase premium, plus directional movement, and the transaction fee spike indicators. Besides the AFR, which is neutral, the indicators are signaling generally low risk.
--Da_Prof
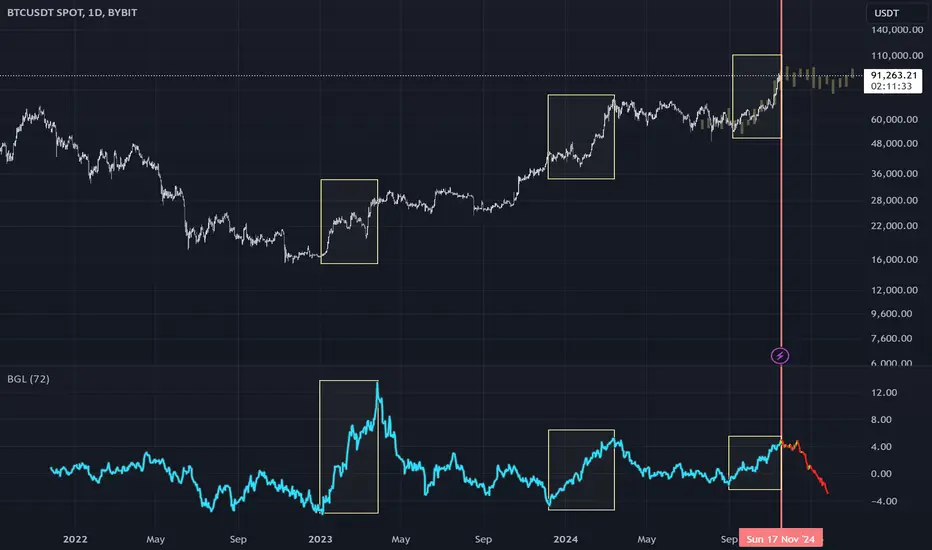
Global liquidity downtrend cometh!During this current BTC cycle, major uptrends in global liquidity have corresponded to major uptrends in the market 72ish days later. The last major uptrend in liquidity is about to run its course, pause, and then downtrend. If this relationship holds, we are at or near at least a pause in the local up trend. I have my popcorn ready to see if this plays out.
Note: The global liquidity prediction pauses until December 11th and then downtrends, so if we see floating higher prices until that point and then a pause, the relationship would still be valid.
Second Note: I will publish the BGL (Bitcoin Global Liquidity) indicator very shortly. Please test it out and DM me if you see any issues or have suggestions.
--Da_Prof
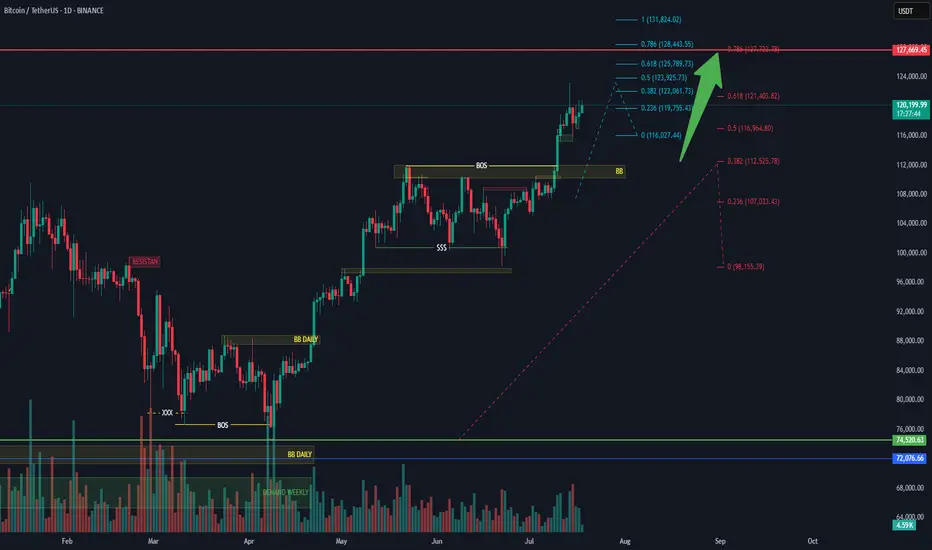
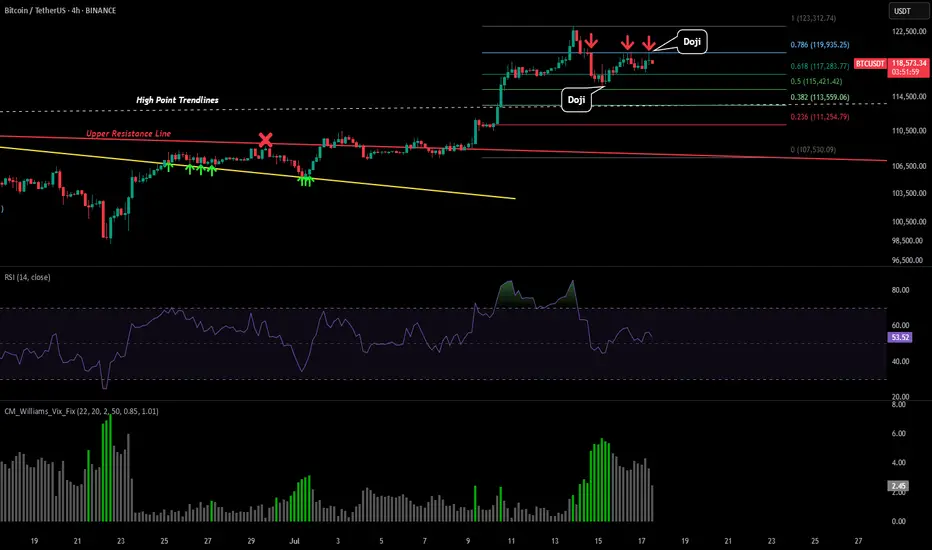
BTC - 0.786 LTF StrugglePlease refer to our previous post:
If you look at the predictive fib model we presented in our last post, we are starting to get more accurate developments. Today we just saw another rejection at our 0.786 predictive fib level with a potential reversal doji.
That is now 3 touchpoints of resistance right around $120k (which is also inline with the 1.618 extension).
Therefore if price starts to decline the predictive price targets to the downside remain in place.
Still bullish on BTC, but this will be the LAST UP SWING!Take Profit around 130K.
Daily close above 133K will fail the analysis.

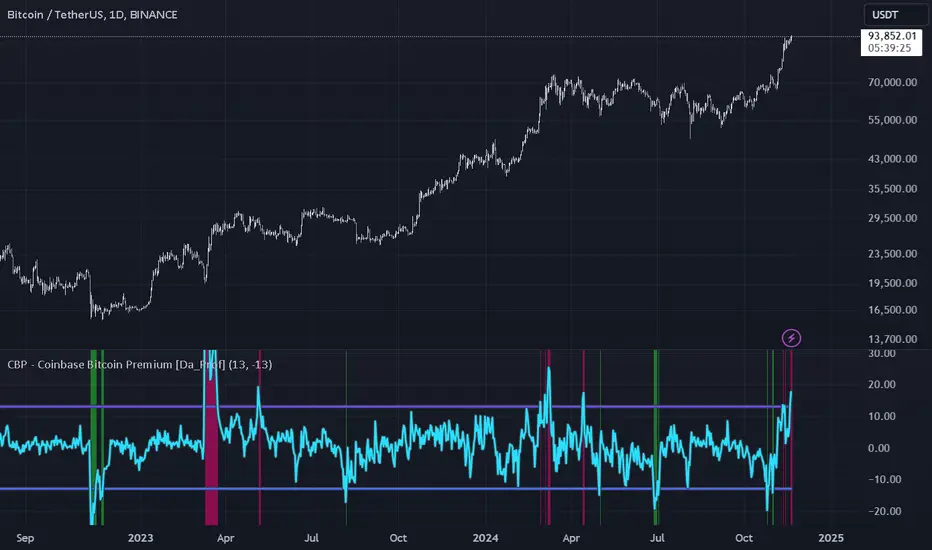
Coinbase Premium indicates High Risk on BTCThe Coinbase Premium Indictor shows the CBP risk is high. The previous times the CBP premium has reached these levels, CRYPTOCAP:BTC generally started a range or downtrend.
BTSI signals high riskThe BTSI has signaled a high risk area for BTC. These can happen and price can still go up for a while until a bear deviation. The bars pattern is what happened the last time.
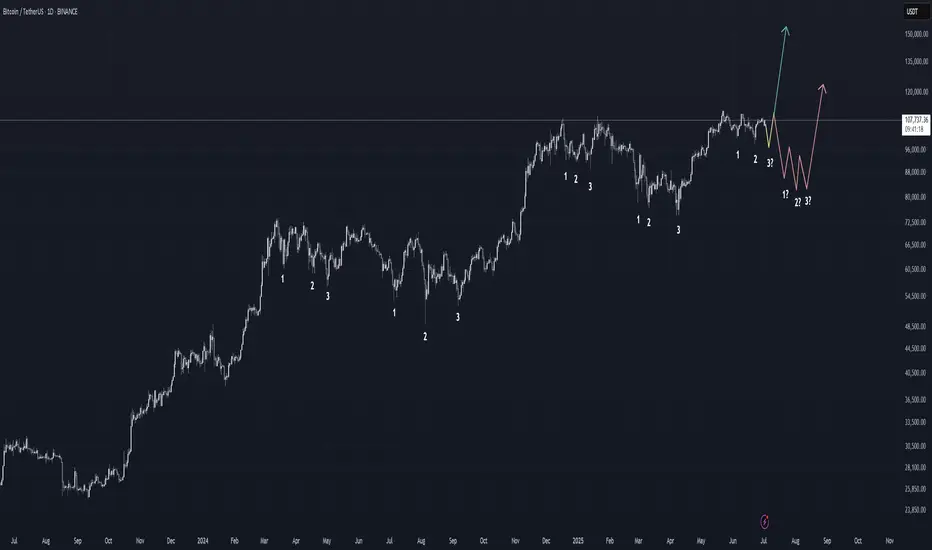
BTC third tap incoming? Recently, BTC has traded for a large amount of time in ranging environments. These ranges have started with a local range high and then an initial 3-tap accumulation (i.e., a local low and then two sweeps of that low) before making a solid attempt at the range highs. The sweeps of the lows are meant to shake people out and provide fuel to try to break higher. The previous two times, that initial attempt failed and the price was sent lower to put in a second 3-tap accumulation at lower prices.
Will the current price move back down to put in the 3rd tap of the current relatively small accumulation? That is my base case. I believe we will see some lower prices locally to put in the 3rd tap. I think the Bitcoin Swing Trade Indicator (BSTI) will fire off green one more time and then we will then make a run to try to break out of this current massive range (that started last year in November). This current range is fairly small, so it is not worth it to me to sell here to try to buy lower.
The bigger question is: Will we have enough fuel to durably break out of this range after the 3rd tap of the current accumulation (green line) or are we destined to repeat the pattern of the last two bigger ranges (red line), one of which we are still in? I personally believe we will break out after the smaller range 3rd tap (the green line) based on the larger context of cycle theory, how long we have been in this range, and how the current small range is part of the larger range starting back in November 2024.
It will be interesting to see what happens.
Da_Prof
Note that TV won't allow publication of a private/unpublished indicator anymore or I would have shown the BSTI, which is now published as invite only. It's implementation is too complicated to publish openly, so I don't feel comfortable doing that. If you want access, please DM me on TradingView. Thanks.