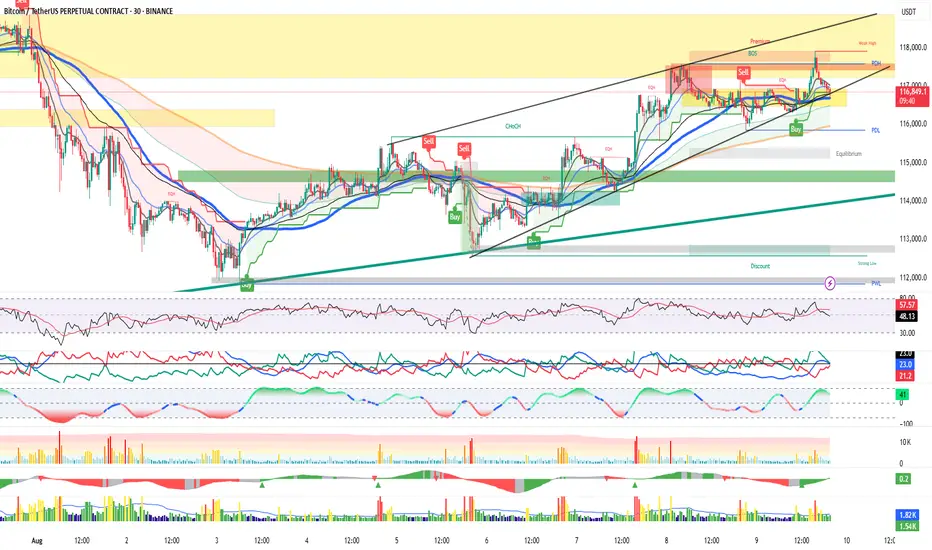
BTC/USDT — All-in-one MTF Map & Trade Plan (30m/4H/1D/1W)Summary: HTF uptrend intact; price is compressing inside a rising channel just under 117.4–117.6 (PDH/supply/premium edge). Intraday path: hold 116.7–116.9 → retest 117.4; lose 116.7 → slide to PDL/EQ.
Structure
Weekly: HH/HL above trendlines; weak high ~120k remains a magnet if 118k clears.
Daily: Riding 21/50D EMAs in an ascending channel; shallow pullbacks bought.
4H: Repeated rejections at 117.4–117.6; higher lows along inner trendline.
30m: Tap of channel/EMA confluence 116.7–116.9 after a PDH sweep; momentum neutral.
Key Levels
R1: 117.4–117.6 (PDH/EQH)
R2: 117.9–118.2
R3: 119.6
R4: 120.0k (weak high/liquidity)
S1: 116.9–116.7 (trendline + EMAs)
S2: 116.1 (PDL)
S3: 115.5–115.0 (Equilibrium block)
S4: 114.9–114.4 (demand)
S5: 112.8–112.2 (discount/“strong low”)
Momentum / Volume
RSI mid-50s (room either way).
ADX ~23 (trend mild) → next break likely expands.
Sell wicks at PDH; lighter pullback volume favors bounce if S1 holds.
Setups (If-Then)
Breakout Long: 30m/4H close >117.6 → 117.9/118.2 → 119.6 → 120k.
Invalidation: swift slip <117.2.
Range Long (buy the dip): Bullish reaction at 116.7–116.9 → 117.0 → 117.4–117.6.
Invalidation: 30m close <116.7.
Breakdown Short: Clean 30m close <116.7 then <116.0 → 116.1 → 115.5–114.6; stretch 112.8.
Invalidation: reclaim >116.9.
Bias: Neutral-to-bullish above 116.7 (look for 117.4 retest / 118k squeeze). Bearish below 116.7, targeting PDL → EQ. Wait for edge breaks; avoid mid-range chop 117.0–117.3.
BTCUSDT.5S trade ideas
Bitcoin & strong supportBitcoin is holding above 50MA and 61% of Fibonacci, it also has bullish divergence on RSI with bullish engulfing candle. upside movement is coming soon
$BTC Is Bullish: Bull Flag + Liquidity sweep + RSI DivI see higher targets for bitcoin. right now Bitcoin is forming a bullish flag, two times it has targeted short stops, and on the 4H timeframe we also have an RSI divergence.
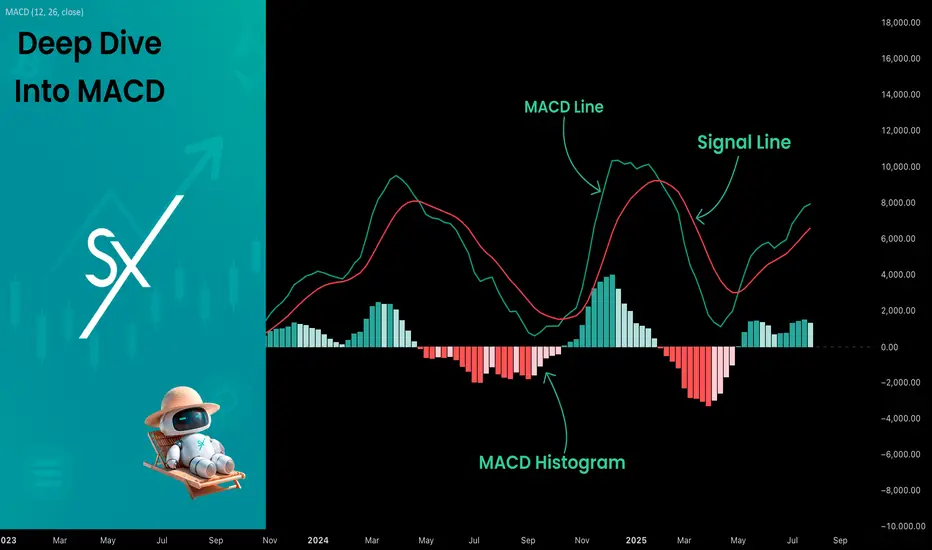
Deep Dive Into Moving Average Convergence Divergence (MACD)🗓 The Moving Average Convergence Divergence (MACD) is one of the most popular momentum indicators in technical analysis. Whether you're a beginner or an experienced trader, understanding how the MACD works can significantly enhance your trading decisions.
📚 Introduction: What Is MACD and Why It Matters
The MACD (Moving Average Convergence Divergence) is one of the most powerful and widely used momentum indicators in technical analysis. It was developed by Gerald Appel in the late 1970s and has since become a staple in the toolkit of traders and investors across markets — from stocks and forex to cryptocurrencies.
At its core, MACD helps traders understand the relationship between two moving averages of an asset’s price, providing insight into both trend direction and momentum strength. By analyzing how these averages converge and diverge, the indicator offers valuable signals for entries, exits, and trend reversals.
What makes MACD especially popular is its versatility — it works well in trending markets, can be used across all timeframes, and combines both leading and lagging components. Whether you're a day trader or a long-term investor, understanding how MACD works gives you an edge in making timely and informed trading decisions.
📚 How the MACD Is Calculated: The Components Explained
The MACD is built from three core components: MACD line, Signal line and MACD histogram.
🔹 Calculating the MACD Line:
The MACD line is the difference between two Exponential Moving Averages (EMAs), typically 12-period EMA (fast) and 26-period EMA (slow). The formula is:
MACD Line = EMA(12) − EMA(26)
This line captures momentum by tracking how the shorter-term average diverges from the longer-term average. When the MACD line rises, the short-term momentum is increasing faster than the longer-term trend — a sign of bullish acceleration. The reverse implies bearish momentum.
🔹 Calculating the Signal Line:
To reduce noise and provide clearer signals, a 9-period EMA of the MACD line is plotted on top. This is the Signal Line, and it acts as a trigger:
When the MACD line crosses above the signal line → bullish signal (buy)
When the MACD line crosses below the signal line → bearish signal (sell)
Signal Line = EMA(9)(MACD Line)
🔹 Calculating the MACD Histogram:
The Histogram shows the difference between the MACD Line and the Signal Line:
Histogram = MACD Line − Signal Line
It provides a visual representation of momentum strength. The histogram bars expand when momentum strengthens and contract as it fades. It helps you spot shifts in momentum earlier than a basic crossover.
📚 How to Use MACD in Trading Strategies
⚡️MACD Signal Line Crossover
Buy Signal:
MACD Line crosses above the Signal Line from below (bullish crossover)
Preferably when both lines are below the zero line (early in the trend)
Price closes above the long-term trend approximation, in our case we use 200-period EMA
Sell Signal:
MACD Line crosses below the Signal Line from above (bearish crossover)
Preferably when both lines are above the zero line (early in the trend)
Price closes below the long-term trend approximation, in our case we use 200-period EMA
📈Long Trading Strategy Example
1. Wait until MACD line crosses over the Signal line from down to up. In our example we use 1D time frame for BITMART:BTCUSDT.P . Open long trade if point 2 will be completed.
2. Price candle shall be closed above the 200-period EMA. This is long-term trend filter to increase the probability that trades will be open only in the direction of the main trend.
3. Close the long trade when the MACD line crosses under the Signal line. This is an approximation that short-term impulse is over and correction is about to start.
In our case we have +20% return on this long trade, but, please, notice that we have not used initial stop-loss in this strategy. Trade was closed according to the technical condition, this approach can violate the risk management rules, but also can be applicable if you trade the amount ready to lose using this strategy. We will talk about stop-loss later.
📉Short trading strategy example
1. Wait until MACD line crosses under the Signal line from up to down. In our example we use 1D time frame for BITMART:ETHUSDT . Open short trade if point 2 will be completed.
2. Price candle shall be closed below the 200-period EMA. This is long-term trend filter to increase the probability that trades will be open only in the direction of the main trend.
3. Close the short trade when the MACD line crosses over the Signal line. This is an approximation that short-term impulse is over and correction is about to start.
In this case we have +15% return on the short trade. Again, strategy used the technical condition to close the trade and now let's cover how to place the stop-loss. There is no right answer how to use stop-losses. The first and the most obvious way to place stop-loss is using recent swing low/high, but the problem is that all traders are seeing them and do the same. Price tends to reach such levels to collect liquidity.
Another one way to place stop-loss is using the signal candle's high/low. This is so-called 1 candle stop-loss. Usually it's very tight and can allow to have the fantastic risk to reward ratio, but we are now recommend to use it if you are not a professional trader because win rate of such strategy decreases.
Third approach in placing stop-loss which we often use in our algorithmic strategies is the Average True Range (ATR). ATR is the volatility measurement, it allows to take into account the current volatility. Sometimes it helps to avoid the stop-loss hit when trade finally goes in your direction. You can just simply subtract (in case of long trade) or add (in case of short trade) ATR value to the entry price and obtain the dynamic stop loss based on current market condition. Also multiplier can be used for ATR. You shall choose the approach which is more comfortable for you, backtest all these approached to make your choice.
🧪Important: we used the long signals only below the zero-line and short signals above it in the attempt to catch the beginning of a trend and have large potential move. On the picture below you can see the same BITMART:BTCUSDT.P , but what will happen if we open long on the lines crossover above zero line? This trade will not be profitable because of restricted potential.
⚡️MACD Zero Line Crossover
Buy Signal:
MACD Histogram crosses above the zero line (momentum shifts from bearish to bullish)
Price closes above the long-term trend approximation, in our case we use 200-period EMA
Sell Signal:
MACD Histogram crosses below the zero line (momentum shifts from bullish to bearish)
Price closes below the long-term trend approximation, in our case we use 200-period EMA
📈Long Trading Strategy Example
1. Wait until MACD Histogram crosses over zero line. Open long trade if point 2 will be completed.
2. Price candle shall be closed above 200-period EMA. This is long-term trend filter to increase the probability that trades will be open only in the direction of the main trend.
3. Take profit when price reaches 3:1 risk to reward ratio according to the stop-loss from point 4.
4. Stop-loss shall be placed below recent swing low. This point can be discussed, you can use any stop-loss technique described earlier in this article. We demonstrate the simplest one, the key here is using at least 3:1 RR.
📉Short trading strategy example
1. Wait until MACD Histogram crosses under zero line. Open short trade if point 2 will be completed.
2. Price candle shall be closed below 200-period EMA. This is long-term trend filter to increase the probability that trades will be open only in the direction of the main trend.
3. Take profit when price reaches 3:1 risk to reward ratio according to the stop-loss from point 4.
4. Stop-loss shall be placed above recent swing high. This point can be discussed, you can use any stop-loss technique described earlier in this article. We demonstrate the simplest one, the key here is using at least 3:1 RR.
⚡️MACD Divergence Strategy
MACD Divergence is a strategy that helps traders identify potential reversals in market direction before they become obvious on the price chart. This makes it a favorite tool among swing traders and crypto enthusiasts looking to catch major moves early.
But what exactly is a divergence? In simple terms, divergence occurs when price and momentum (MACD) are moving in opposite directions — signaling that the current trend may be losing strength and preparing for a reversal. There are two main types of divergence.
🐂 Bullish Divergence
Price makes a lower low
MACD Histogram makes a higher low
This suggests that while price is still falling, downward momentum is weakening. The bears are losing control, and a bullish reversal may be near. Trading signal is very simple, when bullish divergence happens wait for the first increasing column on MACD histogram and open long trade. Place stop-loss under recent swing low and take profit at 3:1 RR.
🐻Bearish Divergence
Price makes a higher high
MACD makes a lower high
This suggests that while price is still falling, downward momentum is weakening. The bears are losing control, and a bullish reversal may be near. Trading signal is very simple, when bearish divergence happens wait for the first decreasing column on MACD histogram and open short trade. Place stop-loss above recent swing high and take profit at 3:1 RR.
🧪 Important hint: MACD histogram shall cross the zero line between two lows/high to create the most reliable divergence signals. We are not recommend to use it without zero-line crossover to decrease number of false signals.
📈Long Trading Strategy Example
1. MACD Histogram shall create higher low.
2. Price shall create lower low.
3. MACD Histogram shall cross the zero line between lows.
4. MACD Histogram shall show the first increasing column.
5. Put stop-loss under the recent swing low.
6. Put take profit at 3:1.
🧪 You can enhance the long signal with the MACD Line divergence. In our case we have both divergences: with MACD Histogram and MACD Line.
📉Short trading strategy example
1. MACD Histogram shall create lower high.
2. Price shall create higher high.
3. MACD Histogram shall cross the zero line between lows.
4. MACD Histogram shall show the first decreasing column.
5. Put stop-loss above the recent swing high.
6. Put take profit at 3:1.
🧪Divergence is extremely strong signal, but when price continue it's move in the direction of a trend and it's not reversing it can also be the signal for the trend continuation. This situation is called "Baskerville Hound" signal, this name was given by famous trader Alexander Elder. We don't recommend to use it for novice traders, but it's useful to know about it.
📚 Conclusion
The Moving Average Convergence Divergence (MACD) is more than just a crossover tool — it's a powerful momentum indicator that offers deep insight into the strength, direction, and timing of market trends. By understanding how the MACD line, Signal line, and Histogram interact, traders can uncover early trend shifts, spot momentum divergences, and time entries and exits with greater confidence.
Whether you're a short-term trader using fast crossovers for scalping or a long-term investor watching for weekly divergences, MACD can adapt to your style when used thoughtfully. Like all indicators, it works best when combined with price action, support/resistance levels, and other indicators — not in isolation.
Ultimately, mastering MACD is not about memorizing patterns, but about learning to read the story of momentum that unfolds beneath the surface of price. With disciplined application and practice, MACD can become a reliable compass in your trading strategy.
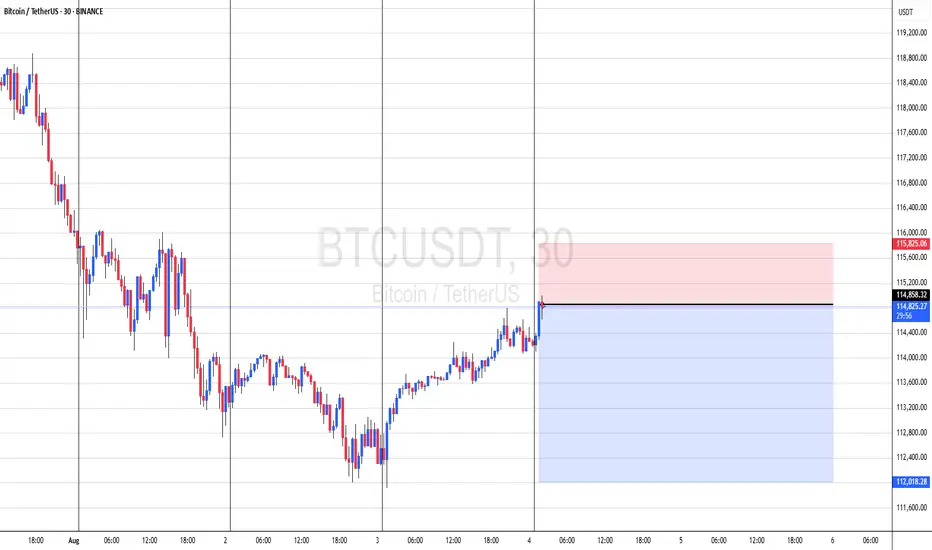
$BTC 1HR TA CRYPTOCAP:BTC Survived the pressures of war and tariffs and bounced well off the 112 zone. The market proved the bulls still have control.
But It's Friday and we know the markets tend to get pull back and get choppy... I'm expecting CRYPTOCAP:BTC to pull back some.

BTCUSD : Short levelHere is a great entry point for those who scalp this instrument or pips. The level is marked with a red arrow. It will be active until I report. It may become inactive over time.
Watch out for trading on the news.

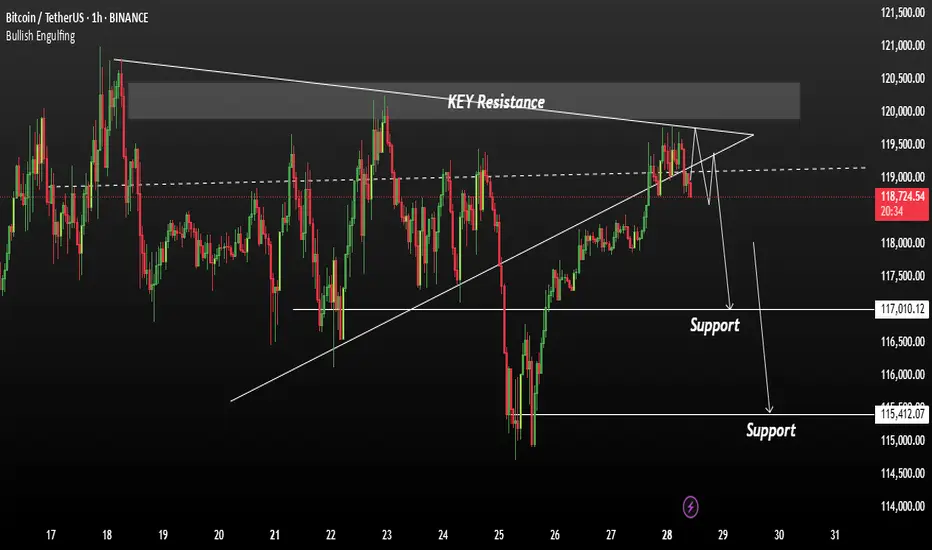
Bitcoin Could Accept bearish TrendBitcoin is currently testing a key resistance zone between 120,000 and 121,000. While price action is attempting to break higher, market conditions suggest the possibility of a false breakout rather than a sustained bullish continuation.
BTC has approached a significant resistance band, and early signs of exhaustion are visible. Unless the price decisively holds above 121,000, any breakout may lack conviction. Given the broader unresolved downtrend, a corrective move remains likely.
If the breakout fails to sustain, we anticipate a pullback toward the 117,000 to 115,000 range. This would align with a retest of previous support zones and continuation of the short-term bearish structure.
Ps: Support with like and comments for better analysis Thanks.
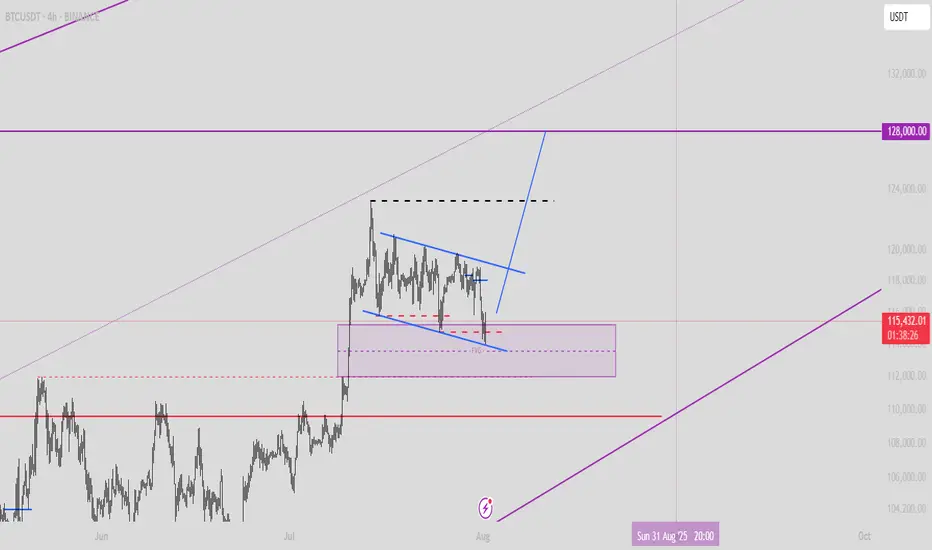
BTC is just beginning its correction🌐 As always, people like to find meaning in everything to make life seem simpler and more meaningful. So, once again, Trump has been blamed for the market crash.
Probably, if it weren't for geopolitics, Bitcoin would have grown indefinitely, and no one would have taken profits, but simply admired the numbers in their accounts 😁
But this is the real world, and BTC has long been asking for a correction along with the entire market, which I have been talking about for a long time in my ideas.
That is why this is not just a dip, but the likely beginning of a full-scale correction:
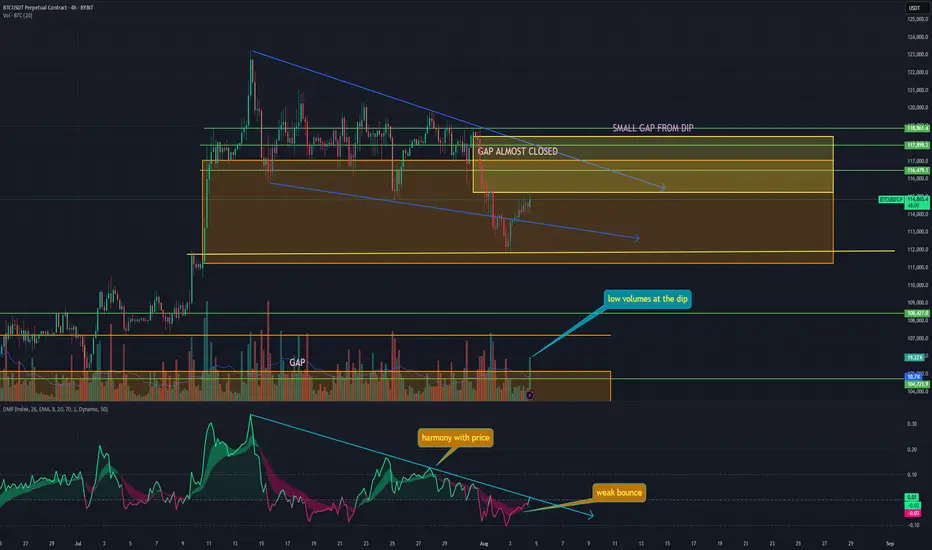
➡️ Last week's decline was expected because there is a GAP at $117,000 - $111,245 at these levels. Now that it is almost closed, a new GAP has formed during the decline at $118,403 - $115,245.
➡️ Volume - The volume of purchases at this price is simply negligible; no one wants to buy the dip even at $112,000. In addition, a divergence has been forming since last week in the volume of purchases, which has been declining for a long time.
➡️ Money Flow - very little liquidity entered on the rebound. This signals a lack of interest in buying the dip. The indicator is firmly in negative territory.
➡️ The price has also returned to the boundaries of the descending flag. Technically, this means a probable rebound to $118,000, the upper boundary of the flag, where the GAP is practically ending.
📌 Conclusion:
The main question now is: what next? Either we go higher and close the GAP from above, or we go down to retest the bottom from Sunday and close the GAP.
So far, everything points to the second scenario being more likely.
✍️ What do you think will happen next for BTC?
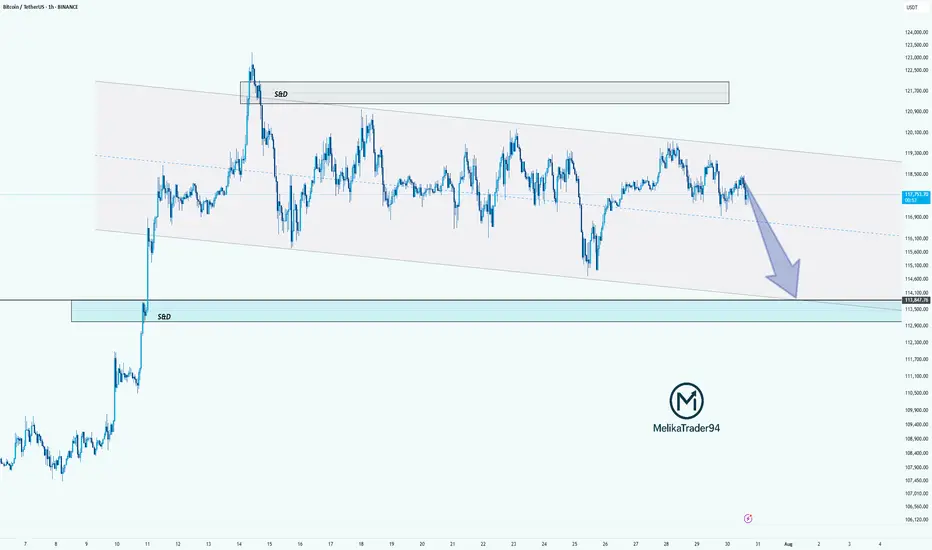
BTC: in a new drop?!Hello guys!
btc is running in a descending channel!
However, the upper level is broken up, but it could reach the upper level after a drop here!
I am not sure about this analysis!
What do you think about it?
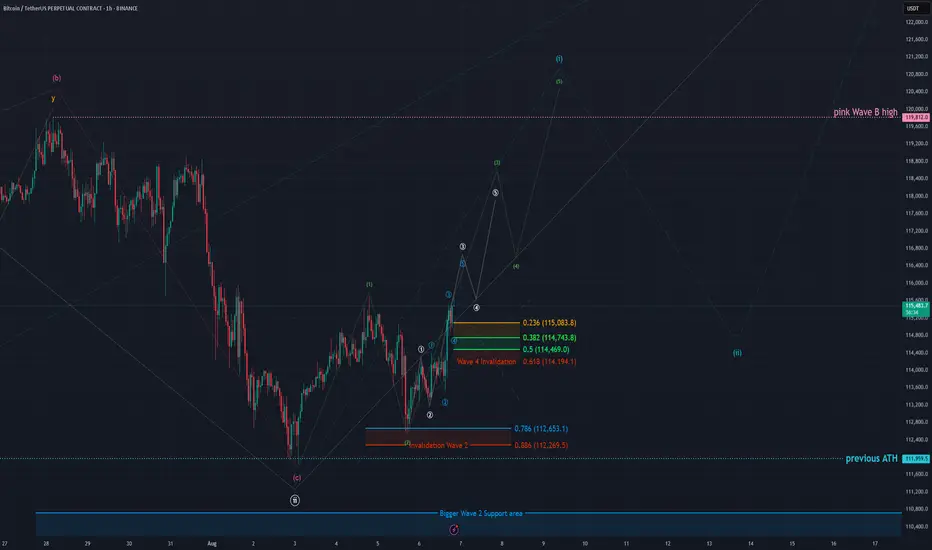
BTC - 1H Elliott Wave Analysis - 06.08.25Welcome to our Elliott Wave Count for Bitcoin!
We have seen a decent reaction to the upside from our Wave 2 support area.
We did remove the bearish red Wave count even if it hasn't been strictly invalided yet but we think it keeps the chart cleaner. Additionally if we take the recent high at 115'686 USD we would have an overlap of red Wave 2 and 4 which would decrease the probabilities of the bearish count.
It appears that we held the Wave 2 support and got a decent reaction to the upside.
At the moment we are continue to see the price surge to the upside.
We did add some Elliott Wave counts displayed each in 5 Waves in turquoise, white and green to help keep track of the price development.
Additionally we added a provisional support area for Wave 4 of the white count.
It sits between the 0.5 FIB at 114'469 USD and the 0.236 FIB at 115'083 USD with the invalidation at the 0.618 FIB at 114'194 USD.
Be aware that the support area moves with the price surging.
Preferable we stay above that support area.
Thanks for reading.
We would appreciate a follow and boost if you like the analysis! :)
NO FINANCIAL ADVICE.
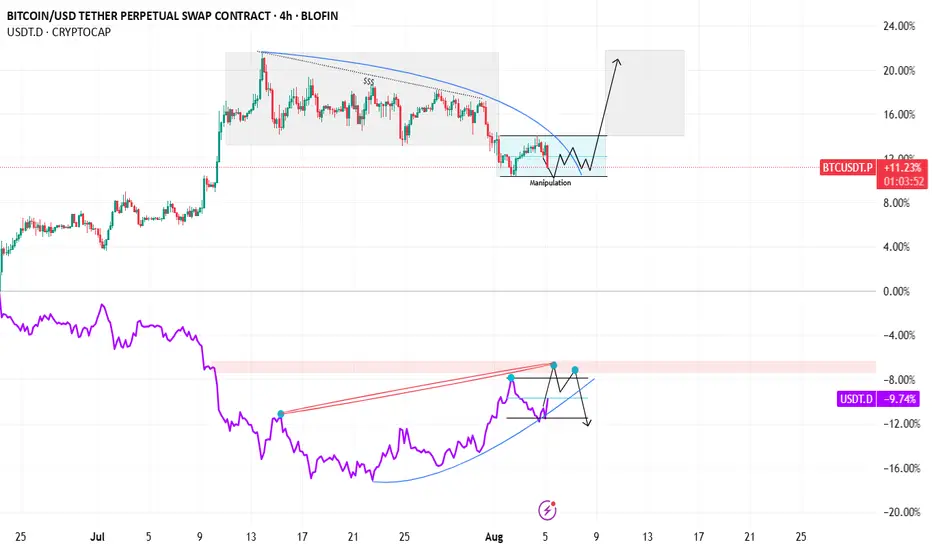
BTC PO3 setup with USDT D confluenceBTC PO3 with USDT D confluence.
BTC is in a LTF Range, where we can accumulate at the range low.
In confluence with USDT Dominance distributing in the LTF + MTF Range this can be a extra + 1 on a long on btc
4RRI Think the likelihood that we may have finished moving down on bitcoin is over, however, even if that is not the case, This may be a nice trade!

TradeCityPro | Bitcoin Daily Analysis #139Welcome to TradeCity Pro!
Let's go over Bitcoin's analysis. Today, Bitcoin is showing some signs regarding its next move, and today could be a critical day — especially considering that U.S. interest rate data is set to be released tomorrow.
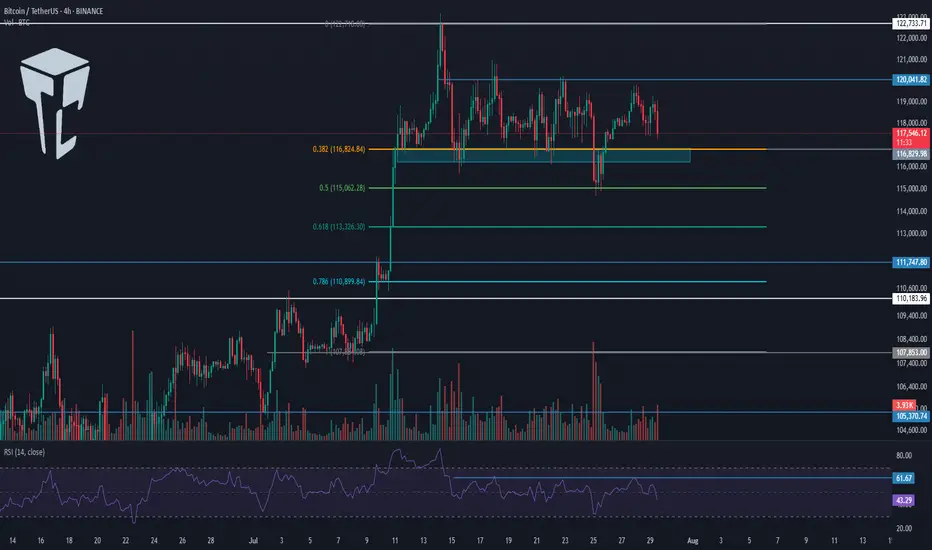
4-Hour Timeframe
Today, there’s no need to switch to other timeframes — this 4-hour chart tells us everything.
Yesterday, the price was moving toward the 120041 area, which we intended to use as a long trigger, but that didn’t happen. The price failed to stabilize above this level, and RSI was rejected from the 61.67 zone.
Currently, the price has formed a lower high compared to 120041 and is now moving toward the support area around 116000.
Selling volume has significantly increased, which is not good for the bullish trend. If this support level breaks, deeper corrections to the 0.618 or even 0.786 Fibonacci levels could occur.
I’ll take profit on my long position that I opened from below 110000 if the price stabilizes below this zone, but I absolutely won’t open any short positions for now.
In my opinion, as long as the price is above 110000, any drop or correction is simply a better entry point for a long position. However, we shouldn’t buy during a falling market — we must wait for our triggers to activate.
BTC 1H Analysis – Key Triggers Ahead | Day 6💀 Hey , how's it going ? Come over here — Satoshi got something for you !
⏰ We’re analyzing BTC on the 1-hour timeframe .
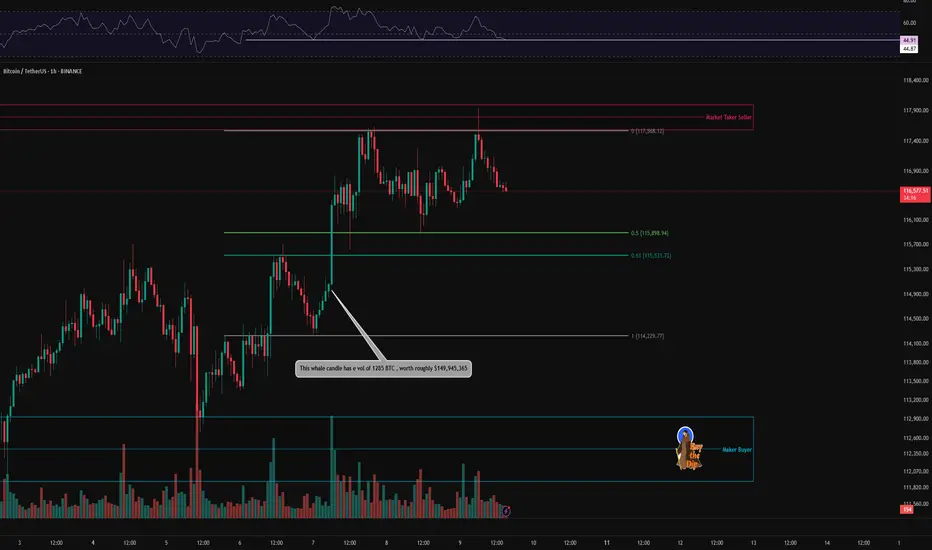
👀 On the 1-hour timeframe, Bitcoin rebounded from $114,200 after heavy whale buying. It broke through the $115,530 zone and moved toward its resistance at $117,600, but was rejected twice by strong seller tickers in that area. It is now moving toward its current support levels .
🎮 Key Fibonacci zones to watch are the 0.5 and 0 levels. A breakout of these areas can trigger potential long or short entries, making them valuable as breakout triggers .
⚙️ The important RSI pivot level is 44.87; losing this level could lead to a further correction .
🕯 Trading volume and transaction count are rising, suggesting the possibility of another “Bitcoin season.” Large institutions have been buying at the lows, increasing their positions each time. ETF data has turned highly positive, indicating strong recovery potential and attracting more risk capital .
🔔 There are two alert zones: one at $117,500 and another at $116,000. Setting alerts here can help you better track price behavior .
📊 USDT.D has broken above its range box , A break of the current zone could allow Bitcoin to push higher .
🖥 Summary : After its recent pump, Bitcoin is facing resistance from seller tickers and is trying to break through this zone. As long as BTC stays above $116,000, there is potential for another attempt to set a new high .
❤️ Disclaimer : This analysis is purely based on my personal opinion and I only trade if the stated triggers are activated .
BTC 1H Analysis – Key Triggers Ahead | Day 5💀 Hey , how's it going ? Come over here — Satoshi got something for you !
⏰ We’re analyzing BTC on the 1-hour timeframe .
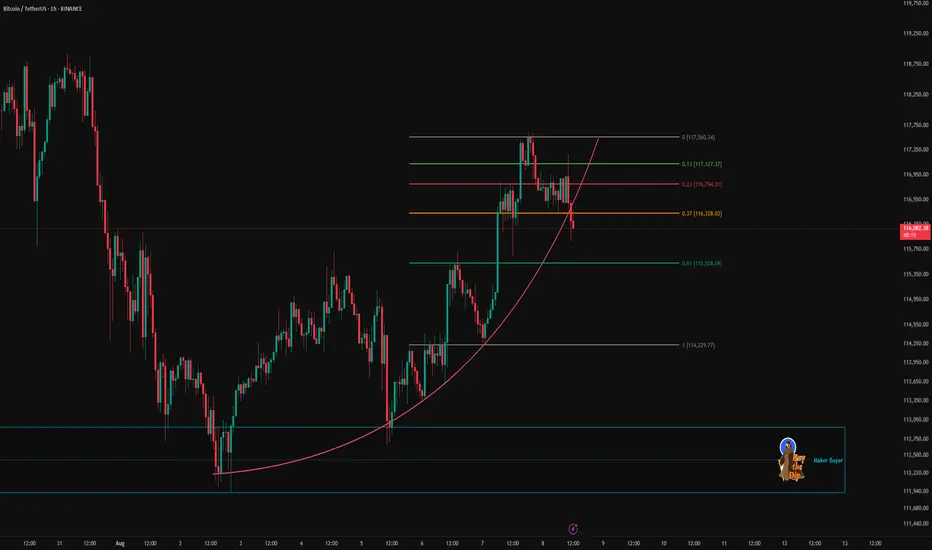
👀 After triggering its long signals, Bitcoin moved upward and hit the seller zone at 117,500, then reversed from that level.
🎮 A Fibonacci retracement has been drawn from $ 114,200 to $ 117,560. The price entered the zone between the 0.37 and 0.61 levels, and we need to see whether it reacts to 0.61 with selling pressure or pulls back to 0.37. Understanding market behavior in this area can guide us.
✏️ A curve line has been drawn from the first touch of the maker-buyer zone to the first touch of the maker-seller zone. This line intersects well with the 0.37 Fibonacci level, which has now been broken in current conditions.
🔽 With the increase in short positions and selling volume for Bitcoin, the price experienced a decline and correction. If selling pressure continues, Bitcoin could start a short-term correction.
⚙️ Our RSI oscillator is below the 50 level, with a support zone at 41.22. If this zone is lost, market momentum will lean more towards selling and further correction.
💸 BTC.D , if it breaks 60.72 %, could drop to lower levels, making Bitcoin lighter relative to the market.
💵 USDT.D , if it breaks 4.28 %, could also drop to lower levels, reducing Tether’s share in the market and shifting more capital into Bitcoin and altcoins.
🖥 Summary: Bitcoin was rejected from the 117,560 level and, along with selling pressure, dropped below the 0.37 Fibonacci zone. There is a support level at $ 115,530 — as long as the price stays above this zone, Bitcoin can maintain its upward trend with short-term multi-timeframe corrections.
❤️ Disclaimer : This analysis is purely based on my personal opinion and I only trade if the stated triggers are activated .
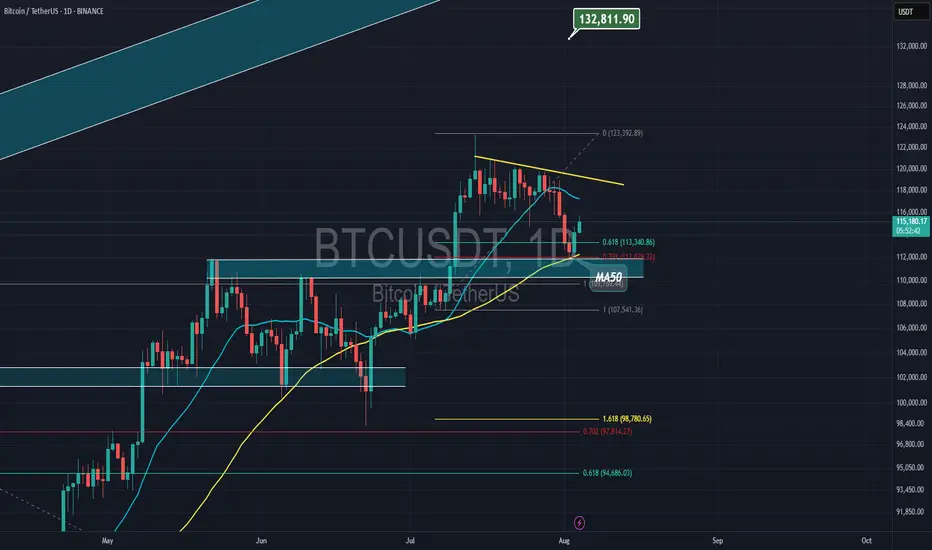
127k after small fall to 112k . buy altcoins in 112k
Hello. Wait for a small correction to the 112k range. There is still wave 5 left to end this bullish move, which I think will make a new record in the 127k range.

BTC crossing key technicals DOWNIt's probably nothing, BTC dropping below 50 and 200SMAs. Again, from a historical perspective, BTC has dropped every time. Don't be left holding the bag! Berkshire is holding record cash and so are many alpha investors.
BITCOINTHE daily structure of the bitcoin shows a break out of the daily ascending trendline ,but on 4hrs we are protected by 4hr ascending trendline line ,the daily sr/rs level holds superior opinion of price action than any intraday time frame .so trade with care and know that any key level on 4r/3r can fail while contesting with daily TF and weekly structure.
#bitcoin #btc

BITCOIN THE daily structure of the bitcoin shows a break out of the daily ascending trendline ,but on 4hrs we are protected by 4hr ascending trendline line ,the daily sr/rs level holds superior opinion of price action than any intraday timie frame .so trade with care and know that any key level on 4r/3r can fail while contesting with daily TF and weekly structure.
#bitcoin #btc

"Bitcoin’s Big Heist – Are You In or Out?"🚨 BTC/USDT HEIST MISSION – SWIPE THE BULL RUN BEFORE THE BEARS WAKE UP 💰💣
🌟Hi! Hola! Ola! Bonjour! Hallo! Marhaba!🌟
Money Makers & Robbers, assemble! 🤑💰✈️💸
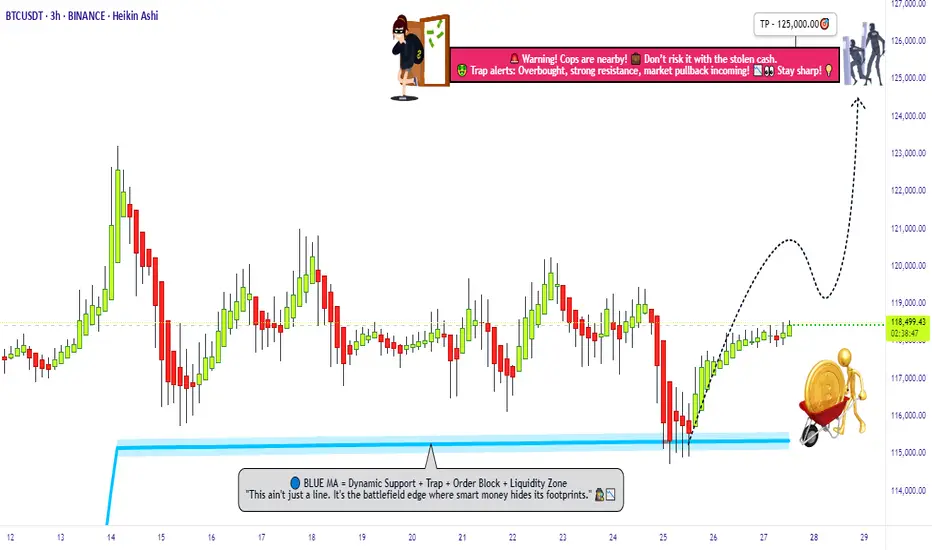
Here’s your decoded BTC/USDT “Bitcoin vs Tether” Crypto Market Heist Plan, fully loaded with Thief Trading Style 🔥 TA + FA combo. We’re prepping for a bullish breakout loot – eyes on the vault, ignore the noise.
🎯 PLAN OF ATTACK:
🎯 ENTRY (BUY ZONE):
💥 “The vault’s open—time to sweep!”
DCA/Layer your buy limit orders near the 15–30 min swing lows/highs for sniper pullback entries.
Use multi-entry method to stack positions (layering / DCA) as per your ammo (capital 💵).
🛑 STOP LOSS:
Set SL at the nearest swing low wick (4H TF) — around 115000.00, adjust based on your risk/load.
SL = insurance. Not optional.
🏁 TARGET:
Lock sights on 125000.00
🎉 Or… vanish with profits before the bear cops arrive.
🔎 MARKET BACKDROP & ANALYSIS:
📈 BTC/USDT currently signals bullish vibes on the swing/day horizon — fueled by:
Macro Fuel & Fundamentals
Sentiment Radar
COT Reports
On-Chain Pulse
Intermarket Clues
🚀 Connect the dots. The smart money's already prepping a breakout move.
🧲 Scalpers Note:
Stick to the long side only. No shorting the beast — unless you’re made of diamonds.
Secure your bag with trailing SLs.
⚠️ NEWS TRIGGER ZONE – TRADE WITH TACT:
📢 Upcoming high-volatility news events can spike charts.
Avoid new entries during releases and guard open trades with trailing SLs.
Protect the loot. Always.
💖 SUPPORT THE HEIST GANG: BOOST IT!
Smash that ❤️ to boost our thief squad’s momentum!
Every click powers this underground mission – making money with style, one pip at a time. 🎯💣💵
🚀 See you in the next heist drop.
Until then – Stay stealthy. Stay profitable. Stay legendary. 🐱👤💸🏆
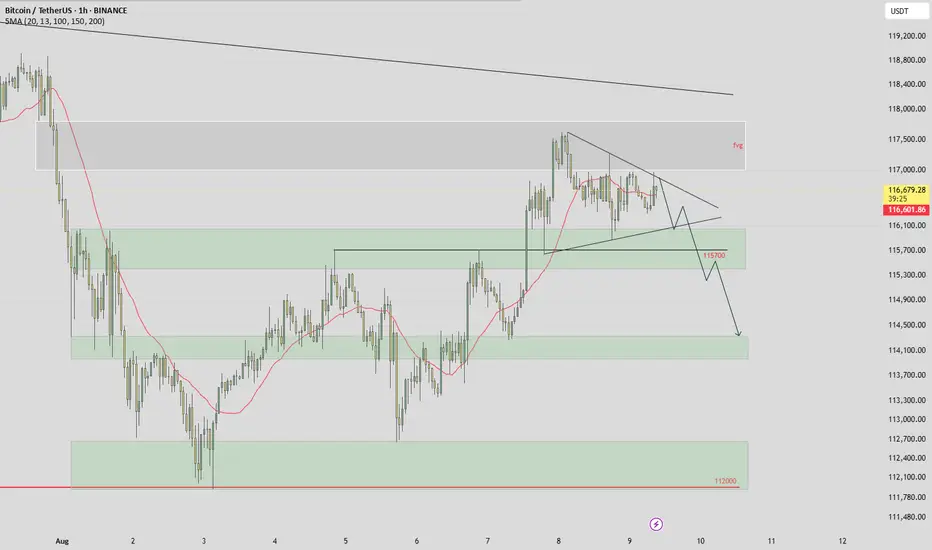
btcHello
My opinion is that the market trend is bearish.
We are currently in a compression pattern, and if we can break this pattern to the downside and establish a strong candlestick below the price of 115,700, the bearish scenario will be activated.
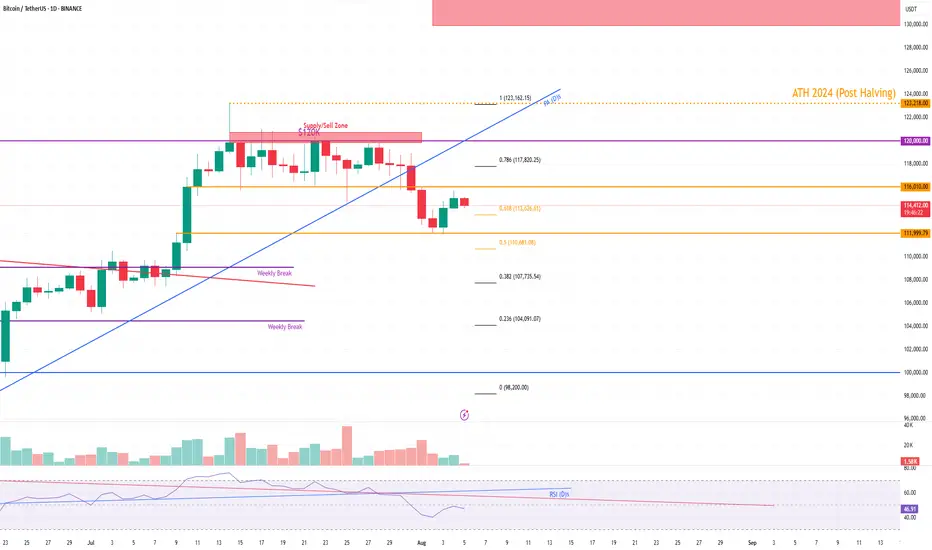
BTC PA📊 Price Action Analysis
Rejection at Major Supply Zone ($120K)
Price reached a strong supply/sell zone between $120K and $123K, marked in red.
$120,000: Psychological round number — major supply area.
Price got rejected after multiple days of consolidation under this level.
Support, Resistance Levels and Trendlines
$116,010: Horizontal S/R — acted as temporary support, now resistance.
$111,999.79: Key horizontal support.
Blue PA (D)s trendline has been broken bearishly — indicating a change in short-term market structure.
Momentum is currently in a pullback/retracement phase after strong rally from late June to mid-July.
Volume Analysis
Volume is declining during the pullback — typical of retracements and not full-blown reversals.
No major volume spike indicating panic selling.
Fibonacci Retracement Analysis (Recent Swing High to Swing Low)
Key levels:
0.786: $117,820.25 — Rejected here.
0.618: $113,626.61 — Currently testing this level, price slightly above.
0.5: $110,681.08 — Next support if rejection at 0.618 persists.
0.382: $107,735.54
0.236: $104,091.07
0%: $98,200.00 — Full retracement base.
Price is showing hesitation at the 0.618, which is a crucial level in Fibonacci theory. A break and hold below this could accelerate the drop toward $110.6K and beyond.
RSI Analysis (Daily)
RSI is around 46.46 — moving below midline (50), showing weakening momentum.
Bearish divergence confirmed: price made a higher high while RSI made a lower high → bearish reversal signal.
Bullish if:
BTC reclaims $116K, closes above $120K — invalidates rejection.
RSI bounces from current level with volume support.
Bearish Bias:
Currently, structure broke down.
Testing 0.618 Fib level; failure here likely brings price to: $110,681