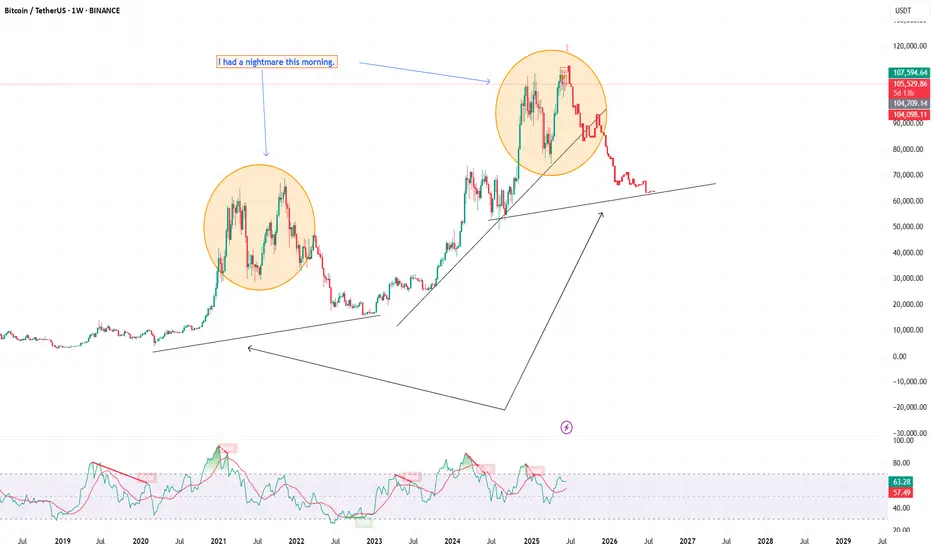
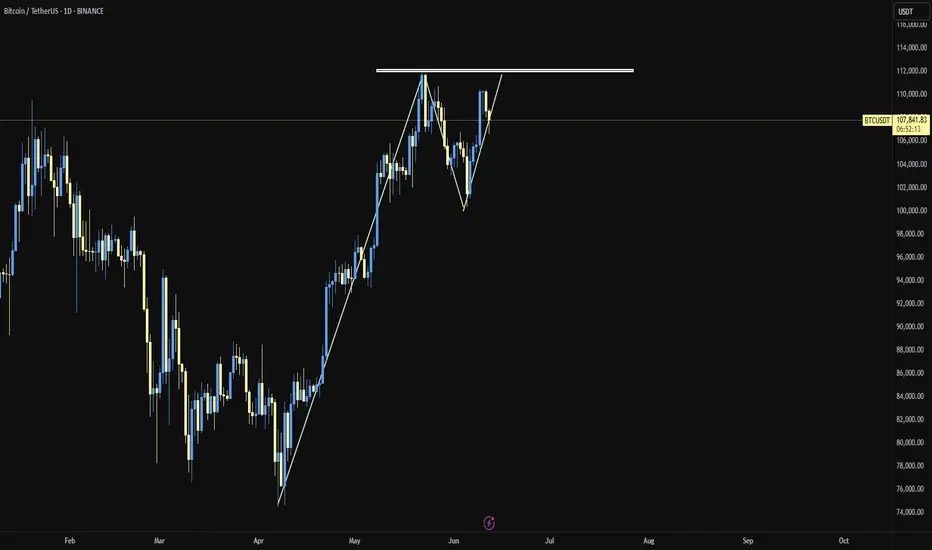
I had a nightmare this morning.Recently, I published my analysis about BTC and found that BTC is following a rising channel and is being supported by fib retracement.
But unfortunately, BTC hasn't shown any remarkable movement so far, and came back again the the support area.
I feel this is not a good sign for BTC.
ON a weekly view, It May repeat its previous movement.
I am publishing my reservation about BTC, be careful about BTC.
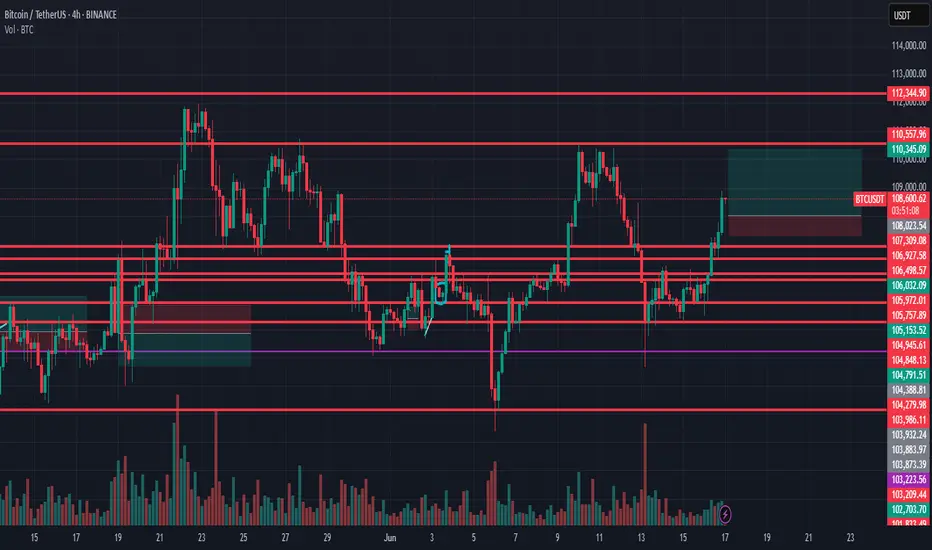
BTCUSDT.P trade ideas
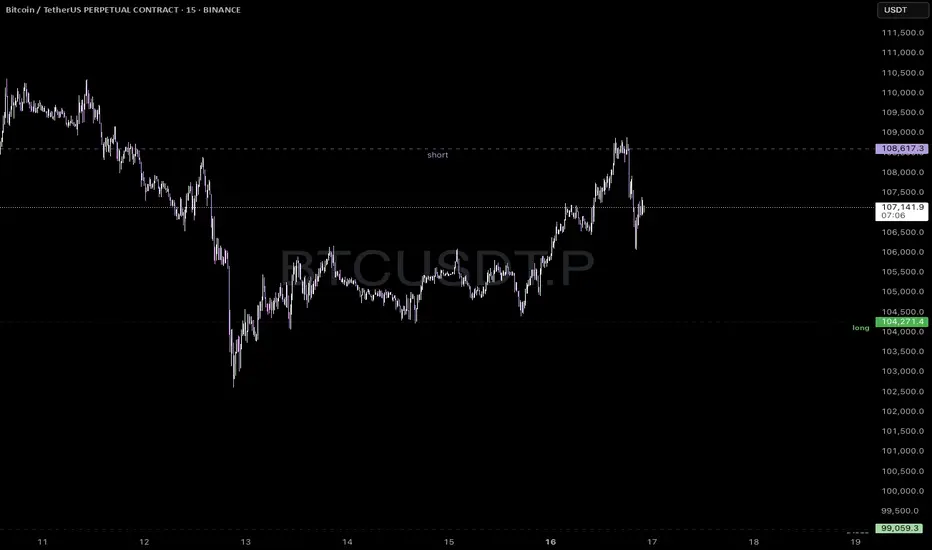
BTCUSD – Range Scalping Zones IdentifiedPrice tapped into a previous short zone near 108.6 and showed rejection. We’re watching for downside follow-through toward the 104.2 to 104.5 range where a potential long opportunity may form.
This chart outlines clean range-based levels for scalping. These zones line up with prior liquidity sweeps and local structure shifts. Scalpers can look to react at these levels depending on how price behaves when we get there.
Ideal for traders on lower timeframes like the 15m, but the concept applies across intraday setups. Always wait for confirmation before entering.
BTC long now ! Bullish divergence confirm !Bullish divergence in daily timeframe is confirm. It might be good for take long position
#isharewhatitrade
#dyor
be ready for it this for educational purpose comment for any stock analysis name and take risk on ur on action
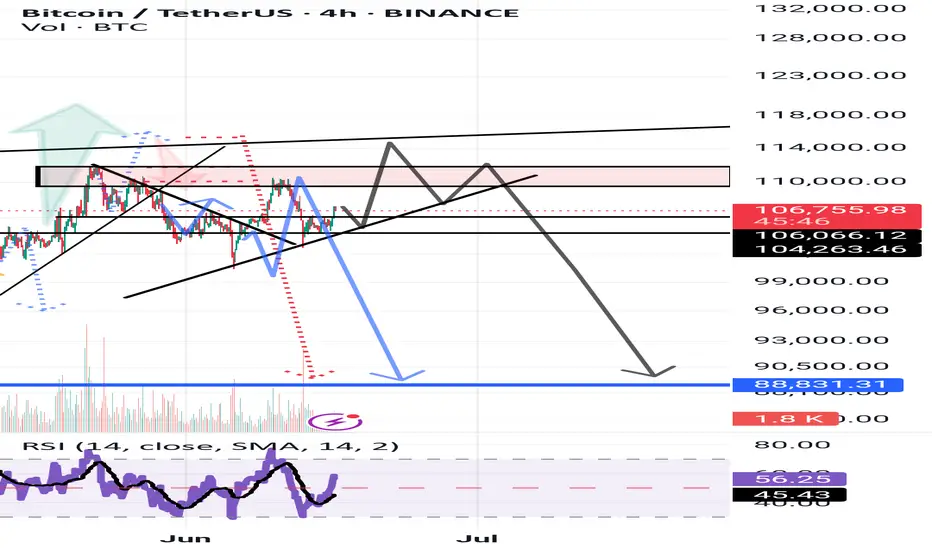
Kingbtc 3 4hWelcome to KIN BTC 3. It is expected that Bitcoin can form an upward step, initially reaching 108,200. After that, with a lower probability, a higher peak may also be formed. However, ultimately, the level of 88,700 is expected to be seen.
BTC BITCOIN ,we are watching every step and price action,the next clear directional bias on long will be on the break and close of daily supply roof at 111k, while the sell confirmation will be on the break and possible retest of the daily ascending trending line holding buyers for today 16th.
Israel and Iran war could be seeing liquidity into crypto especially bitcoin

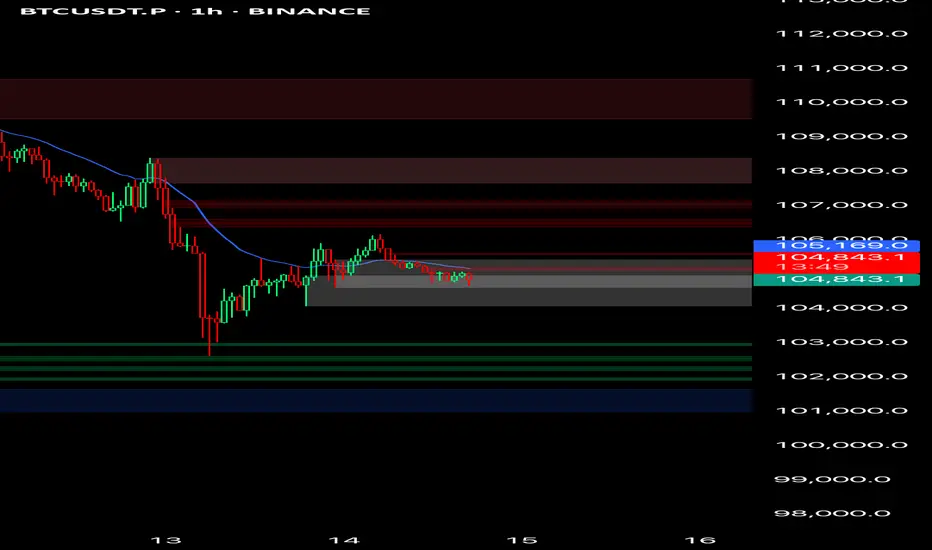
BTC-----Sell around 100500, target 103500 areaTechnical analysis of BTC contract on June 14:
Today, the large-cycle daily level closed with a small negative line yesterday, the K-line pattern continued to fall, the price was below the moving average, and the attached indicator was dead cross. The decline in the big trend was still very obvious. We should pay attention to the breakout and pressure signal of the high point of yesterday's correction and pullback in the 106200 area; the short-cycle hourly chart yesterday's price rebounded and corrected after hitting the low point, and retreated under pressure in the Asian morning today. The current K-line pattern continued to fall, and the attached indicator was dead cross. Then the trend is likely to fluctuate downward during the day, but the strength is not expected to be great over the weekend, so it is still short-term.
BTC short-term trading contract strategy:
Directly short in the 100500 area, stop loss in the 105500 area; target is 103500 area;

STOP LOSS LESSONI want to share my opinion about stop-losses.
I don’t use them, because very often the stop gets triggered — and then the price moves in the right direction, but you're no longer in the trade.
I do it differently: I set a take-profit, but no stop-loss.
Let’s say I have $1000, and I enter a short with $100.
The price would have to increase 10 times to get me liquidated.
A 2–3% drawdown is acceptable, especially in an overbought market.
So why would I use a stop?
Trade with small amounts — and everything will be fine.
You won’t lose money.
If you're looking for excitement, go to a casino — the odds are better there.
In trading, you need to be careful and stay calm.
From my experience, technical analysis often doesn't work.
Thanks for your attention.
#stoploss
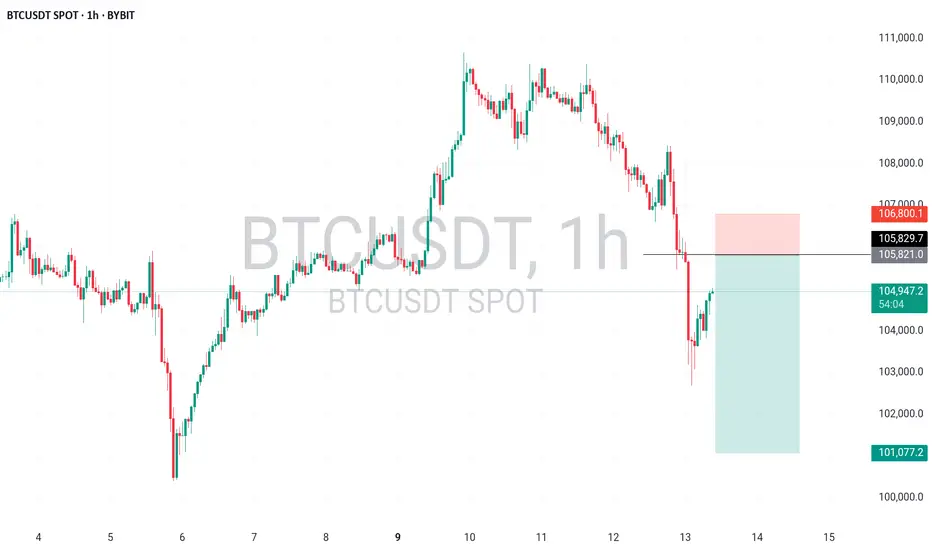
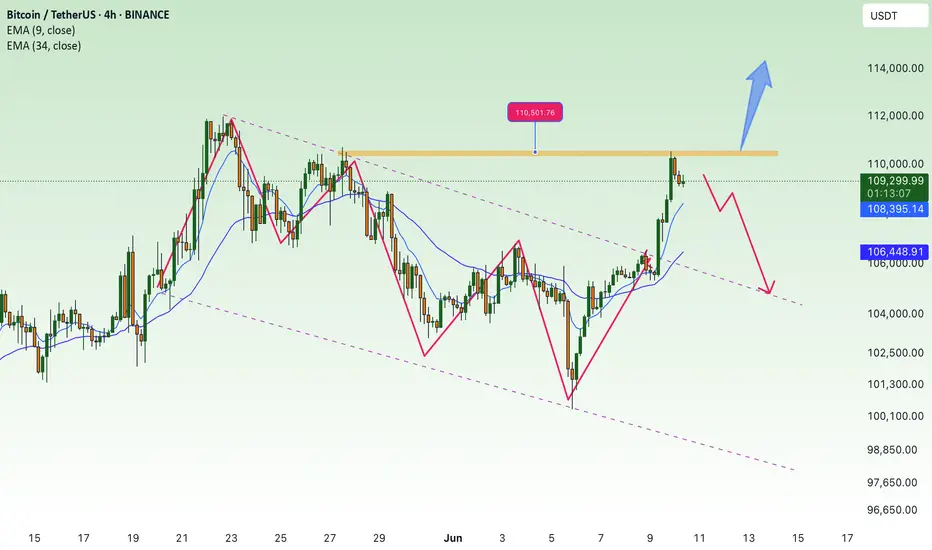
BTCUSDT ShortBTCUSDT – Watching 105.8K–106.5K Supply Zone
Price currently retracing after a strong dump from 108K. I'm eyeing the 105.8K–106.5K zone for a potential short — previous order block + premium zone for smart money selloff. If price rejects there, I’ll target 103.5K and possibly 101K. SL above 106.8K.
Structure still bearish until proven otherwise.
BTC/USDTDo you think Bitcoin has just formed a double top, or is it showing a different pattern? Personally, I think we might range a bit from here and then possibly continue the uptrend. I'm not really into pattern trading—so you tell me, are we bullish or bearish?"
$BTC - Possible CME Gap FillBINANCE:BTCUSDT | 4h
Watching 106.2k-106k for a potential bounce taking those singleprints/imbalances.
However, if 108.3k rejects, CME gap below likely gets filled around 104k to 102k zone (pink squiggly)

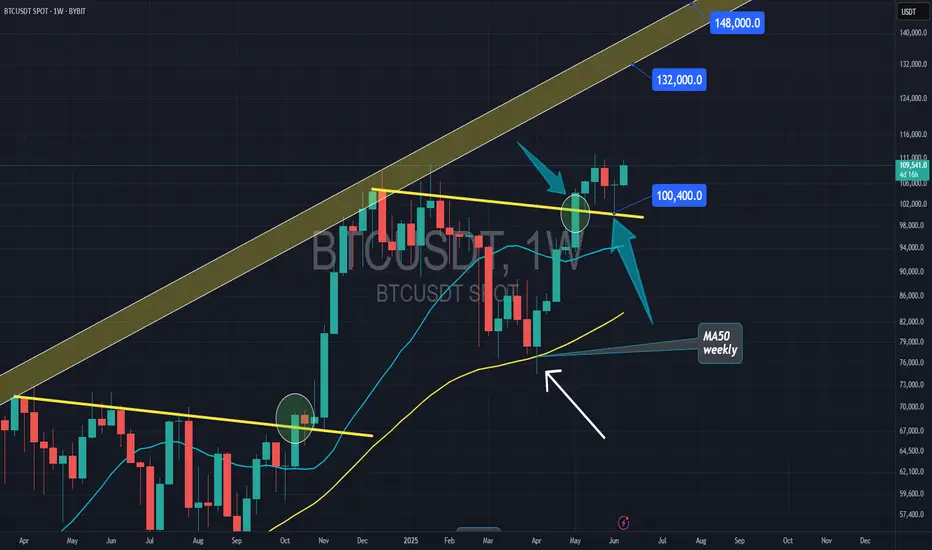
Bitcoin to $130,000Bitcoin broke out of the important yellow trendline and back tested that ( @$100k ) now its rising again. the main target now is $130,000 trendline
Bitcoin’s Next Big Move? Watch This Before It Happens!In today’s class, we broke down the next key Bitcoin setups. We analyzed past price action to help predict future moves, and we're patiently waiting for bullish continuation – but we’re also staying cautious of a possible range deviation from Monday’s high.
Stay sharp and be prepared for both scenarios!
Follow to stay on top if the curve.

BTC Returns to Highest ATH💎 Update Plan BTC (June 10)
BlackRock’s spot Bitcoin ETF has made history, becoming the fastest-growing exchange-traded fund (ETF) ever by surpassing $70 billion in assets under management (AUM).
The iShares Bitcoin Trust (IBIT), launched in January 2024, has achieved this milestone in record time, reflecting surging demand for Bitcoin exposure through regulated, mainstream investment vehicles. IBIT’s exceptional growth trajectory has outpaced all previous ETFs, eclipsing even established funds like the SPDR Gold Shares (GLD) in terms of asset accumulation speed.
The ETF recently returned to net inflows — posting a $274 million single-day increase — following a brief period of outflows during a broader market pullback. This rebound signals renewed investor confidence, with capital flowing in from both institutional players and retail investors alike, underscoring Bitcoin’s growing role in diversified portfolios.
Technical analysis angle
Congratulations to investors when the Plan transaction has detected the bottom of 100k and is currently the highest at 110.5k. It is a prosperous signal for investors who are holding this power currency
Another good news is that the organizers have breaked out of the decrease price channel to confirm the trend of increasing and confidence in the price increase continues to be enhanced by the Buyer.
Currently, the BTC price area is slowed by the resistance level with Fibo 0.786 around the 110k price area. We expect the adjustment of the investors to collect goods before the price area goes further around 111.5k even 115k
At this time, whether new or old, should spend more time to practice, load more knowledge about the PTKT, as well as find knowledge posts at the channel ..., to strengthen the solid foundation, as well as avoid losing money at this time offline
==> Comments for trend reference. Wishing investors successfully trading
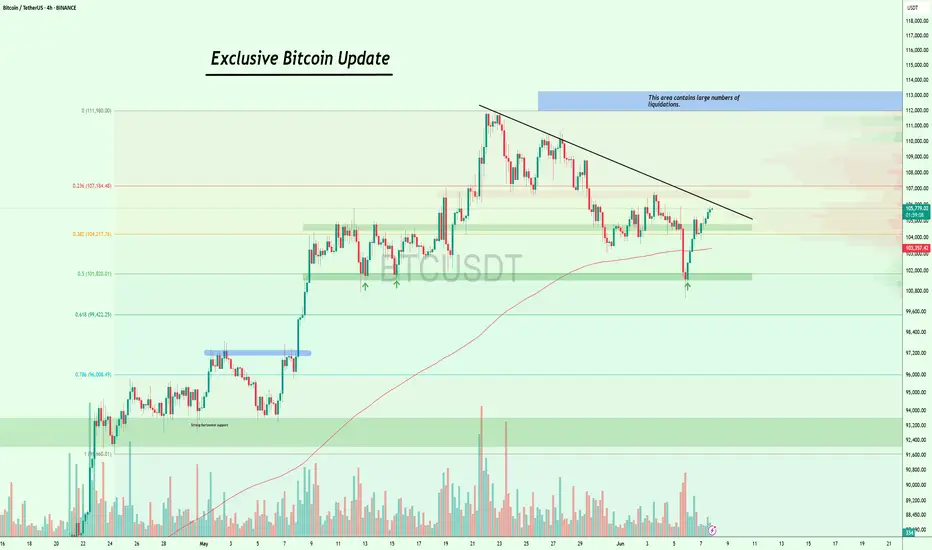
No Change in Plan! $BTC Targeting Major Liquidation ZoneAs I warned you guys, CRYPTOCAP:BTC came down to the $100K exactly as expected, and then we bounced from the $100K level!
That lower trendline once again acted as strong support, just as expected.
Now #Bitcoin is pushing back up toward the major trendline and eyeing the $107K–$112K zone, which holds large liquidations.
No changes in the game plan, watching the daily and weekly closes closely.
If Bitcoin breaks above this trendline clearly, we could see a strong move up. 🚀
I’ll keep you posted as things unfold. If you find my updates helpful, don’t forget to like and follow for more!
BTCUSD is replaying the 2021 double top a bit too perfectlyTracing the weekly highs of Bitcoin's 2021 double top and translating them onto the current highs reveals some startlingly similar patterns.
Removing just a couple of week's bars between the two tops in 2021 gives a very close match to the current pattern we see unfolding.
Are we just watching an action replay?
If so, we would be looking at ~$140k highs by early August followed by a huge retracement to the long term trendline in the c. ~$90k region. Such a retracement is not unprecedented, and from these lows I would expect the price to rise at or above the trend once again, keeping Bitcoin on track to hit $1m by 2029, so this is by no means a bearish prediction.

Bitcoin scalp long back to $106450Might wick backdown for entry
Just opened a bitcoin scalp long.
Targeting $106450 back to the recent highs. I anticipate the market will try to break it again then fail and correct deeper
Time sensitive.

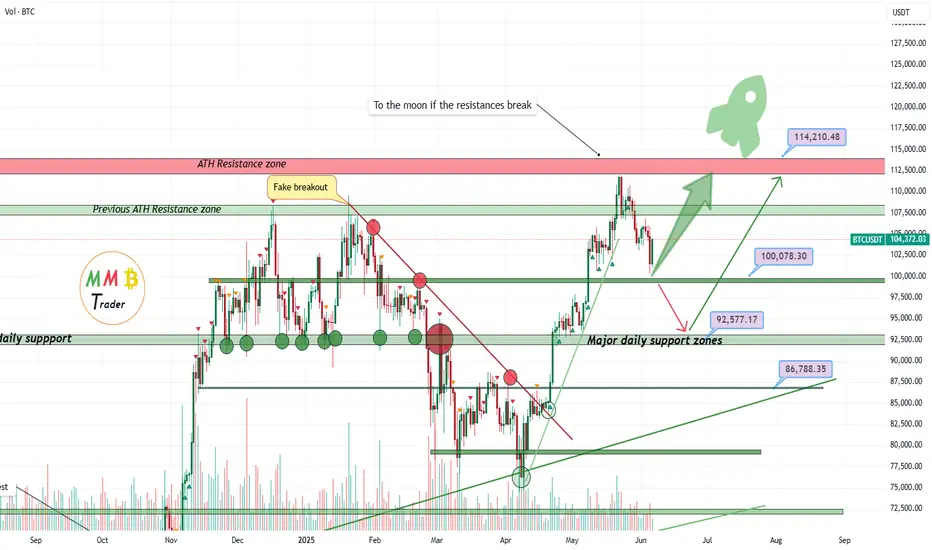
Bitcoin is ready for next ATH (if 100K hold)As we can see two major daily supports now can pump the price and one is 93K$ support zone and the other which is already started to pump the price is 100K$ support zone and price above these supports means market is still bullish and we can expect more rise and gain like the green arrows on chart to the new ATH.
DISCLAIMER: ((trade based on your own decision))
<<press like👍 if you enjoy💚
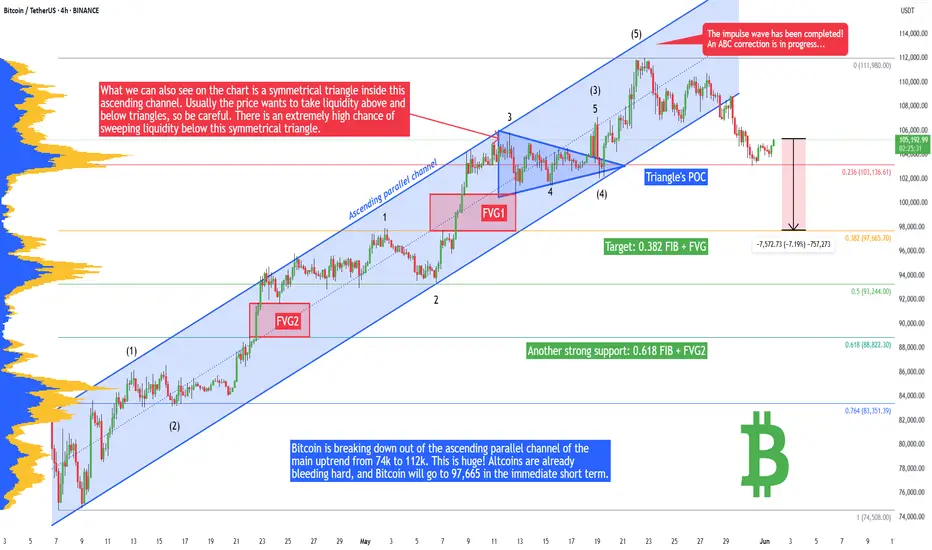
Bitcoin - 97,665 soon! Big drop on altcoins... (Buy here)I hope you sold in May and went away, as I recommended in my previous posts! If not, you probably wonder why Bitcoin is going down.
From a technical point of view, Bitcoin is breaking down out of the ascending parallel channel of the main uptrend from 74k to 112k. This is huge! Altcoins are already bleeding hard, and Bitcoin will go to 97,665 in the immediate short term. Why is this level so important? First of all, it's the 0.382 FIB level of the previous uptrend, and there is also an unfilled FVG (Fair Value Gap). This is a great level to buy Bitcoin for the next major wave to the upside.
The next strong level would be the 0.618 FIB and FVG2. These 2 Fibonacci levels are the strongest of all of them because of the golden ratio pattern and 0.618 + 0.382 = 1.000.
What we can also see on the chart is a symmetrical triangle inside this ascending channel. Usually the price wants to take liquidity above and below triangles, so be careful. There is an extremely high chance of sweeping liquidity below this symmetrical triangle. From the Elliott Wave perspective, we have finished the impulse wave 12345, and we are starting a huge ABC corrective pattern. Usually we want to look for a buying opportunity at the 0.382, 0.500, or 0.618 FIB levels.
Write a comment with your altcoin + hit the like button, and I will make an analysis for you in response. Trading is not hard if you have a good coach! This is not a trade setup, as there is no stop-loss or profit target. I share my trades privately. Thank you, and I wish you successful trades!
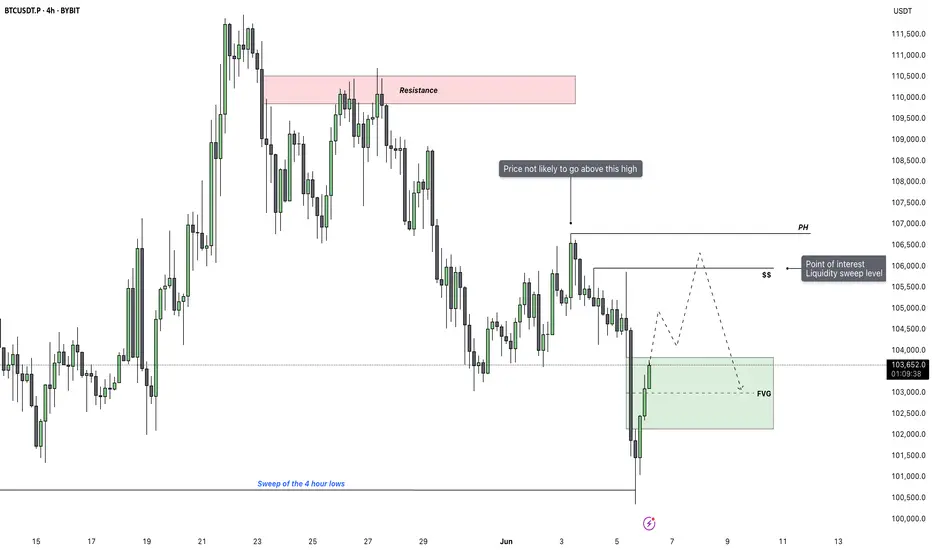
Bitcoin - Reclaim or Reject? Key 4H FVG Levels in FocusAfter an extended move lower, Bitcoin has just swept the major 4H lows and immediately bounced back with strength. This aggressive reaction suggests the sweep was likely a liquidity grab rather than a continuation. Price is now trading back inside a large 4H fair value gap, which could serve as a short-term magnet while market participants reassess direction.
Key Price Reaction and Fair Value Gap Context
The current rebound into the 4H FVG is notable. This zone holds significance because it's the last inefficiency left unfilled before the final leg down. If buyers manage to push through and close above this imbalance, it would indicate a short-term reclaim and open the door to a bullish liquidity sweep higher. The clean highs just above are marked by the $$ label, which align with a key inducement zone and should attract price if bullish momentum sustains.
Upside Scenario – Targeting the Liquidity Sweep
If we do see a clean move and close above the fair value gap, I’ll be looking for price to extend toward the highs just above it. These highs are likely to be the next target for liquidity collection, especially if short-term traders begin chasing strength. However, I’m not expecting price to trade beyond that zone. There’s a protected high resting above, and unless a significant fundamental shift occurs, it’s unlikely we break that structure.
Downside Risk – Failure to Hold Could Lead to 99K
If the market fails to close above the FVG or quickly gets rejected on a wick into it, the bullish scenario becomes invalid. That would confirm the move back up was simply a retracement after the sweep, setting the stage for further downside continuation. In that case, I expect the market to break lower and move toward 99K, which remains my downside target under bearish conditions.
Conclusion
Bitcoin just swept key 4H lows and is now testing a large imbalance. A close above could trigger a run on the $$ liquidity, but I do not expect price to move beyond that due to the presence of protected highs. On the other hand, failure to break and hold above the FVG opens the door for a deeper flush toward 99K.
___________________________________
Thanks for your support!
If you found this idea helpful or learned something new, drop a like 👍 and leave a comment, I’d love to hear your thoughts! 🚀
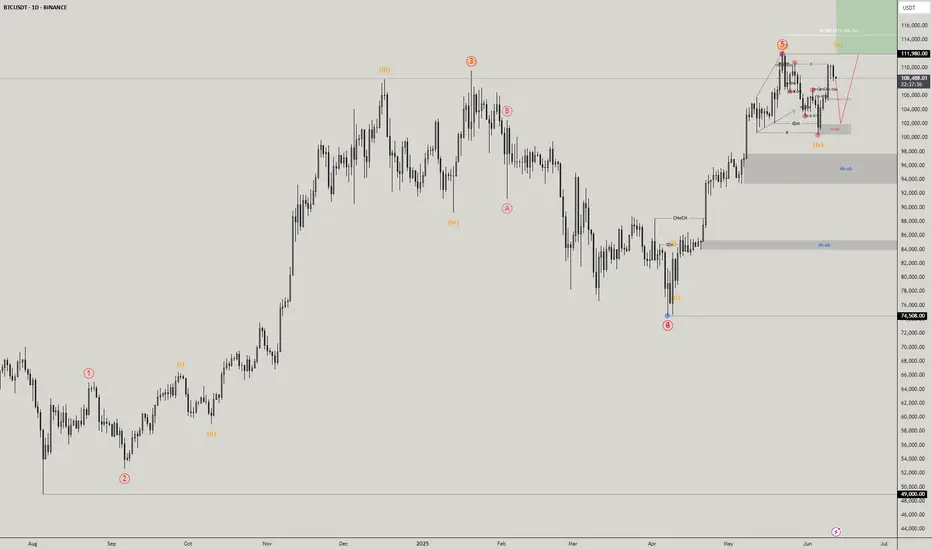
BTCUSDT Possible Sell BTCUSDT completed wave 4 of 5 and currently in wave 5 of 5 . wave 5 targets are on green and a possible sell is in place to finish wave 2 of 5 .
Good LUck
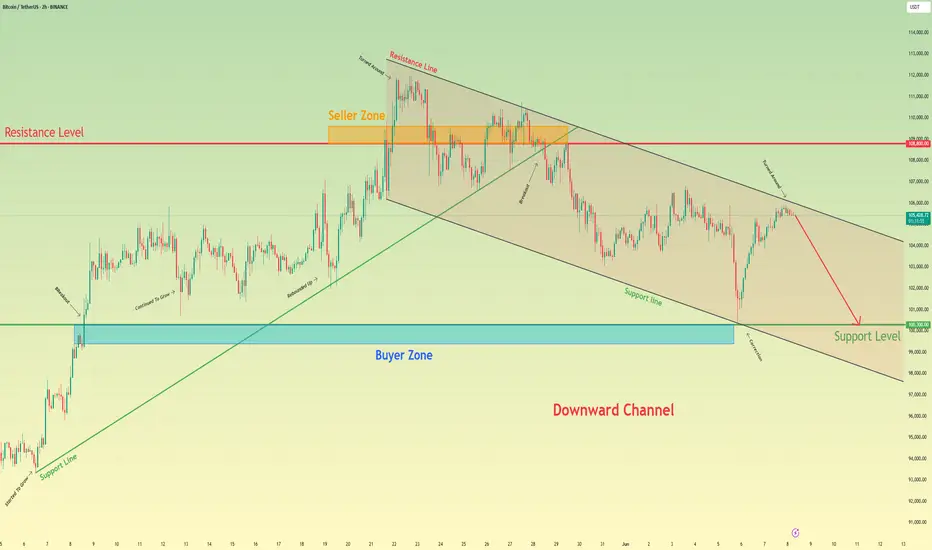
Bitcoin will continue to fall to support level in channelHello traders, I want share with you my opinion about Bitcoin. This chart shows how the price rebounded from the support line and started to grow. In a short time, it rose to the support level, which coincided with the buyer zone, and it even soon broke this level. Next, the price rose a little and then continued to move up, but later corrected the support line. After this, BTC rebounded and rose to the seller zone, breaking the 108800 resistance level. Then it rose a little more and turned around, and started to decline inside the downward channel. In the channel, price soon broke the 108800 level and continued to fall next. Later, Bitcoin broke the support line and fell almost to the support line of the channel, after which it turned around and made an upward movement. After this movement, Bitcoin dropped to the 100300 support level, after which it turned around and, in a short time, rose to almost the resistance line of the channel. Price didn't reach this line, turned around, and continued to fall in the channel. In my mind, Bitcoin can continue to move down top support level inside the downward channel. That's why my TP is 100300 level. Please share this idea with your friends and click Boost 🚀