[SeoVereign] Bitcoin Bearish Outlook – June 17, 2025We are the SeoVereign Trading Team.
With sharp insight and precise analysis, we regularly share trading ideas on Bitcoin and other major assets—always guided by structure, sentiment, and momentum.
🔔 Follow us to never miss a market update.
🚀 Boosts provide strong motivation and drive to the SeoVereign team.
--------------------------------------------------------------------------------------------------------
Hello,
This is SeoVereign, approaching technical analysis not as a result but as a prediction, with a realistic perspective.
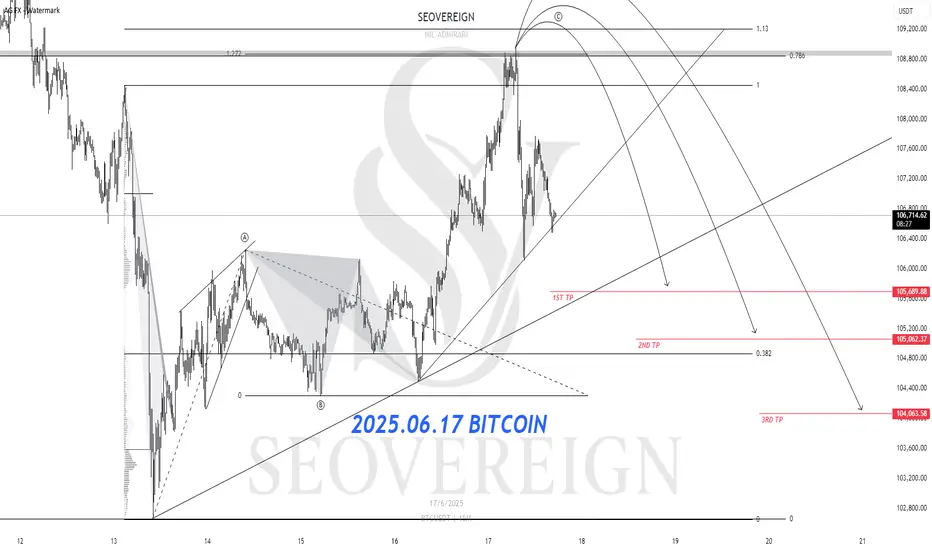
I am presenting a bearish view on Bitcoin as of June 17, 2025.
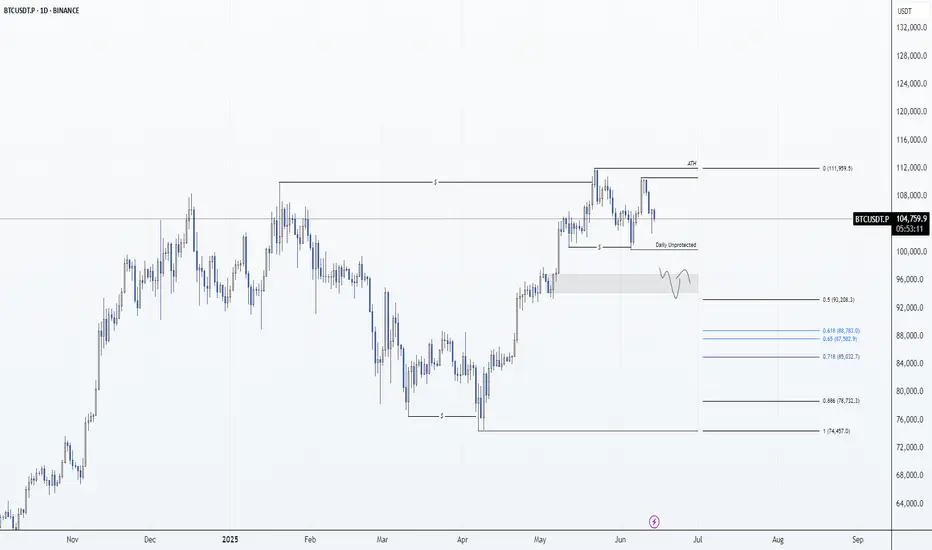
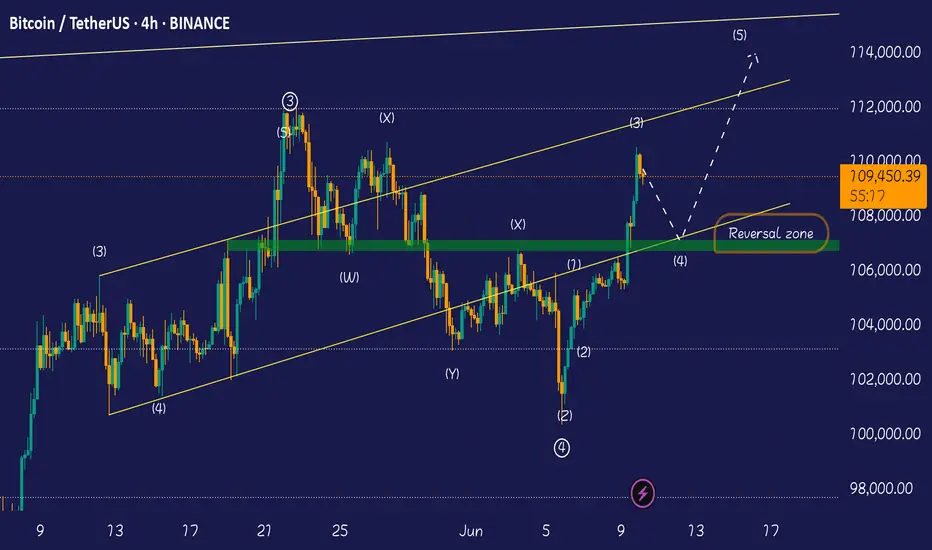
First, based on the fact that a downtrend appeared near the 0.786 level of the overall Fibonacci retracement, I believe strong downward pressure is forming, and thus I am outlining this bearish perspective.
This 0.786 level corresponds to around the 109,000 price range. On the chart, the 109,000–110,600 range is a very strong supply zone where support and resistance have repeatedly been confirmed.
Next, from a wave counting perspective, the 1.272 trend-based Fibonacci extension lies in a similar area as the 0.786 retracement level, which further reinforces my conviction in this view.
After successfully predicting the downward movement from the 11th, I have been continuously counting the recent upward wave, and the wave structure on the chart appears to align naturally, as I see it.
In addition, from a harmonic perspective, the Alt Bat pattern is functioning effectively, and since the movement has been captured within the pre-set X–1.13 range, the confirmation of this pattern can also be considered successful.
The first target is currently set around the 105,700 level.
I will continue to monitor the market closely, and once this idea progresses to a certain point, I will share more specific evidence and the thought process behind the bearish entry through an additional update.
Thank you.
BTCUSDT.P trade ideas
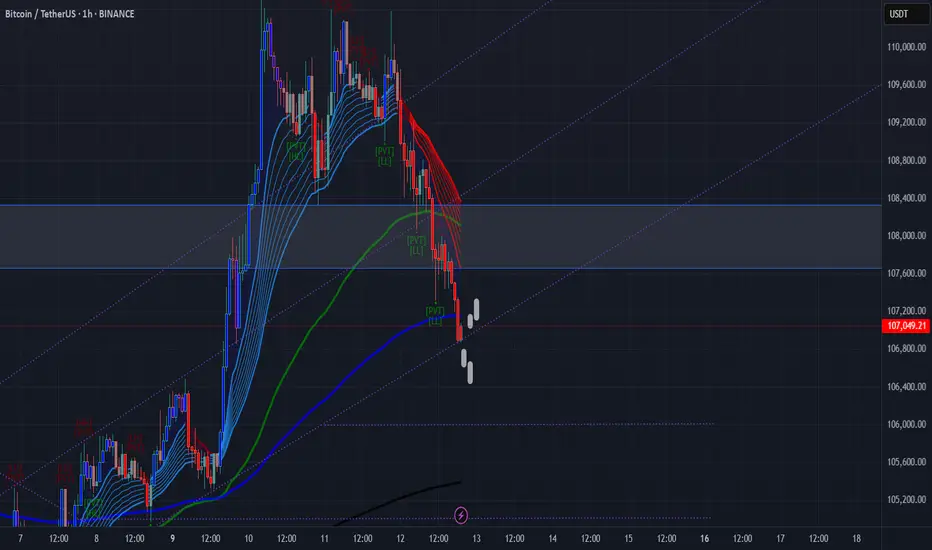
[DYOR] BTCUSDT – Rejected from Supply, Watch 200 EMA BreakdownBTCUSDT failed to continue upward and broke below the ascending structure. Now testing key support at 106.9K–107K and the 200 EMA.
📉 Sell on pullback around 108.2K–108.6K
📉 Alternative: Sell stop at 106.3K if breakdown continues
📈 Aggressive bounce possible at 106.9K, but high risk
SL & TP based on key S/R zones
Always apply solid risk management 🚨
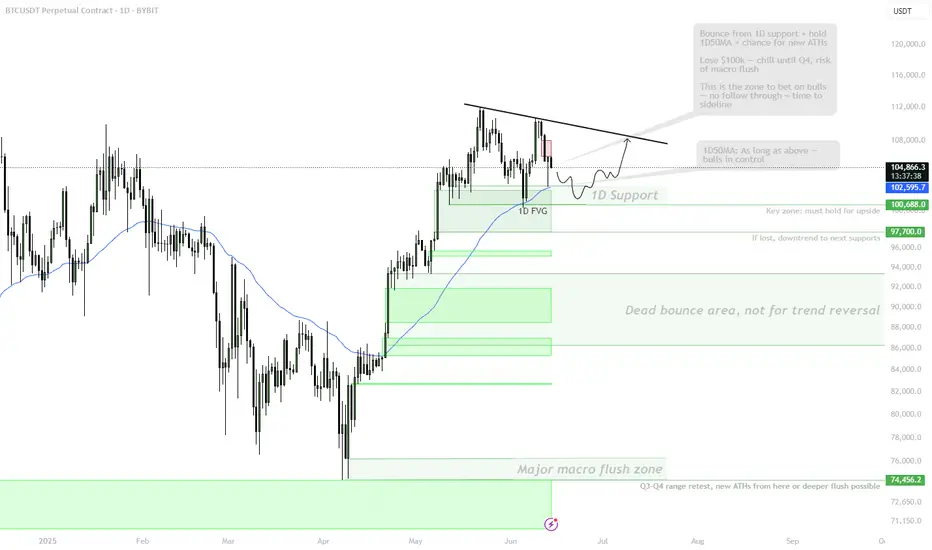
BTC | At the Line Between ATH Expansion or Macro FlushBINANCE:BTCUSDT Bulls need to hold the $102k–$100.8k support and 1D 50MA for a shot at new highs.
– Wick into 1D FVG ($98k) is fine, but no daily close below 50MA allowed.
– Lose $100k? Then it’s sideline season — next real support only at $93k/$87k, macro flush risk toward $75k–$58k if momentum fails.
– As long as above 1D support/MA, there’s a chance for a clean ATH breakout from the OB under the highs.
This is the zone to bet on continuation. If not, don’t fight the trend lower.
BTC: Daily Timeframe 14/06/25Spot buyer again ~ $93k aka 0.5 retrace of the weekly leg
Higher timeframes swept (ATH) with confirmed deviation.
Expecting a corrective to continue healthy trend before more bullish continuation
If we set a lower high on the weekly, that’ll flip my bias and a far deeper corrective leg would be likely.
Right now long term BTC is the only crypto coin I hold as long term conviction remains unchanged its direction is up and to the right for many years to come.
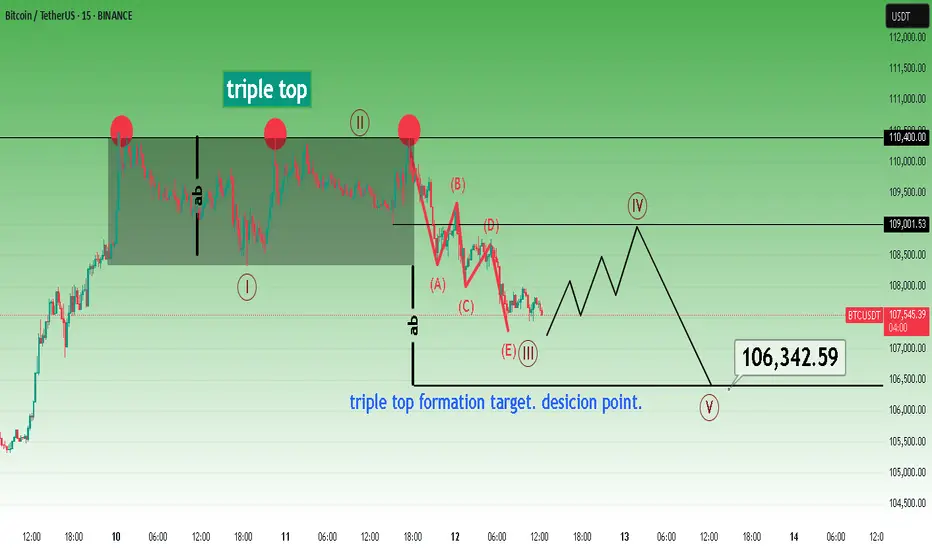
Bitcoin short term triple top pattern target.The most likely scenario in my opinion.
* The purpose of my graphic drawings is purely educational.
* What i write here is not an investment advice. Please do your own research before investing in any asset.
* Never take my personal opinions as investment advice, you may lose your money.
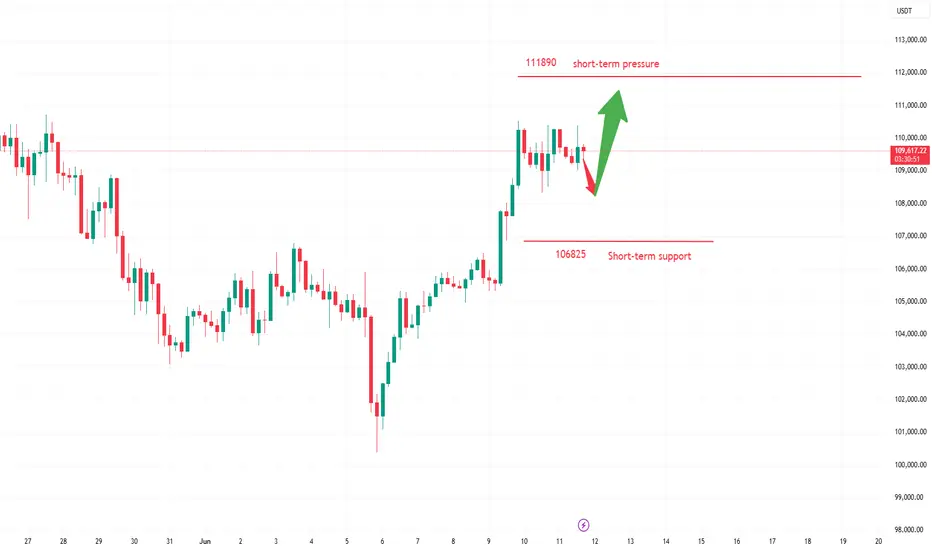
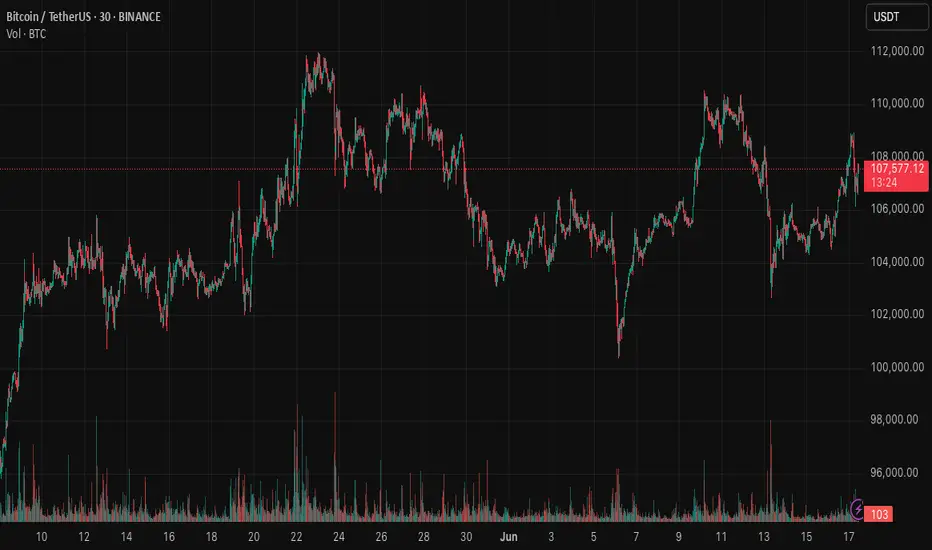
"Accumulation Phase for Breakout"Bitcoin underwent high-level consolidation on June 11, with intraday volatility ranging from $108,800 to $110,200. It failed to effectively break through the previous high of $111,980. The 24-hour global liquidations amounted to $210 million (half of the previous day), with short positions accounting for 62%, indicating that bears still dominate short-term sentiment.
The Sino-US high-level talks in London originally scheduled for June 11 have been postponed to June 15, and the details of tariff reductions remain unclear, leading to a decline in risk asset appetite. The US Dollar Index rebounded by 0.8%, suppressing Bitcoin's breakthrough momentum. Bitcoin is currently in a accumulation phase for breaking through all-time highs, with policy regularization and institutional increasing holdings forming long-term support.
Humans need to breathe, and perfect trading is like breathing—maintaining flexibility without needing to trade every market swing. The secret to profitable trading lies in implementing simple rules: repeating simple tasks consistently and enforcing them strictly over the long term.
Trading Strategy:
buy@108000-108500
TP:110500-111000
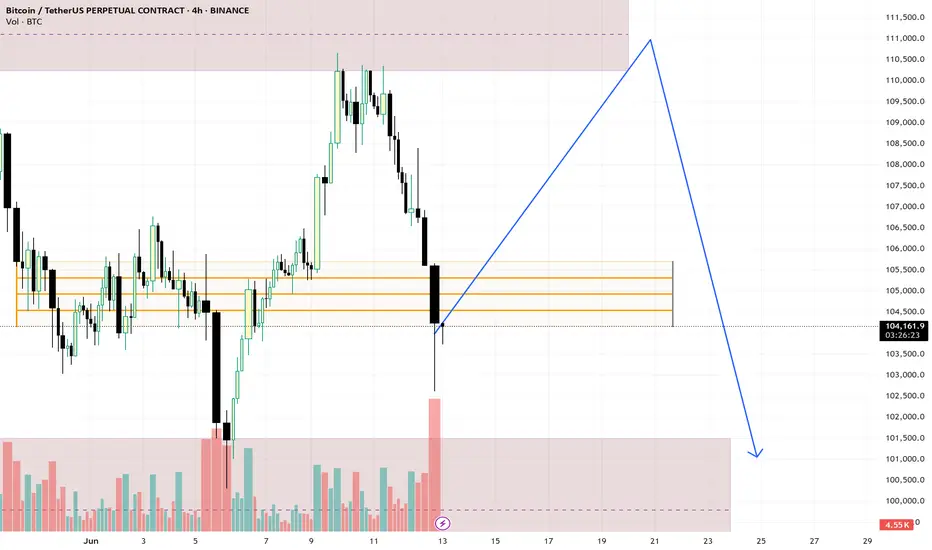
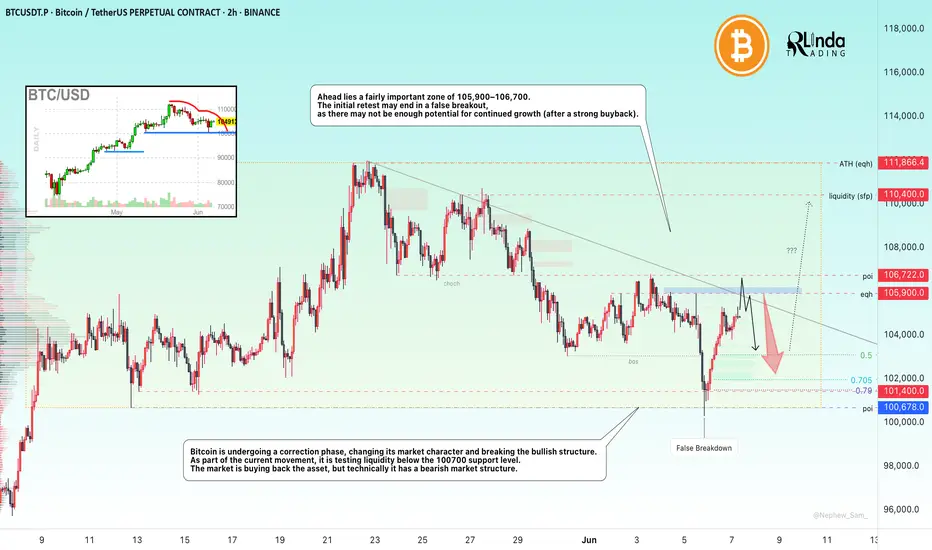
BITCOIN → Correction. The hunt for liquidity...BINANCE:BTCUSDT.P is recovering after liquidity was captured in the 100K zone. Locally, the technical situation is controversial despite the global bullish trend
Bitcoin is changing its market character (106700) and breaking the bullish structure (103000) during a correction phase. As part of the downward momentum, the movement is testing liquidity below the 100700 support level. As for the liquidation, there are several reasons: the conflict between Trump and Musk, strangely enough, the market reacted with a fall; the liquidation of whales, history repeats itself...
Traders are buying back Bitcoin, but technically the market has a bearish structure. Locally, there is a bearish trend, and a countertrend correction, “liquidity hunting,” is forming.
Ahead lies a fairly important zone of 105900-106700. The initial retest may end in a false breakout, as there may not be enough potential for continued growth (after a strong buyback).
Resistance levels: 105,900, 106,720, 110,400
Support levels: 103000, 101400, 100K
After a correction from 105900, which could target half (0.5) of the trading range, the market may attempt to return to a bullish phase, provided that the bulls keep the price from falling and do not allow it to update local lows. That is, in the short term, I expect a decline from 105900 to 103000, but further, if the price starts to return to 105500-105900, there may be chances for growth to 110K
Best regards, R. Linda!
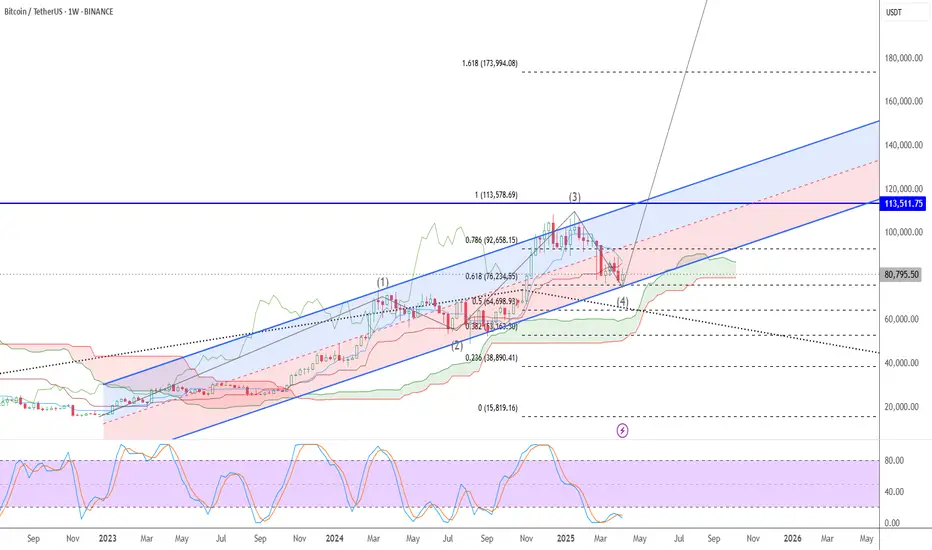
It is possible that Bitcoin is finishing wave 4It is possible that
Bitcoin is finishing wave 4
Will expand to wave 5
The target is more than 250,000 dollars
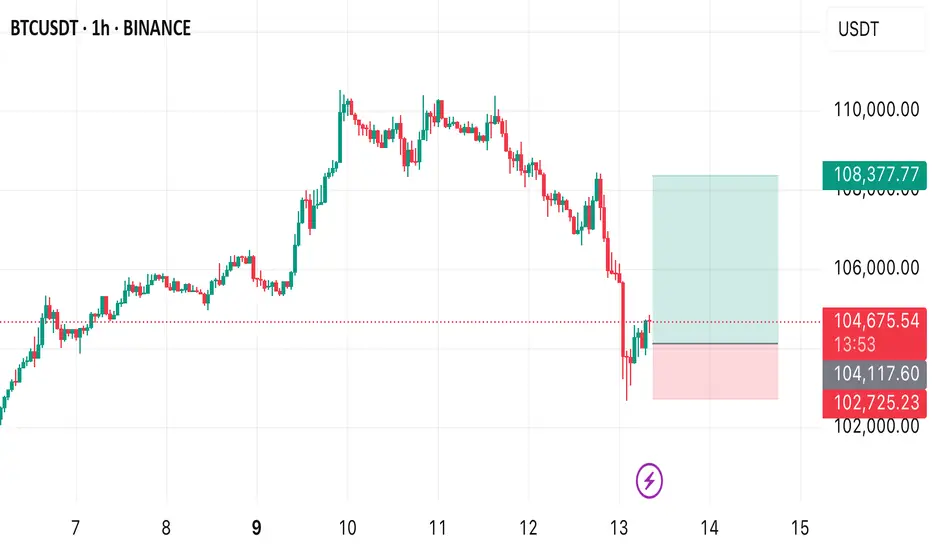
A BUY OPPORTUNITY ON BTCUSDPrice currently trade at 104,730.33 In today’s analysis, I anticipate a buy opportunity to emerge from the current market price. I expect price to rise up to 108,377.77
A buy opportunity is envisaged.
BTC CAN PUMP AGAIN AFTER A SHORT REST Bitcoin had a very strong pump from the 101 to 110k range. In my opinion, the third wave that I identified on the chart is complete and now the price can start pumping again by returning to 107k. The 107k range is an important range because the bottom of the main channel is at this price and it is also a good range for the fourth Elliott wave.
#BTC/USDT#BTC
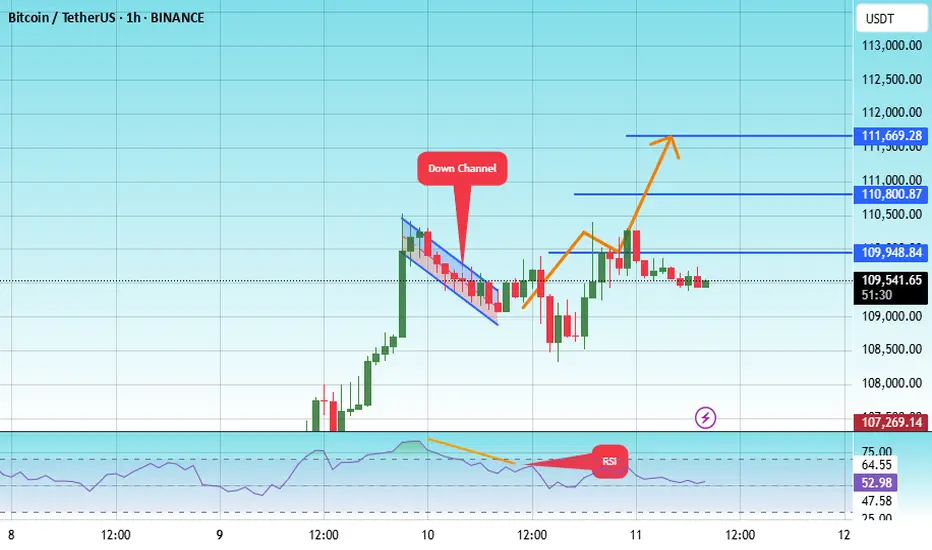
The price is moving within a descending channel on the 1-hour frame, adhering well to it, and is heading for a strong breakout and retest.
We are experiencing a rebound from the lower boundary of the descending channel. This support is at 108883.
We have a downtrend on the RSI indicator that is about to be broken and retested, supporting the upward trend.
We are looking for stability above the 100 Moving Average.
Entry price: 109380
First target: 109948
Second target: 110800
Third target: 111670

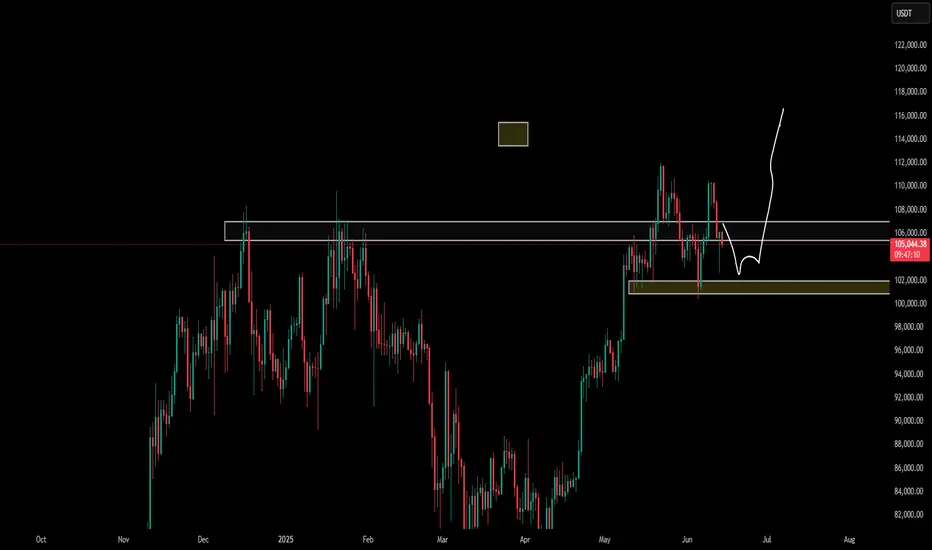
Bitcoin - Plan for summer 2025 (no new ATH, big range!)Bitcoin's price action is statistically very boring during summer seasons! Usually high volatility kicks in in September. I think we cannot really expect a new all-time high in the next few weeks. Instead, we should see a big range. Why? Let's take a look at technical analysis.
On the chart we can clearly see a blue trendline, and price went below this trendline at the end of May. This indicates that the uptrend is over and a consolidation/distribution phase is in progress. This phase is usually represented as a bull flag, triangle, rectangle, or wedge. When we look at the current price action, it looks like a bullish flag consolidation pattern. In this case we will probably see multiple liquidity sweeps below the previous swing lows to kick out early longs.
There are 2 types of traders. The first one they love to trade ranges, and the second they love to trade breakouts and higher volatility environments. Currently I think Bitcoin is creating a range, so do not expect any crazy movements until this range is valid.
Bullish flags are usually bullish patterns, but often they break down and act like bearish patterns. So what would happen if this bullish flag breaks down? That would send the price of Bitcoin to the 0.618 FIB, which is at 88,882 USDT. What is this bullish flag breaks out? That would send the price of Bitcoin to 116,000 to 125,000, but to establish this price we first need to see low of the bull flag, which is not confirmed yet. I will definitely inform you in one of my next analyses, so write a comment with your altcoin + hit the like button, and I will make an analysis for you in response.
At the end of each post, I share my professional trading tips: "If you realize you’ve made a poor trading decision, exit before the stop loss forces you out."
Trading is not hard if you have a good coach! This is not a trade setup, as there is no stop-loss or profit target. I share my trades privately. Thank you, and I wish you successful trades!
$BTC correction has just started. What is coming next?As I previously stated in my CRYPTOCAP:OTHERS , CRYPTOCAP:BTC.D , and CRYPTOCAP:TOTAL2 analysis — this move was expected. Check out my other ideas for more detailed breakdowns.
So, what’s happening?
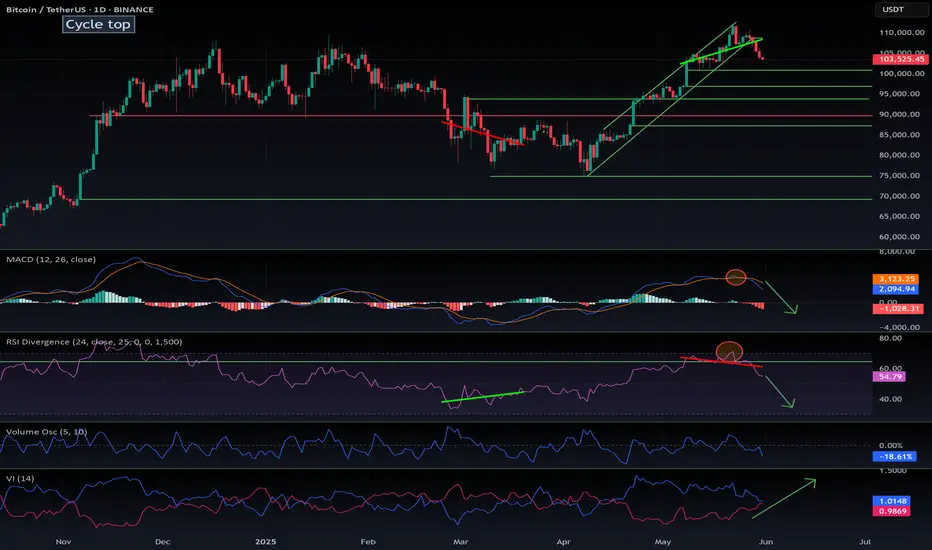
Bitcoin maximalists have been buying heavily at the top, right when RSI and MACD were in overbought territory, creating a clear bearish divergence.
Something Saylor and others seem to ignore: you can't defy mathematics — what needs a correction will correct.
CRYPTOCAP:BTC still looks bullish on the weekly timeframe, so we’re not entering a bear market. However, the pump is over, key supports have broken, and altcoins are correcting — some by -25% in a single day.
Purely from a charting perspective, we can identify multiple potential support levels for CRYPTOCAP:BTC :
$101K, $94K, $89K, $87K, with a lower-probability retest down to $75K.
We’re likely entering a 2-week correction, after which CRYPTOCAP:BTC could resume its uptrend — potentially closing June at a new all-time high.
DYOR.
#Bitcoin #BTC #Altcoins #CryptoCrash #TechnicalAnalysis #BTCdominance #TOTAL2 #BearishDivergence #Saylor #RSI #MACD #ATH #DYOR
4H Timeframe BTCUSDT Bullish Rally Setup (Buy Limit Order)This analysis provides a deeper breakdown of the previous setup, now viewed on the 4-hour timeframe. It offers a closer look at price action using 4-hour candlesticks to refine entry points and confirm the buy limit strategy for the upcoming bullish rally.

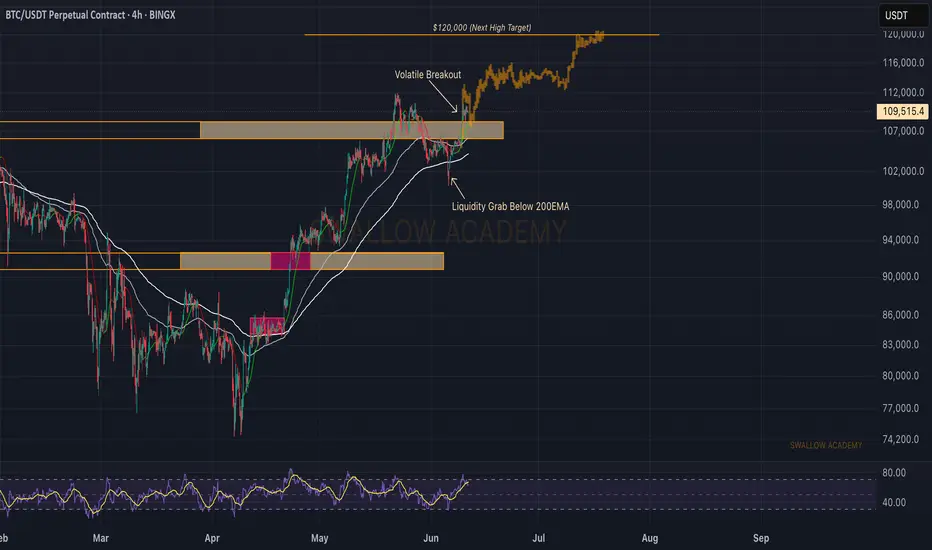
Bitcoin (BTC): Buyers Maintain The Dominance After BreakoutBuyers keep the dominance after we had that volatile breakout near $106K. As we see that buyside volume is growing, we are expecting to retest the local ATH, which is basically 1.5K away from the current price (basically nothing).
After that, we are expecting to see some volatility, which eventually will turn into a breakout and a new ATH!
Swallow Academy
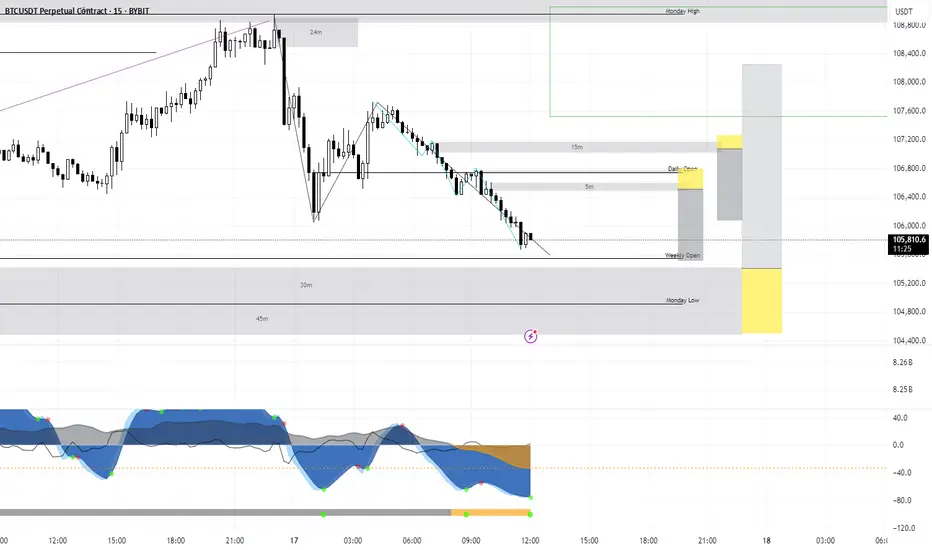
Excellent Trade yesterday! Today's PlayHere are the scalp plays I am watching today. A few continuation plays in to demand and a reaction off supply. Lets see what the NY brings.
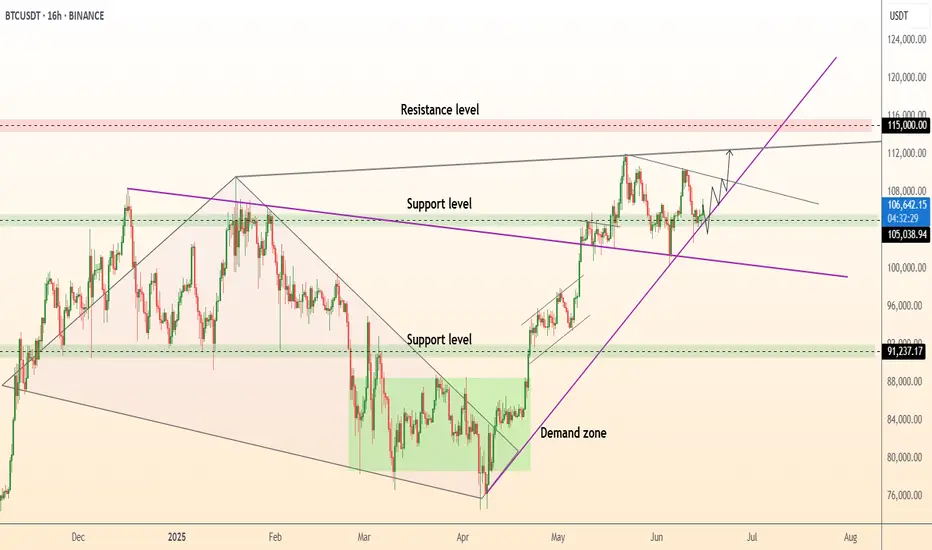
DeGRAM | BTCUSD formed the rising bottom📊 Technical Analysis
● BTC rebounded exactly at the purple long-term trend-line and green 102.5-104 k demand, reclaiming the 105-106 k support band; the old wedge cap is now acting as a floor.
● Price is coiling in a 16-h bull flag beneath 108 k; its 1.618 projection intersects the channel roof/ red supply at 111.6-115 k, while rising lows keep momentum pointed up.
💡 Fundamental Analysis
● U.S. spot-BTC ETFs attracted about $240 m of net subscriptions on 14 Jun, ending the outflow streak and signalling renewed institutional demand as exchange reserves slide to multi-year lows.
● Benchmark 10-yr Treasury yields are back under 4.45 %, easing dollar pressure and helping risk assets rebuild after the FOMC spike.
✨ Summary
Buy 105-106 k; flag breakout above 108 k targets 111.6 k → 115 k. Invalidate on a close below 101.8 k.
-------------------
Share your opinion in the comments and support the idea with a like. Thanks for your support!
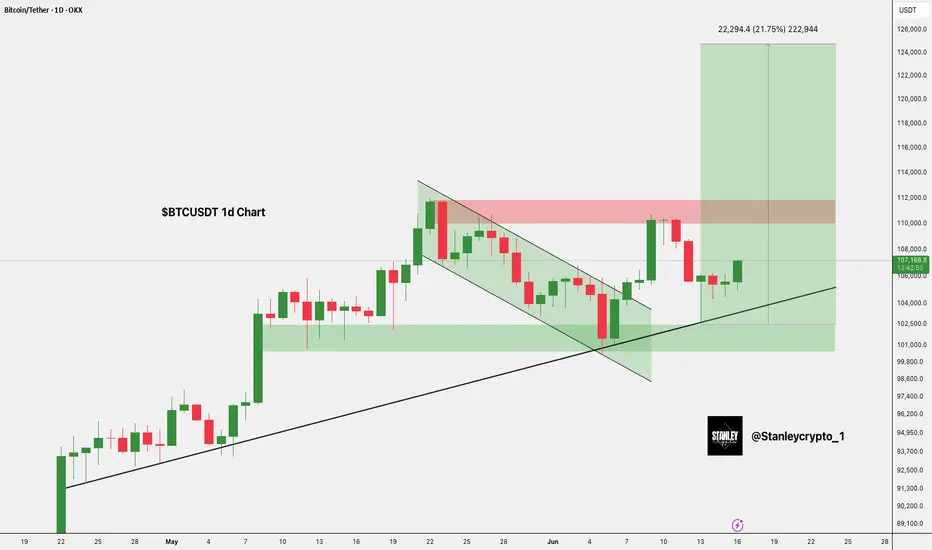
$BTC Breakout Targets $125KCRYPTOCAP:BTC has broken out of a falling wedge and is holding strong above the $103K support zone.
Price is pushing upward toward the key resistance at $110K– $112K.
A breakout above this zone could trigger a move toward $125K.
DYRO, NFA
Using double PAR to perfect entriesUsing double PAR to perfect entries - This is a crash course but can be more involved for continuation trades

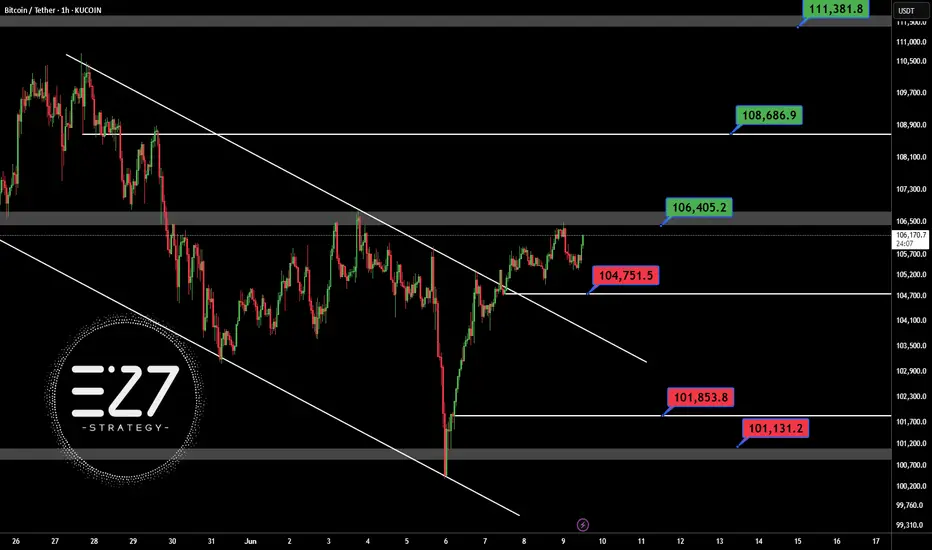
BTCUSDTSafe for open long position in BINANCE:BTCUSDT abow 106.400$ in H1 time frame.
First support: 104.750$
Best support: 101.850 - 101.131 $
First resistance: 106.400$
Best target this chart: 108.700 - 111.381$
Contol money management