BTCUSDT.P trade ideas
BITCOIN Short Position Update – June 11, 2025We are the SeoVereign Trading Team.
With sharp insight and precise analysis, we regularly share trading ideas on Bitcoin and other major assets—always guided by structure, sentiment, and momentum.
🔔 Follow us to never miss a market update.
🚀 Boosts provide strong motivation and drive to the SeoVereign team.
--------------------------------------------------------------------------------------------------------
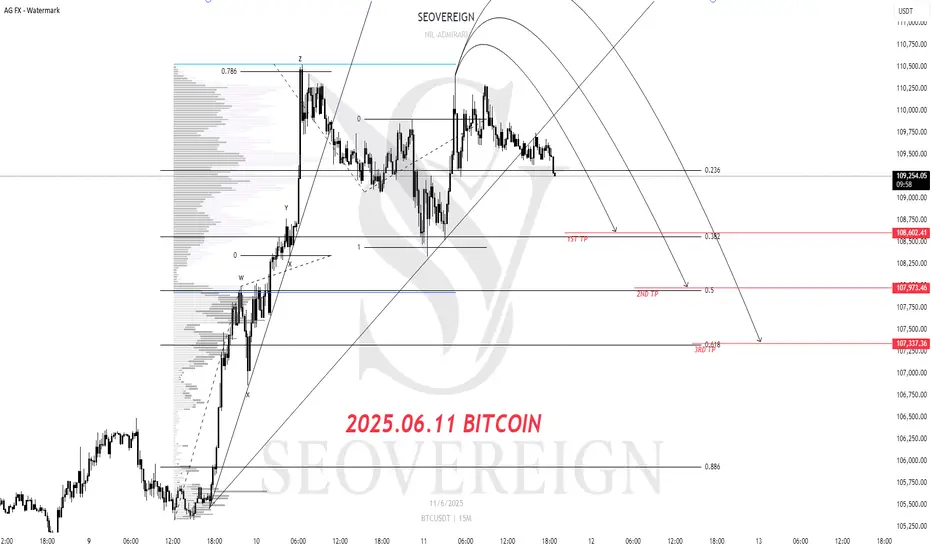
Bitcoin downside perspective shared.
Currently, Bitcoin appears to have entered an overheated zone based on both Elliott Wave Theory and harmonic pattern analysis.
While it has been continuously setting new highs alongside Ethereum, the technical structure suggests the possibility of a short-term pause.
Accordingly, a bearish idea is shared.
The first target is set at 108,600.
More detailed ratio analysis and additional reasoning will be shared through an idea update once the first target is reached.
Flexible response according to market conditions is necessary.
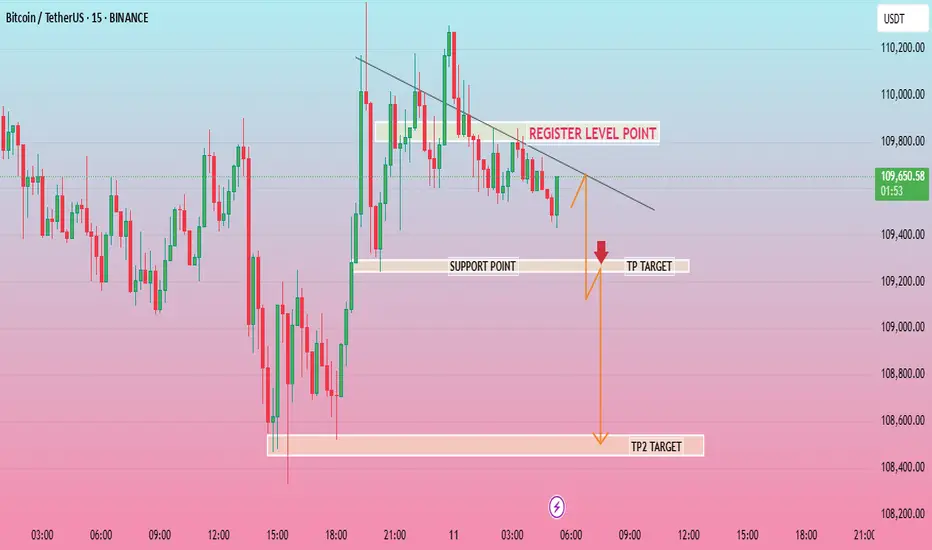
BTCUSD 15MThe chart you've shared is a 15-minute candlestick chart of Bitcoin/USDT (BTC/USDT) on Binance, with a short-term bearish outlook. Here's a breakdown of the analysis shown in the image:
---
🔍 Key Levels Identified:
Register Level Point (Resistance): Around 109,750 USDT
This is where price previously failed to break higher—acting as a local resistance.
Support Point: Around 109,350 USDT
This is the level where price has bounced before, now being tested again.
---
🎯 Trade Setup:
Entry Trigger: The price is approaching the support zone again. A break below the support could confirm the bearish move.
TP Target (Take Profit 1): ~109,250 USDT
A moderate take-profit level just below the support level.
TP2 Target (Take Profit 2): ~108,300 USDT
A deeper target, suggesting a stronger continuation of the downtrend if the support breaks convincingly.
---
🔻 **Bearish Bias Justification
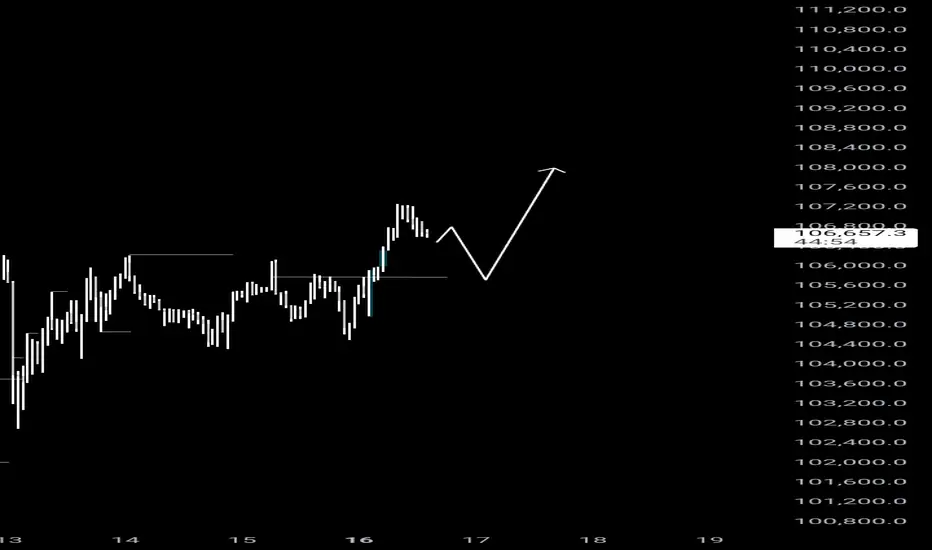
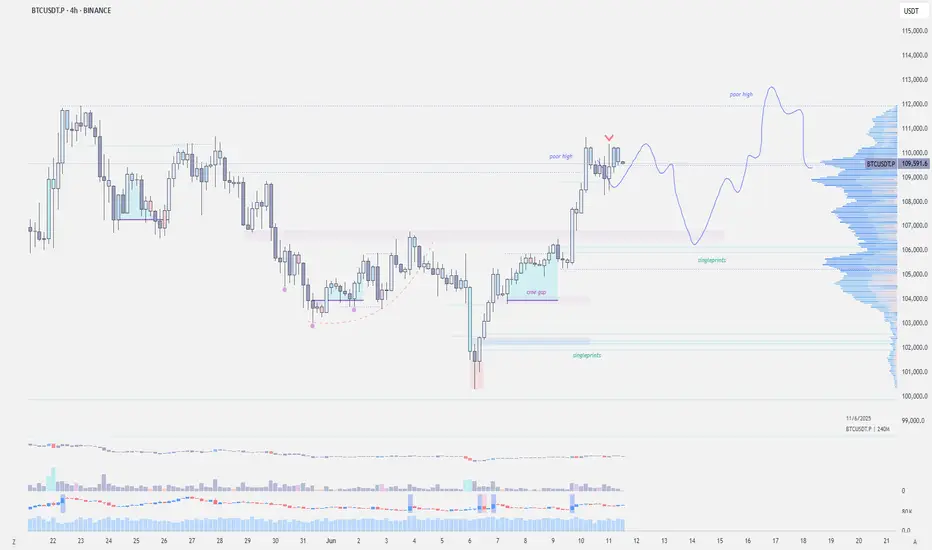
$BTC - Poor HighsBitcoin cleared the previous highs resting at 110k; however, it is still facing resistance at 110.3k.
We need to break above 110k to clear the significant highs at 112k.
Otherwise, I still expect a retest of 106k–107k before any further upward movement.
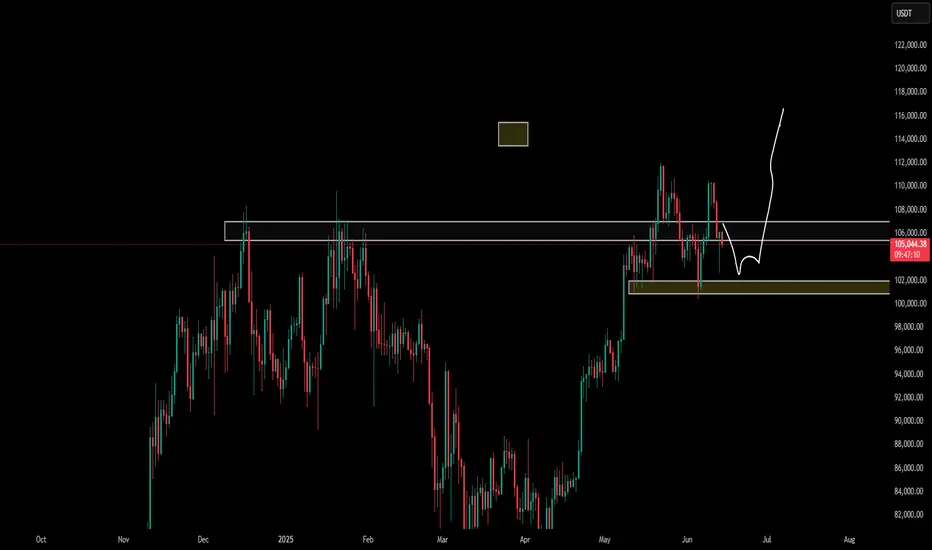
BTC long if it reclaims or holds ### 🔍 Breakdown of Chart:
* Timeframe: 15m BTCUSDT (Bybit)
* Current Trend: Sharp downtrend from the recent highs
* Zone Marked in Blue: Bullish Order Block / Demand Zone
* Yellow Path: Anticipated reclaim and reversal scenario
* White Curve: Possible double bottom (liquidity sweep)
---
### ✅ Why Long Plan Makes Sense:
1. Demand Zone (Blue Block):
This zone has previously caused a strong bullish reaction. It's likely institutional demand may rest here again.
2. Liquidity Grab Below:
Price might sweep the recent low (creating a trap for shorts) before reclaiming. That’s your “double bottom” logic.
3. Reclaim = Confirmation:
Waiting for a reclaim above the zone before longing shows patience and discipline — a smart move to avoid catching a falling knife.
4. Clear Invalidations:
If price fails to reclaim and breaks below the blue zone with momentum, your setup is invalidated — perfect risk control.
---
### ⚠️ Caution:
* If the red bearish OB above (around 104.6–104.8K) is respected, you might face rejection there. Consider partial profits before that area.
* Use confirmation (like a bullish engulfing, BOS, or FVG fill) after reclaim.
* If breaks blue zone then we might enter short

HolderStat┆BTCUSD forming a triangleBINANCE:BTCUSDT is bouncing from the 104 k pennant foot on trend support, turning squeeze into bullish advance. Holding the rising line preserves upside bias; clearing 111 k unlocks 121 k and ATH chase 🏆

btc for long 30m*The content on this analysis is subject to change at any time without notice, and is provided for the sole purpose of assisting traders to make independent investment decisions.
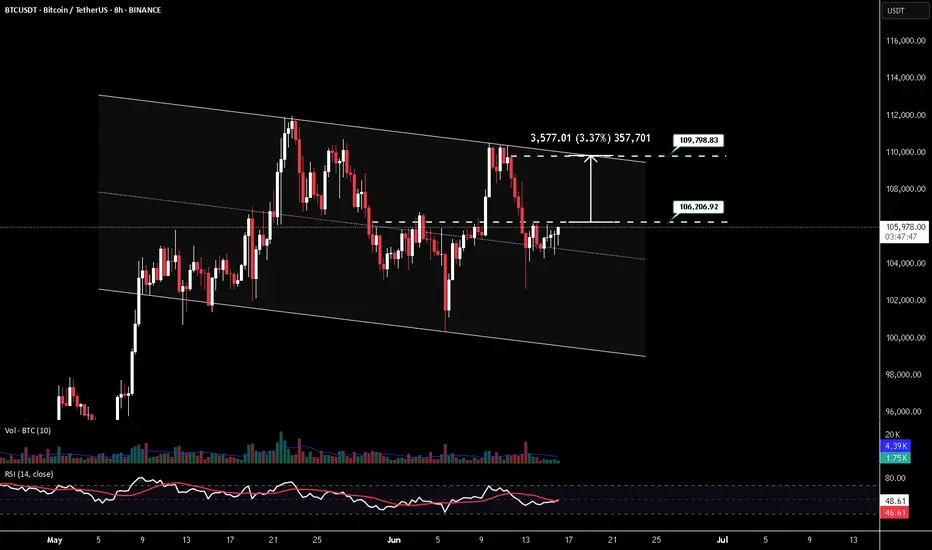
BTCUSDT LONG POSITIONENTRY: 106206.92
TAKE PROFİT : 109798.83
STOP LOSS : 1/3
Do not use high leverage!
Remember cash management (planning)!
Please follow the stop-loss rule!
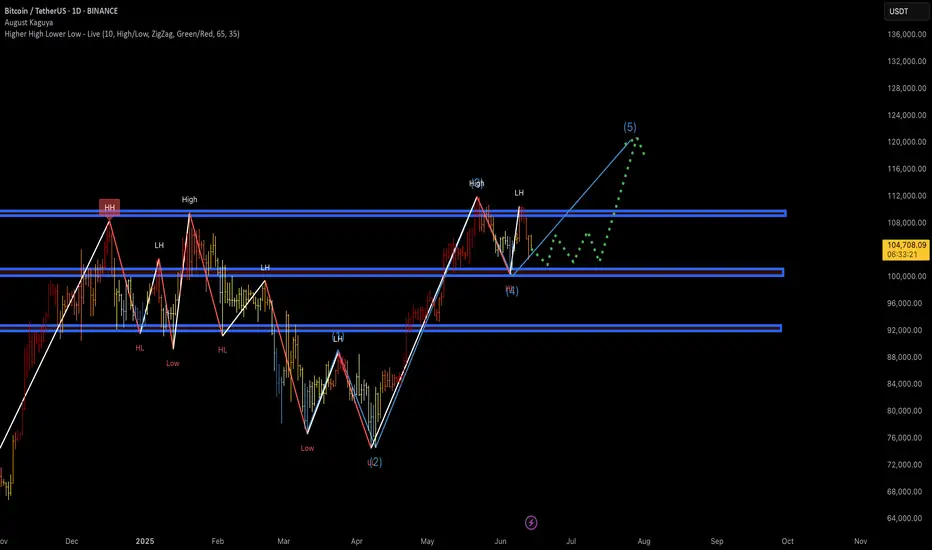
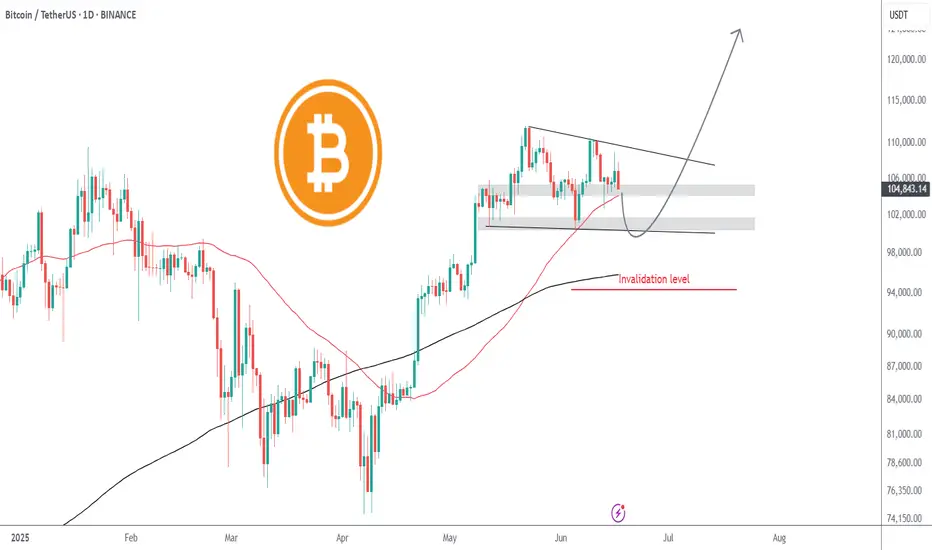
Wave (4) Correction Completed? Wave (5) ImminentBitcoin appears to be completing an Elliott Wave structure, currently sitting around the (4) pullback area with signs of a potential continuation into wave (5) to new local highs. The recent LH and bounce from demand could mark the beginning of the impulsive move.
Key Observations:
✅ Elliott Waves Count (1–2–3–4–5) in Play
Wave (3) completed near ~$113K
Wave (4) correction retraced into the ~$98K support zone
Structure looks corrective (ABC style), typical for wave 4
Wave (5) projection aims towards ~$120K+ based on symmetry
✅ Market Structure
Higher High (HH) → Higher Low (HL) pattern intact
Price respected a key demand zone and bounced
Green dotted line shows potential consolidation → breakout behavior
✅ Support Zones
~$98K = key demand + previous HL
~$92K = macro structure support
Holding these levels = bullish continuation scenario likely
✅ Resistance Ahead
~$113K = recent local high
Break and close above this = wave (5) confirmed
Final TP area ~$120K–124K based on Fibonacci extensions and wave symmetry
🎯 Trade Plan (Idea)
Entry: On confirmation above $106K
Targets:
TP1: $113K (retest)
TP2: $120K
TP3: $124K
Bitcoin long 97kPlanning on a push below 100k over the next few days, I'll be looking for possible entry around 96 - 98k if LTF shows good support.
The monthly open is at 100k so Id expect to see some rejection at that level, there's also a monthly FVG around 97k which price could revisit.
My target will be the BTC highs, areas of interest marked on the chart.

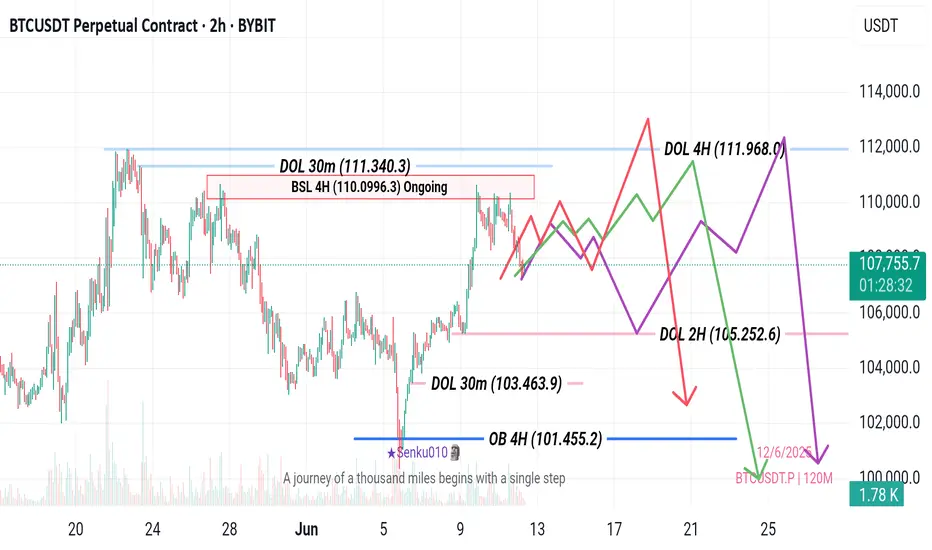
BTC Bias Update tug-of-war between key liquidity zones
• Liquidity Magnets:
• Upside: Identified Draw on Liquidity (DOL) at higher levels (e.g., 111,968.0 (4H), 111,340.3 (30m)) and an "Ongoing" BSL 4H at 110,0996.3 present resistance and potential targets for bullish moves.
• Downside: Prominent DOLs (e.g., 105,252.6 (2H), 103,463.9 (30m)) and a critical SSL zone between 100,500.0 - 100,000.0 (4H, 2H, 1H) act as significant downside targets.
Bias Assessment:
• Bearish Bias: 65%
• The immediate price action suggests a likely "Draw on Liquidity" towards the substantial Sellside Liquidity (SSL) zone around $100,000, consistent with recent minor bearish momentum.
• Bullish Bias: 35%
• The bullish case hinges on a potential strong reversal from the confluence of the $100,000 SSL and the powerful Bullish Order Block, which could then target the overhead Buyside Liquidity.
BTCUSDT | Neutral to Bearish Bias | Range Top | (June 8, 2025)BTCUSDT | Neutral to Bearish Bias | Range Top + Money Flow Out | (June 8, 2025)
1️⃣ Insight Summary:
Bitcoin is currently ranging near the top of a multi-day structure, but money flow has been consistently negative on the daily — hinting at hidden weakness. I'm now preparing for a potential move lower despite recent bullish sentiment.
2️⃣ Trade Parameters (Risk Management Focus):
Bias: Neutral to short-term bearish
Key Level to Watch: ~$94,000 (potential support target)
Risk Strategy:
— Reducing altcoin exposure by 50%
— Moving stop losses to entry across open positions
— Hedging if downside momentum increases
(This is not financial advice — just a view on how I’m managing risk.)
3️⃣ Key Notes:
❌ Money Flow Weakness: Daily outflows have been persistent across the entire consolidation — a warning sign even if price holds range highs.
📊 4H Structure: Still within a clean range. Currently at the top, which historically has triggered rejections.
🔥 Exchange Behavior: We're seeing flows back into exchanges, not out — which could suggest increased sell pressure or rotation rather than long-term accumulation.
🧠 Sentiment Caution: While many are still targeting higher levels (like $100K+), this current range and flow data suggests a pause or pullback before continuation — if it happens.
4️⃣ Follow-Up:
Will stay cautious and flexible. If BTC breaks above the range cleanly with strong volume and inflow data flips, I’ll re-evaluate bias. Until then, managing exposure tightly.
Please LIKE 👍, FOLLOW ✅, SHARE 🙌 and COMMENT ✍ if you enjoy this idea! Also share your ideas and charts in the comments section below! This is best way to keep it relevant, support us, keep the content here free and allow the idea to reach as many people as possible.
Disclaimer: This is not financial advice. Always conduct your own research. This content may include enhancements made using AI.

HolderStat┆BTCUSD preparing to test 110kYesterday's rise in CRYPTOCAP:BTC puts the immediate target at testing 110,000 and 112,000 and after that opening a new ATH. Local resistance has been broken.
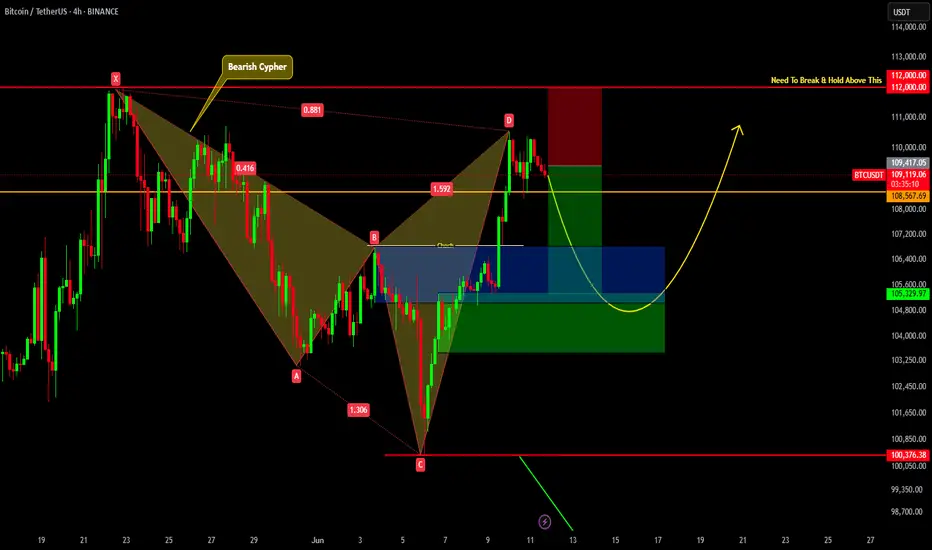
BITCOIN SHORT TERM UPDATE!!! Recently we have seen a great price move from 100K to 110K. We got clear Change Of Character , which indicates a sign of strength. Also we got bearish cypher harmonic pattern formed. So now we can expect a slight pullback up to 106-103k region from there we may see price reversing. But price should hold 100.3K region to remain bullish in short term.
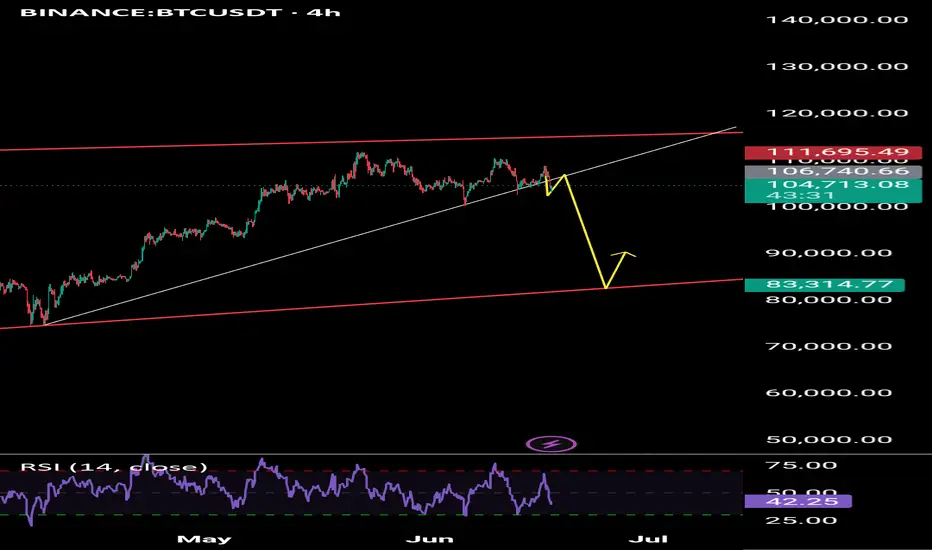
Bitcoin to revisit $100k | Summer price target = $120kGeopolitical tension is causing fear in the markets. Today, Bitcoin fell from $107.7k to current price $105k with no sign of buyer support whatsoever, printing 11 consecutive H1 red candles intraday. Like a hot knife through butter.
At $105k, there is very little support. Sell volume absolutely overshadowed the tiny buy volume. Bulls have yet to close a green candle. I believe in the next few hours Bitcoin will be trading at $104k, followed by the first stop $102k.
$102k can serve as an entry point, depending on how price reacts. $100k is the optimal entry point for maximum profit, after mass liquidations. Retail traders are confident that the liquidity hunt is over after the initial tap, placing stops and liquidation levels at $100k.
Invalidation level will be beyond the 200SMA. The 200SMA have historically proven itself time and time again as a safe zone during rallies after golden crosses.
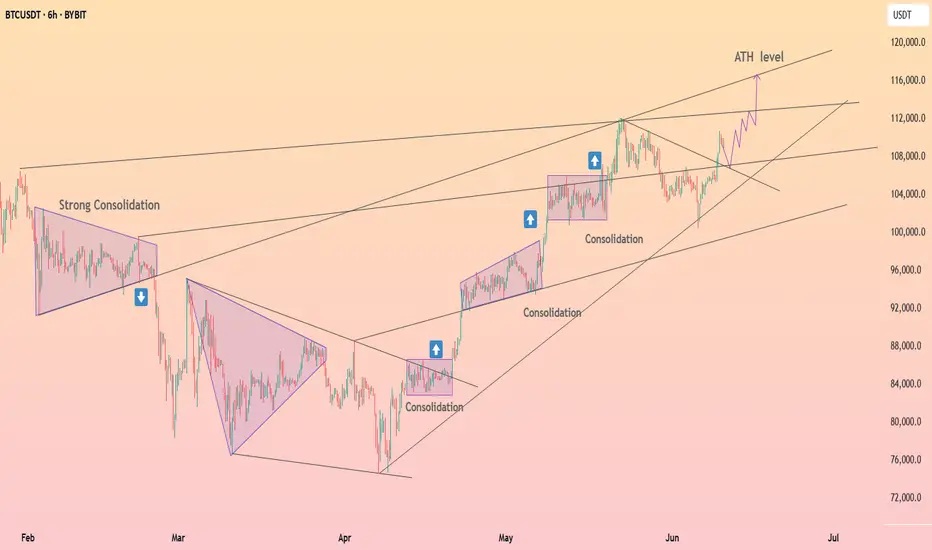
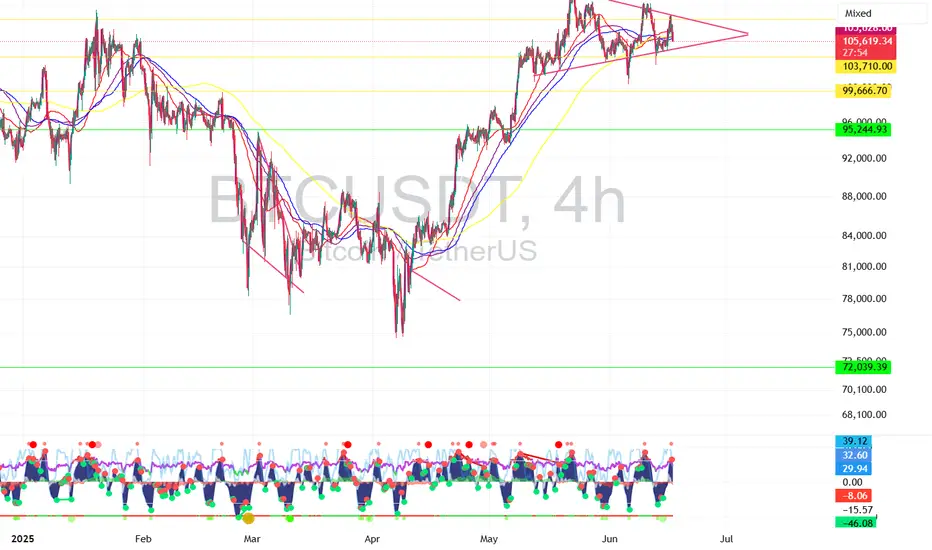
$BTC 4hr - The Calm Before Bitcoin’s Next Move💡 In bull markets, triangles break UP more often than down.
But volume + macro + ETF flows > patterns.
Set alerts, manage risk, stay nimble.
#BTC #CryptoAlpha #RiskManagement
🎯 Key Levels Analysis:
✅ Resistance: 106.3K
→ This level matches the upper bound of the symmetrical triangle and is reinforced by multiple recent rejections. Also aligns with previous highs.
✅ Support: 103.7K
→ Mid-range horizontal support. Price reacted here multiple times. It's also near the triangle base.
✅ Support: 99.6K
→ Clean psychological + technical level. A previous consolidation zone. Would likely trigger a strong reaction.
✅ Last Line of Bull Defense: 95.2K
→ Major horizontal support from the April/May breakout structure. Losing this would likely invalidate the bullish structure.
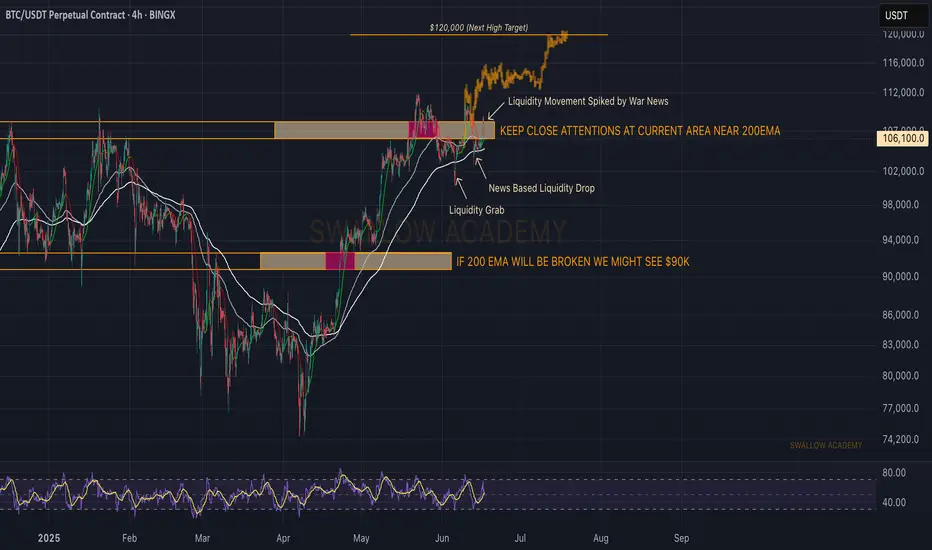
Bitcoin (BTC): Markets are Cooked | Big Volatility IncomingYes, markets are cooked....all those tensions and news that are pressuring markets from every corner might result in a very explosive movement.
Now we've been looking for a new ATH to form near $120K and we still keep that game plan as long as buyers keep the dominance above the 200EMA line.
There is not much we can do now but just speculate. Speculate that when the war between Russia and Ukraine happened, what markets did exactly was they dumped and then shot highly up (talking mainly about Bitcoin).
So we might see similar things in the markets depending on what will happen next in the world, but one thing is sure: some will make a lot of money soon and some will lose a lot. Be sure to have proper risk management, as this is crucial!
Swallow Academy
bitcoin is pumpingBitcoin has been pumping in the past few days pretty massively. Why? There are 2 main reasons - the first reason is that Bitcoin has finished a major WXY corrective wave, and the second is that Bitcoin swept liquidity below a triangle (see my previous post for details). That was a very good opportunity to buy/long Bitcoin at that specific level I described in the previous analysis. But let's focus on the present and future!
We always want to find strong levels on the charts so we have a great entry point/take profit target. The next strong level is definitely the 0.618 FIB, which Bitcoin can hit in the very short term. Also, below the 0.618 FIB, we have a strong horizontal zone, which can also act as a strong resistance. Bitcoin should definitely go there and retest this zone.
We want to see how Bitcoin is going to react in the zone and FIB, but you can create a new limit order to short Bitcoin there so you don't miss anything. So currently I am temporarily bullish on Bitcoin, and in the next update I will make a big analysis on Bitcoin and a very likely scenario for the next months. What will the price of Bitcoin be in December? Please like/boost my idea right now.
Write a comment with your altcoin + hit the like button, and I will make an analysis for you in response. Trading is not hard if you have a good coach! This is not a trade setup, as there is no stop-loss or profit target. I share my trades privately. Thank you, and I wish you successful trades!
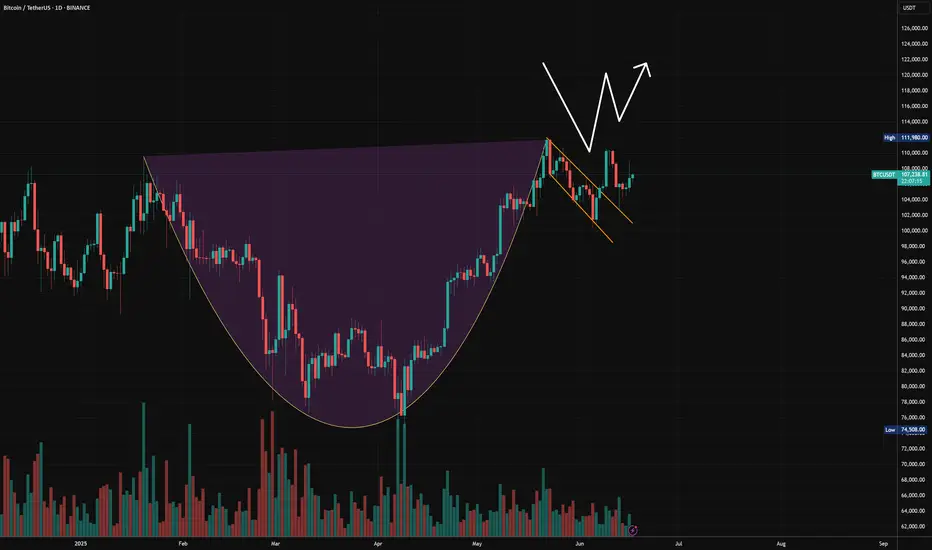
W pattern off the handle. #Bitcoin to 168K.From my most recent post of the Cup & Handle I see a W pattern. Price broke out of the handle to retest to confirm support creating a double bottom.
This is a very good sign to confirm the C&H for this bullish near future.
If we continue upwards and break the psychological resistance zone at 111K, I expect 168K within 3-6 months.
I attached the Cup and Handle analysis to the current.
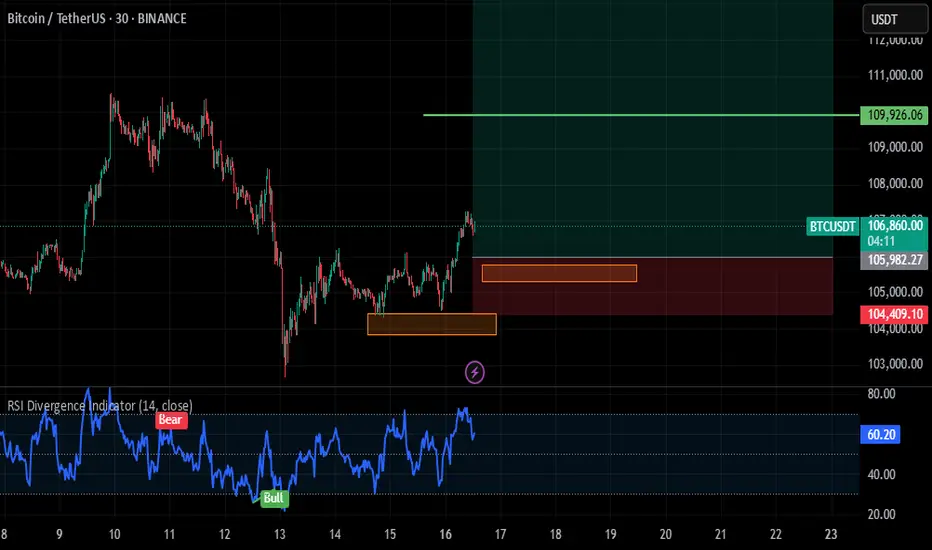
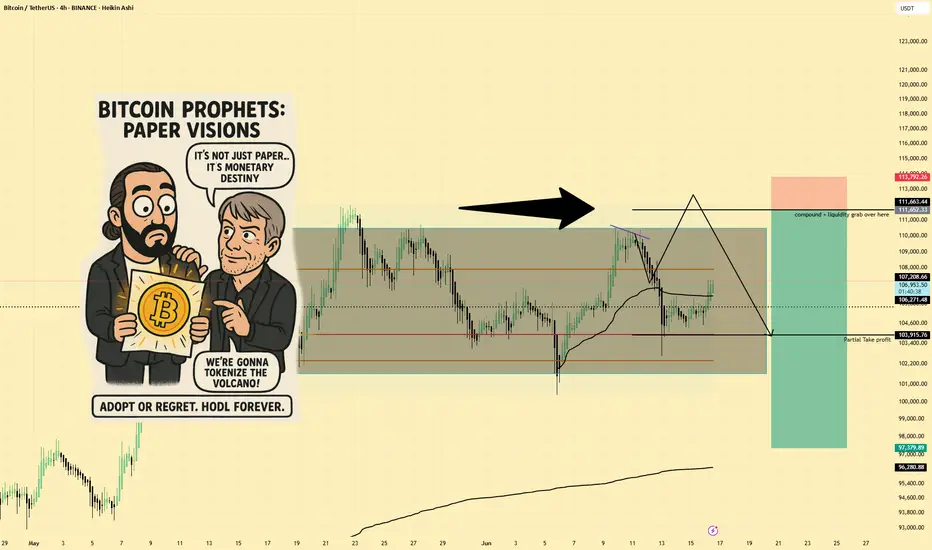
BTCUSD | Short Bias | Liquidity Grab | (June 16, 2025)BTCUSD | Short Bias | Liquidity Grab Setup | (June 16, 2025)
1️⃣ Short Insight Summary: Bitcoin hit a solid take-profit earlier, but now I’m watching for a potential liquidity grab near the highs to set up a short opportunity. The next key zone to watch is around 1:11 PM if price quickly spikes and reverses.
2️⃣ Trade Parameters:
Bias: Short
Entry: Around 113 (after a confirmed liquidity grab at the top)
Stop Loss: Just above the liquidity grab zone
TP1: Around 103900 (Point of Control zone)
TP2: Final target at 97900
Partial Exits: Possible scaling out at POC zone
3️⃣ Key Notes: Spot selling is active, but there's also a lot of buying interest—especially from those trying to long this dip. That mix can lead to a fast liquidity grab, flushing out early shorts before a reversal. Open interest suggests there's still a lot of activity, so I’m being patient and only acting on confirmation.
4️⃣ Optional Follow-up: I’ll keep an eye on this setup and update if the reversal confirms after the grab.
Please LIKE 👍, FOLLOW ✅, SHARE 🙌 and COMMENT ✍ if you enjoy this idea! Also share your ideas and charts in the comments section below! This is best way to keep it relevant, support us, keep the content here free and allow the idea to reach as many people as possible.
Disclaimer: This is not financial advice. Always conduct your own research. This content may include enhancements made using AI.
Btcusd buy ideaBTCUSD experienced a sell-off, filling the gap, but buyers stepped in, mitigating the decline. If buyers hold and consolidate above $105,500, it could pave the way for a potential rally towards $108,000-$110,000. What's your outlook, traders