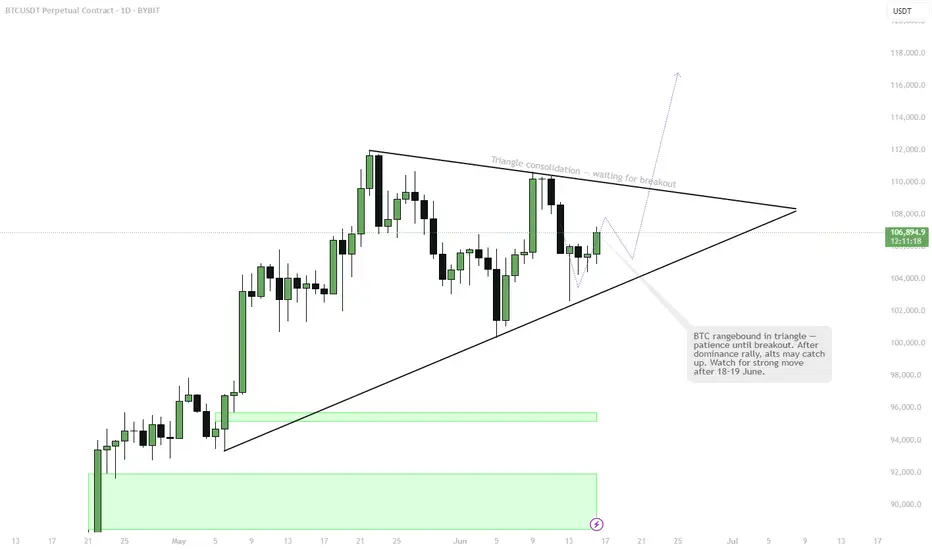
BTC is stuck in a tightening triangle — compression phaseVolatility building up into June 18–19.
Expect a big breakout.
Main scenario: breakout to the upside with a “God Candle” and new momentum for altcoins after prolonged BTC dominance.
Alts have been suppressed, but that’s part of the setup — don’t get tricked by the fake moves.
Stay patient, don’t lose focus, and be ready for a sharp move!
BTCUSDT.P trade ideas
Market Overview
WHAT HAPPENED?
Strong sales resumed last week after a short period of growth. This was provoked by the escalation of the conflict in the Middle East.
After testing and fixing the $105,800-$104,500 zone (accumulated volumes), strong volume deviations appeared, which should be perceived as protection on the part of the buyer.
WHAT WILL HAPPEN: OR NOT?
At the moment, an attempt is being made to position the volumes accumulated in the range of $105,600-$104,700 in the direction of growth. Strong support has already been formed in the area of $104,000-$102,900 (abnormal volumes).
When the four-hour candle closes above the $106,400 mark, it’ll be possible to additionally consider the zone of accumulated volumes for buys (if there is a reaction from it).
The main scenario is a long position with targets up to the nearest resistance. In case of easing of geopolitical tensions, there remains the possibility of updating the ATH.
Alternative scenario: correction to the support zone of $101,600-$100,000 (volume anomalies). With this development, a prolonged rebound is possible.
Sell Zones:
$109,000–$110,000 (accumulated volume)
Buy Zones:
$105,600–$104,700 (accumulated volume)
$104,000–$102,900 (volume anomalies)
$101,600–$100,000 (significant volume anomalies)
$98,000–$97,200 (local support)
Level at $93,000
$91,500–$90,000 (strong buying imbalance)
IMPORTANT DATES
Macroeconomic developments this week:
• Tuesday, June 17, 03:00 (UTC) — publication of the Japanese interest rate decision;
• Tuesday, June 17, 12:30 (UTC) — publication of the core retail sales index for May in the United States, the volume of retail sales for May in the United States;
• Wednesday, June 18, 06:00 (UTC) — publication of the UK consumer price index compared to May last year;
• Wednesday, June 18, 9:00 (UTC) — publication of the consumer price index in the Eurozone compared to May last year;
• Wednesday, June 18, 12:30 (UTC) — publication of the number of initial applications for US unemployment benefits;
• Wednesday, June 18, 18:00 (UTC) — publication of FOMC economic forecasts, FOMC statement, US Federal Reserve interest rate decision;
• Wednesday, June 18, 18:30 (UTC) — US FOMC Press Conference;
• Thursday, June 19, 7:30 (UTC) — publication of the Q2 interest rate decision in Switzerland;
• Thursday, June 19, 8:00 (UTC) — press conference of the National Bank of Switzerland;
• Thursday, June 19, 11:00 (UTC) — publication of the June interest rate decision in the UK;
• Thursday, June 19, 12:30 (UTC) — publication of the number of initial applications for unemployment benefits in the United States;
• Friday, June 20, 12:30 (UTC) — publication of the Philadelphia Federal Reserve's index of manufacturing activity for June in the United States.
*This post is not a financial recommendation. Make decisions based on your own experience.
#analytics
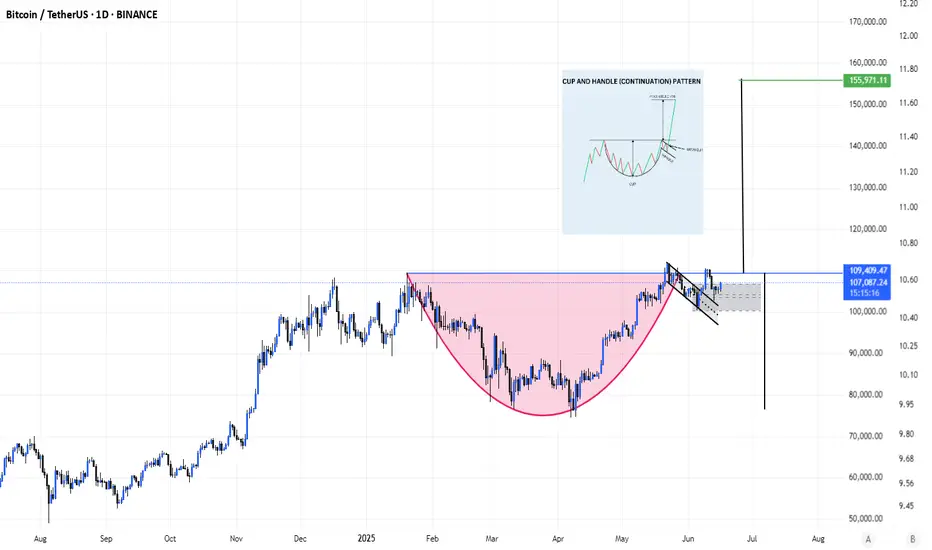
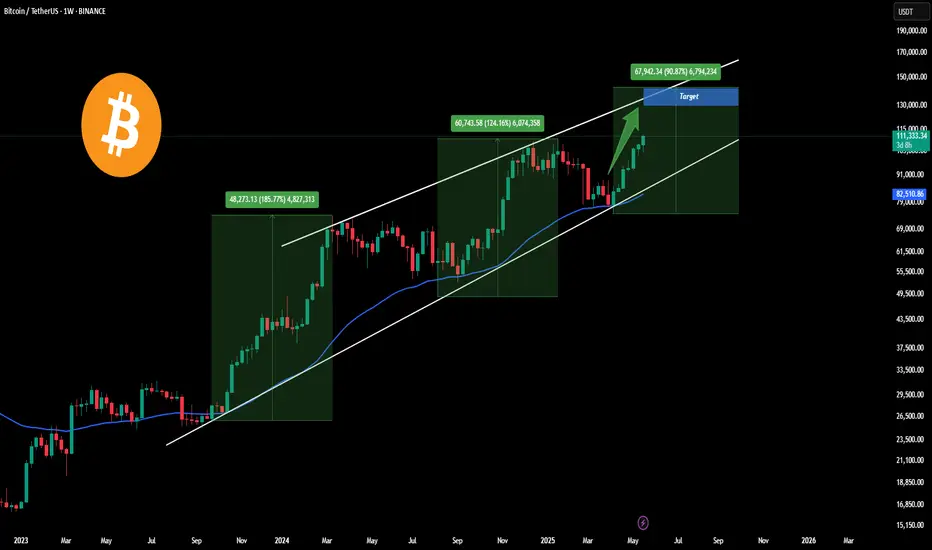
BTC/USDT.dBtc forming a beautiful Cup and Handle chart pattern. Target is $150k roughly. Price should really move hard once BTC goes above the neckline into price discovery. This is a good risk to reward setup. Enjoy!
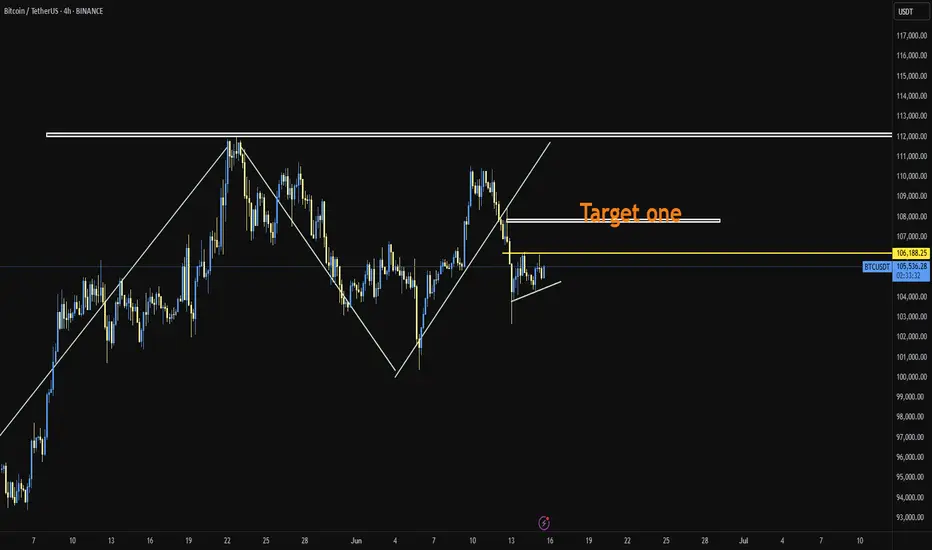
BTC/USDTWhenever Bitcoin goes above 106k, we can enter a long position at the target I specified on the chart. What do you think? Tell me.
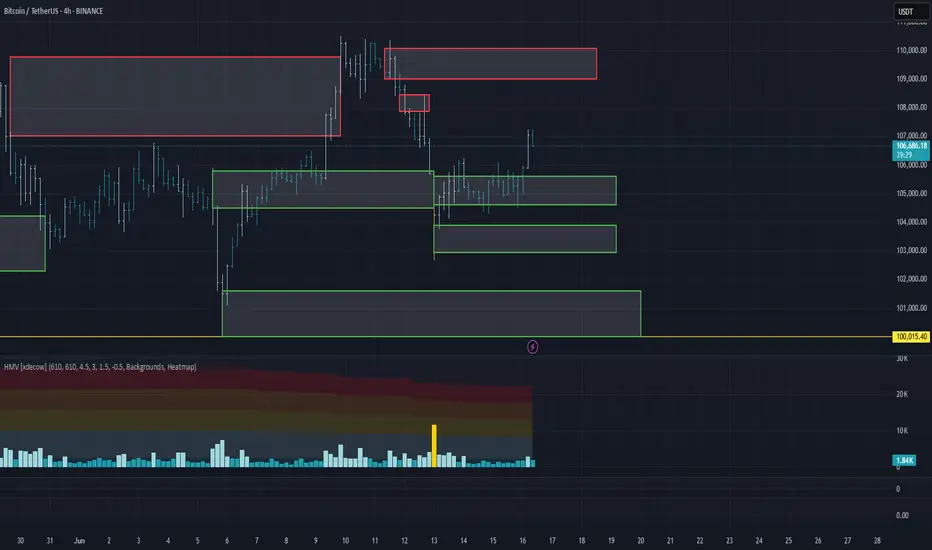
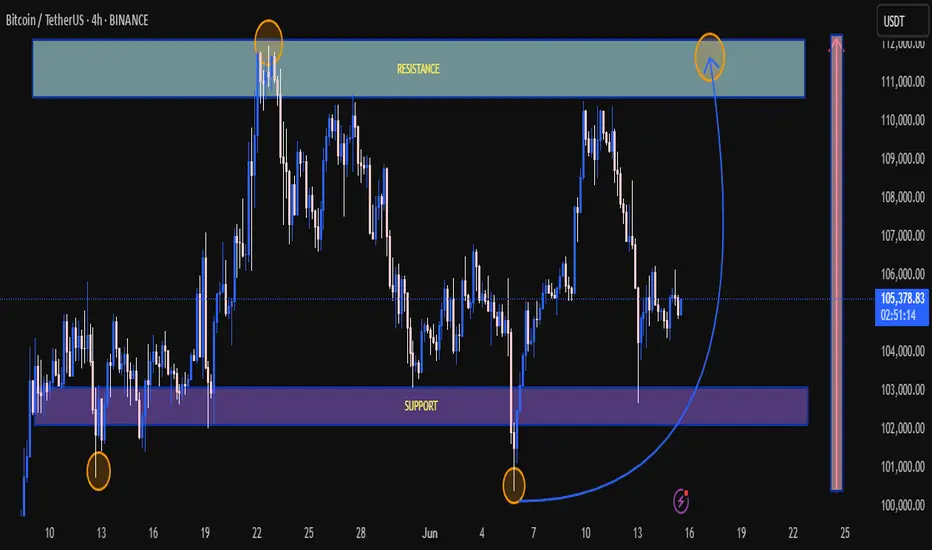
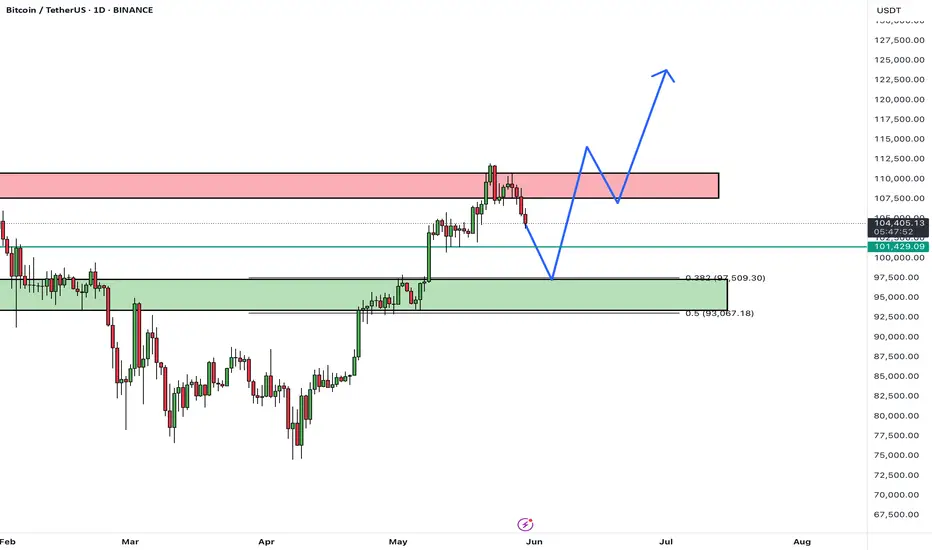
Technical Chart Analysis – BTC/USDT (4H Timeframe)📊 Current Price: ~105,108 USDT
---
🔵 Support Zone (Highlighted in Purple)
Zone Range: ~102,500 – 103,800 USDT
💡 Historical Significance:
This zone has acted as a strong support multiple times (📍June 13 & June 4), marking clear demand and buyer interest.
🛡️ Buyers stepped in strongly, causing sharp price reversals from this level.
---
🔴 Resistance Zone (Highlighted in Blue)
Zone Range: ~109,500 – 111,000 USDT
🔼 Marked with multiple failed breakout attempts (📍May 21 and projected again around June 18-20).
⛔️ Sellers dominate this zone, causing price rejection each time it was tested.
---
🔁 Rounded Bottom Formation (Cup Pattern?) ☕️
⚙️ A smooth rounded recovery pattern is forming, indicating accumulation and potential bullish continuation.
📈 If price sustains and retests the resistance again with momentum, we may see a breakout attempt.
---
🧭 Key Takeaways
Indicator Insight
🟣 Support Well-defined, historically respected zone. Good risk/reward for long entries.
🔵 Resistance Strong sell pressure zone. Needs breakout for bullish confirmation.
☕ Pattern Rounded bottom = bullish setup if volume supports the breakout.
📆 Watch Zone June 17–20 – potential resistance retest.
🔔 Risk Area Failure to hold mid-range (~105K) could lead to a retest of support.
---
🚀 Bullish Scenario
✅ Break and close above 111,000 USDT with volume.
📍 Target: 113,500–115,000 USDT 📈
🐻 Bearish Scenario
❌ Rejection at resistance again.
📍 Retest of support zone ~103,000 USDT or below.
CAN YOU SPOT THE BULLISH FLAG THERE?As usual, I love clean chart. too much is too much. So, tell me whether there is a formation of bull flag there? (are we seeing the same continuation?) retracement a bit this weekend and it will continue to bull next week?
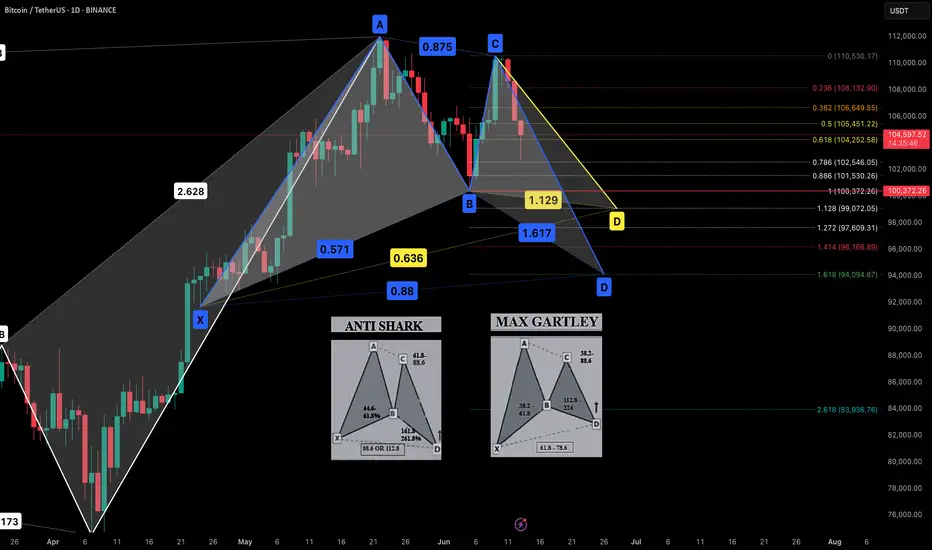
BTC harmonics2 btc harmonic possibilities to watch out for. Of course, everything can be invalidated, but they are on the chart for now until invalidation.
BTC down to 70k...maybeI've been saying this for a while now -> Most people are just not ready for BTC volatility. It may go up to 150k one day, but NOT before it hits a few trees first and maybe a cat. Best offset here is UVIX (think market volatility insurance, up +6% earlier today), Gold, and Oil now that things are heating back up again!
Best of luck and always do your own DD!

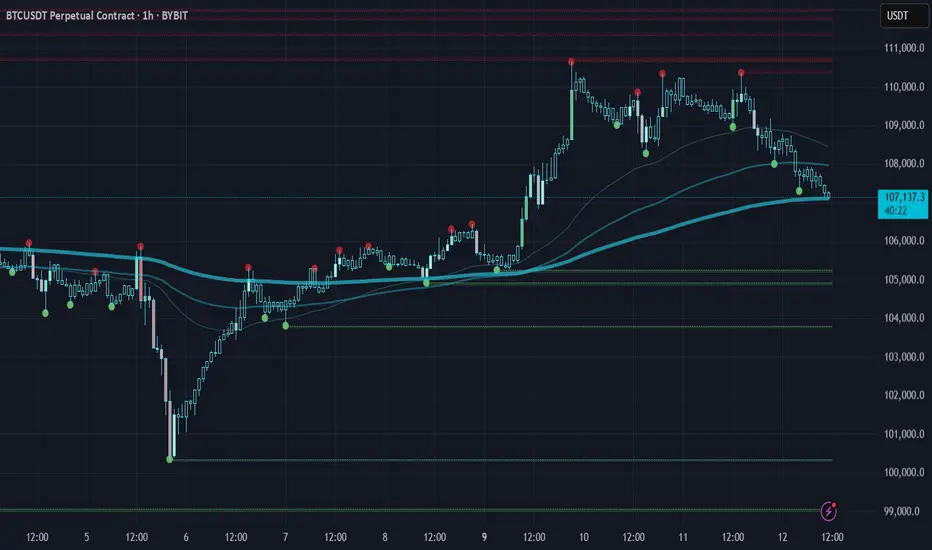
Bitcoin H1 BreakdownPrice swept 110K with weak volume → no follow-through → sharp rejection.
Now testing 200 EMA near 107K.
Lose it → 105.2K / 103.7K next.
Hold it → bounce to 110.6K likely.
Classic liquidity trap + momentum unwind.
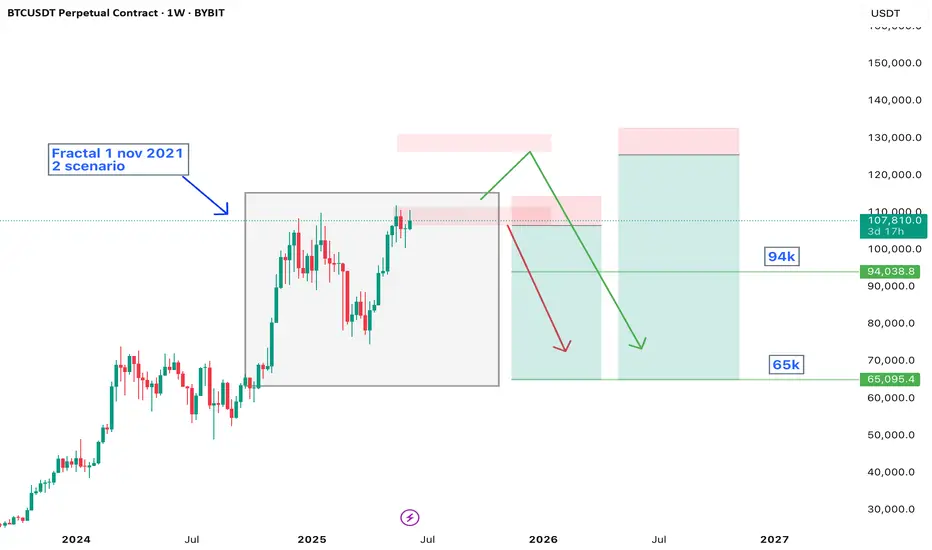
BTC game plan. 65k soon?This is my gameplan to trade Bitcoin.
Technically, there's 2 key zones to short with a nice Risk-Reward.
It's minimum profit reward on 94k, and possible to see 65k breakeven free trade.
Subscribe to earn more
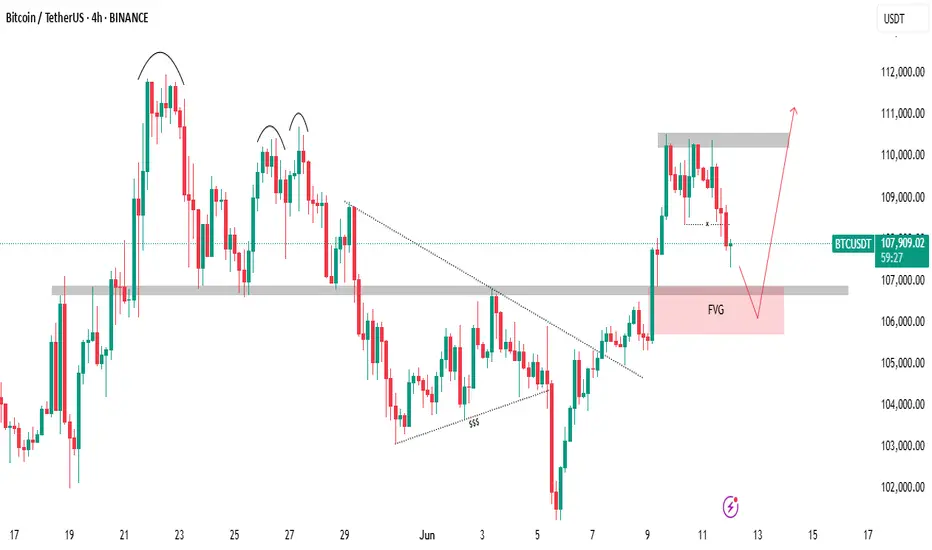
Last week Bitcoin created massive liquidity at a key resistance!🚨 Bitcoin Update – A Bullish Storm Is Brewing? 💥
Last week, Bitcoin created massive liquidity at a key resistance zone, and guess what? That liquidity is still untouched. The market hasn’t fully tapped into it yet — and that’s a big deal.
Recently, BTC smashed through resistance and even left behind a Bullish Fair Value Gap (FVG), signaling strength. But hold on—after this breakout, the market is showing signs of a minor pullback, likely to retest its marked IRL (Important Reaction Level).
📉 It’s cooling off temporarily... but don’t blink. This zone could act as a springboard for the next big leg up.
💡 Here’s the kicker: there’s still a ton of liquidity waiting above. If the market wants it—and it usually does—there’s a high probability (80%+) of another bullish push.
👀 Watch this area closely. It’s a make-or-break zone.
📊 Do Your Own Research (DYOR) – this is not financial advice, just a friendly nudge from the charts.
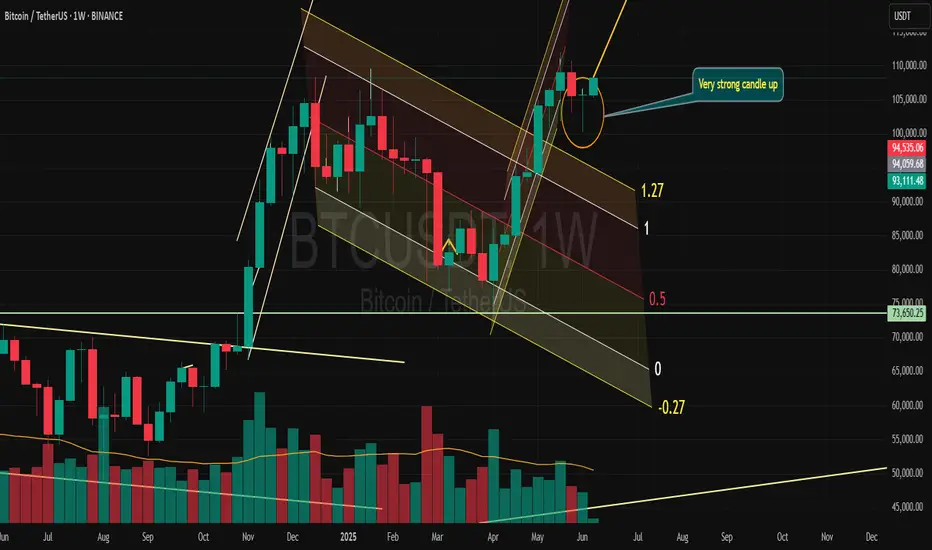
BTCUSDT – Strategy and Trend Probabilities for 2025In my opinion, Bitcoin (BTC) has become less interesting — there isn’t much room left for significant movement, and most of the “cream” has already been skimmed off. However, since it's essentially the index of the crypto market, I’m sharing this trading idea for context - to show where we currently are and what scenarios might unfold.
The price is globally moving within an ascending channel.
A secondary triangle pattern is forming.
Within this triangle, we can see the outlines of an inverse head and shoulders pattern - or possibly a cup and handle - both aligning with the channel’s resistance.
Potential scenarios:
a) Price breaks out of the triangle.
b) Price moves toward the triangle’s support, forming another wave inside it.
c) Price moves to retest the main ascending channel’s support.
d) Price fluctuates within the central range of the channel.
There aren't many options, and none of them would break the primary trend. Altcoin movements will largely depend on BTC’s behavior.
Therefore, it’s crucial to build a trading strategy that considers both the likely and less likely (but possible) outcomes.
Looking at the broader picture:
The previous minor altseason (winter 2024) was short and weak, except for a few coins.
There was no real secondary altseason in spring 2025.
Statistically, summer tends to be quiet - due to holidays and so on.
The first two points contradicted the expectations of most traders - so we’ll see how things play out with the third. If there's no altseason in summer either, then logically, winter might turn out to be quite aggressive.

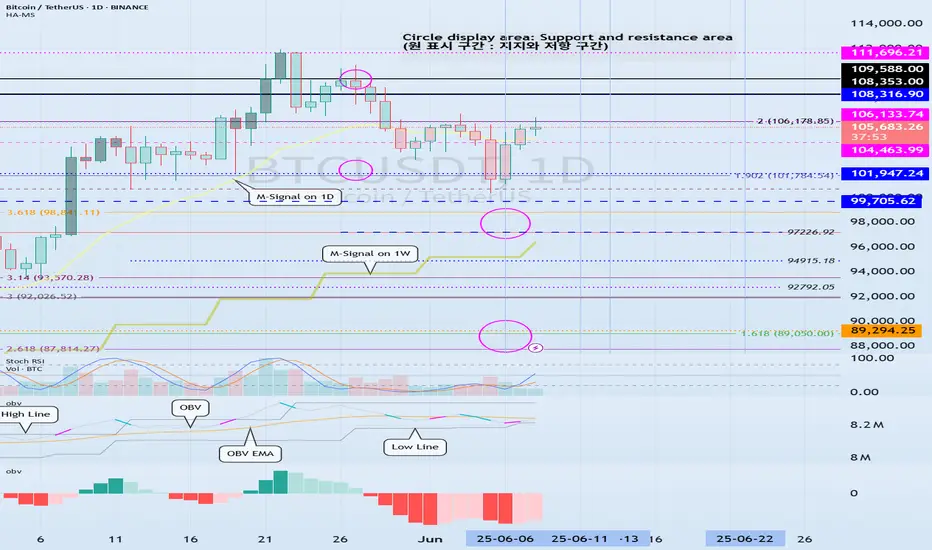
Support and resistance zone: 104463.74-106133.74
Hello traders.
If you "Follow", you can always get new information quickly.
Have a nice day today.
-------------------------------------
(BTCUSDT 1W chart)
When a new candle is created, you should check if the HA-High indicator is created at the 99705.62 point.
The reason is that the HA-High indicator was created, which means that it has fallen from the high point range.
In other words, it also means that it can fall to around or below the 97705.62 point.
Since the current candle fell to around 99705.62 and then rose, it can rise like this when a new candle is created.
We have several indicators that can determine the high point.
Representative indicators include DOM (60), StochRSI 80, and HA-High.
Therefore, the high point range is 104463.99-104984.57 and 97705.62.
Therefore, in order to turn downward, it is likely to start when it falls below 104463.99-104984.57 and shows resistance, and it can be interpreted that the downtrend is confirmed when it falls below 97705.62.
If we think about it the other way around, if the price stays above 104463.99-104984.57, it will eventually create a new high.
-
When we first study charts, we start to become curious about charts as we learn about price moving averages.
As such, when we look at charts, our understanding of charts changes depending on how well we understand the average value.
However, when we first learn about price moving averages in chart analysis, we start to study all sorts of different analysis techniques as we realize that there are ambiguous parts in conducting transactions.
As a result, chart analysis becomes more and more difficult, and we end up giving up on chart analysis.
If you have studied chart analysis in your own way without giving up on it, you will realize that it will eventually converge to the average.
No matter what indicator or analysis technique you use, you will eventually converge to the average and then diverge.
Therefore, we should try to analyze the chart using the easiest and most convenient method.
The reason is that chart analysis is ultimately just a means to create a trading strategy and has no other meaning.
-
The basic trading strategy on my chart is to buy near the HA-Low indicator and sell near the HA-High indicator.
The HA-Low and HA-High indicators are indicators created for trading on the Heikin-Ashi chart and ultimately represent the average.
The HA-High indicator is the average value that represents the high point range, and the HA-Low indicator is the average value that represents the low point range.
Therefore, if it is supported and rises near the HA-Low indicator, it is a buying period, and if it is resisted and falls near the HA-High indicator, it is a selling period.
However, since it is an average, if it is supported and rises near the HA-High indicator, it is likely to show a stepwise upward trend, and if it is resisted and falls near the HA-Low indicator, it is likely to show a stepwise downward trend.
Because of this, we need to adopt a split trading method.
-
The auxiliary indicator, StochRSI, is an indicator that moves based on the 50 point.
Therefore, when the StochRSI indicator value is below 50, we need to focus on finding a buying point, and when it is above 50, we need to focus on finding a selling point.
A decisive hint for this is when it enters the overbought or oversold zone.
The auxiliary indicator, OBV, is an indicator that adds up the difference in trading volume according to price.
If you divide the OBV indicator into High Line and Low Line and understand the movement of OBV, you can understand the movement of the price to some extent.
However, since not all indicators follow the price trend exactly, you should not try to judge everything with just one indicator.
If you express the OBV indicator in the form of an oscillator, it will look similar to the MACD oscillator.
As I mentioned earlier, this is because the chart eventually converges to the average value.
Using this characteristic, we combined the OBV indicator with a MACD-type oscillator.
If it is located below 0 based on the 0 point, it means that the selling pressure is high, and if it is located above 0, it means that the buying pressure is high.
No matter what indicator or analysis technique you study, you must have a solid basic understanding of the average value.
If not, no matter how good the indicator or analysis technique you learn, you will not be able to analyze it as you studied and create a trading strategy when you actually trade.
-
(1D chart)
It is highly likely that the uptrend will resume if it rises above the HA-High indicator point of 108316.90.
To do so, it is important to see if it can receive support and rise around 104463.99-106133.74.
If it fails to rise, it will eventually show a downward trend again.
If it meets the HA-High indicator and falls, it is likely to fall until it meets the HA-Low indicator.
Currently, the HA-Low indicator is formed at the 89294.25 point, but as the price falls, the HA-Low indicator is likely to be newly created.
Therefore, we need to check if the HA-Low indicator is newly created when the price falls.
Since the OBV of the auxiliary indicator is located near the Low Line and the OBV oscillator is also located below the 0 point, we can see that the selling pressure is strong.
Therefore, we need to check whether the OBV rises above the High Line when it is supported near 104463.99-106133.74 or whether the OBV oscillator rises above the 0 point.
-
I think that all indicators or analysis techniques are ultimately tools that confirm whether there is support at the support and resistance points or sections drawn on the 1M, 1W, and 1D charts.
Therefore, in order to use indicators or analysis techniques, it depends on how well you understand and draw the support and resistance points or sections according to the arrangement of the candles.
Therefore, you need to first check how reliable the support and resistance points you drew are and practice creating a trading strategy accordingly.
Ultimately, it can be seen that how well the support and resistance points are drawn depends on how well the chart analysis or trading strategy is made.
-
If you look at the 1W chart and the 1D chart, you can see that the important volatility period is around June 22.
The volatility period of the 1W chart is from June 16 to 29.
The volatility period of the 1D chart is from June 10 to 14 and from June 21 to 23.
Therefore, when the HA-High indicator of the 1W chart is generated at the 99705.62 point, it is important to maintain the price above 99705.62 after passing the volatility period of the 1W chart.
Since the HA-High indicator on the 1D chart is formed at 108316.90, we need to see if it can be supported and rise near 108316.90.
In summary, we can see that the important support and resistance range in the volatility period is 99705.62-108316.90.
Among these ranges, it is expected that the wave will start depending on whether the current price is supported in the 104463.99-106133.74 range.
In other words, the 104463.99-106133.74 range corresponds to the middle range of the 99705.62-108316.90 range, the average value.
-
Thank you for reading to the end.
I hope you have a successful transaction.
--------------------------------------------------
- This is an explanation of the big picture.
(3-year bull market, 1-year bear market pattern)
I will explain more details when the bear market starts.
------------------------------------------------------
The market recently managed to close above the Breaker Block!Bitcoin Market Update (Extended & Insightful):
The current update for Bitcoin remains largely the same as the previous one. However, there have been some slight yet significant shifts in the market behavior.
The market recently managed to close above the Breaker Block (BPR), which initially seemed like a bullish signal. But as it approached the overhead supply zone, it faced strong rejection and started to decline again. This shows that sellers are still active at higher levels.
Right now, the market is treating the BPR as an inversion level, meaning it’s testing it as potential support. This level is crucial for determining Bitcoin's next move.
🔍 So, what’s the best approach now?
Patience is key at this point. The ideal strategy is to wait and watch. Let the market clearly break either the upper supply zone (which would confirm bullish momentum) or the lower BPR zone (indicating a bearish trend). Only then can we expect a strong directional move.
Until one of these key levels is decisively broken, Bitcoin is likely to continue consolidating within this range — moving sideways without a clear trend.
🧠 DYOR — Do Your Own Research!
Always analyze before making any trading decisions.

bitcoin is going nutssBitcoin has been pumping in the past few days pretty massively. Why? There are 2 main reasons - the first reason is that Bitcoin has finished a major WXY corrective wave, and the second is that Bitcoin swept liquidity below a triangle (see my previous post for details). That was a very good opportunity to buy/long Bitcoin at that specific level I described in the previous analysis. But let's focus on the present and future!
We always want to find strong levels on the charts so we have a great entry point/take profit target. The next strong level is definitely the 0.618 FIB, which Bitcoin can hit in the very short term. Also, below the 0.618 FIB, we have a strong horizontal zone, which can also act as a strong resistance. Bitcoin should definitely go there and retest this zone.
We want to see how Bitcoin is going to react in the zone and FIB, but you can create a new limit order to short Bitcoin there so you don't miss anything. So currently I am temporarily bullish on Bitcoin, and in the next update I will make a big analysis on Bitcoin and a very likely scenario for the next months. What will the price of Bitcoin be in December? Please like/boost my idea right now.
Write a comment with your altcoin + hit the like button, and I will make an analysis for you in response. Trading is not hard if you have a good coach! This is not a trade setup, as there is no stop-loss or profit target. I share my trades privately. Thank you, and I wish you successful trades!
7 days ago
Note
Bitcoin hit my profit target of 0.618 FIB and continues to the upside. It looks like we are going to hit 109,000 USD in the short term, which is a very strong resistance! Middle of the previous big range, so prepare for a bounce here.
BITCOIN: As simple as that!Hello Traders,
First of all, a big thank you to all the members of our community for being part of this journey. With Bitcoin reaching a new all-time high, we are about to witness even more bullish momentum unfold. 🚀
A special shoutout to @TradingView for providing an incredible platform that empowers traders like us to showcase our technical skills, build our identity, and grow from nothing to something.
Now, let’s head to the update:
Since September 2023, BTC has performed exceptionally well. We witnessed a strong rally lasting until March 2024 (around 180 days), followed by a period of consolidation. BTC then made another leg up, hitting the historic $100K mark. After another consolidation phase, we are now seeing the start of a new bullish rally. 📈
Based on current analysis, this rally is expected to reach between $130K and $150K, with the target likely being achieved by early Q3.
So, sit tight, stay focused, and enjoy the ride! 🥂
Best regards,
Dexter
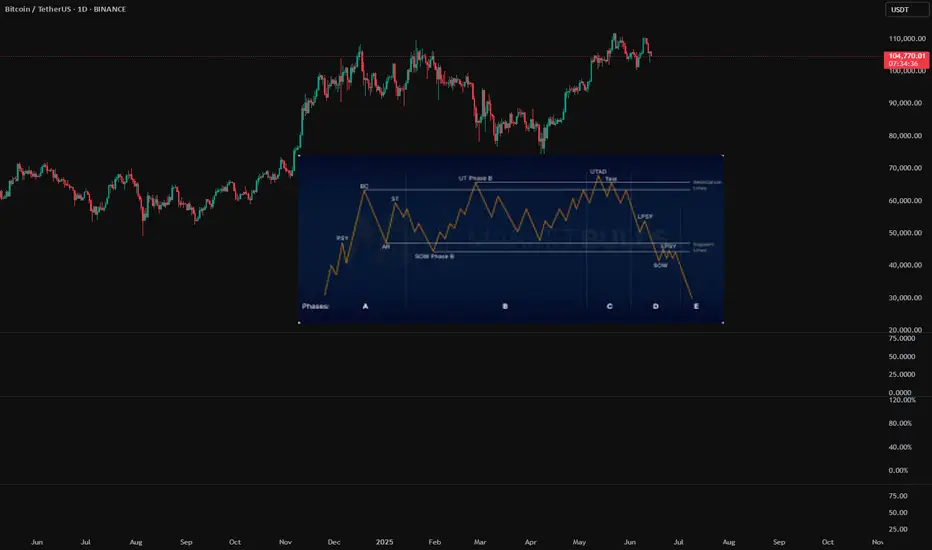
Is BTC in a Wycoff Distribution?BTC has failed to breakout from $110k and hold. I am starting to notice a possible Wycoff distribution pattern on bigger and smaller timeframes. I am a long term bull on BTC so don't meant to sound like a bear but it is starting to show signs of weakness. Anything can happen and the market is always right. Stay safe!
BULLISH!💰 #BTC successfully retested the broken weekly resistance with a positive outcome✅
a Morning Star bullish candlestick pattern is forming✨
BULLISH🚀
BTCUSDTHello Traders! 👋
What are your thoughts on BITCOIN?
Bitcoin entered a corrective phase after a liquidity hunt above the recent highs and is currently in a short-term pullback.
We expect this correction to extend toward the identified support levels, after which a new bullish wave may begin, potentially leading to fresh all-time highs.
The broader trend remains bullish, and the current correction could offer a buy-the-dip opportunity in line with the ongoing uptrend.
Don’t forget to like and share your thoughts in the comments! ❤️
Bitcoin Rally Overextended: Patience is Key for the Next Move💹 BTC/USDC – Bullish Outlook, heres my Trade Plan.
Bitcoin (BTC/USDC) is currently maintaining a strong bullish trajectory 🚀, showing impressive momentum after breaking through recent resistance levels 🔓.
However, price is now overextended from the last swing low, and I’m anticipating a pullback into value 🔄 — specifically targeting the 50%–61.8% Fibonacci retracement zone drawn from the latest swing low to swing high 📐. This zone often acts as a rebalancing point for institutional traders and provides confluence for smart entries 🎯.
I’ll be closely watching this retracement area for signs of support forming, and more importantly, a bullish break in market structure 🧠📊. Only after that confirmation, would I consider executing a long position — no structure break, no trade ✅.
This isn’t about predicting — it’s about reacting with discipline.

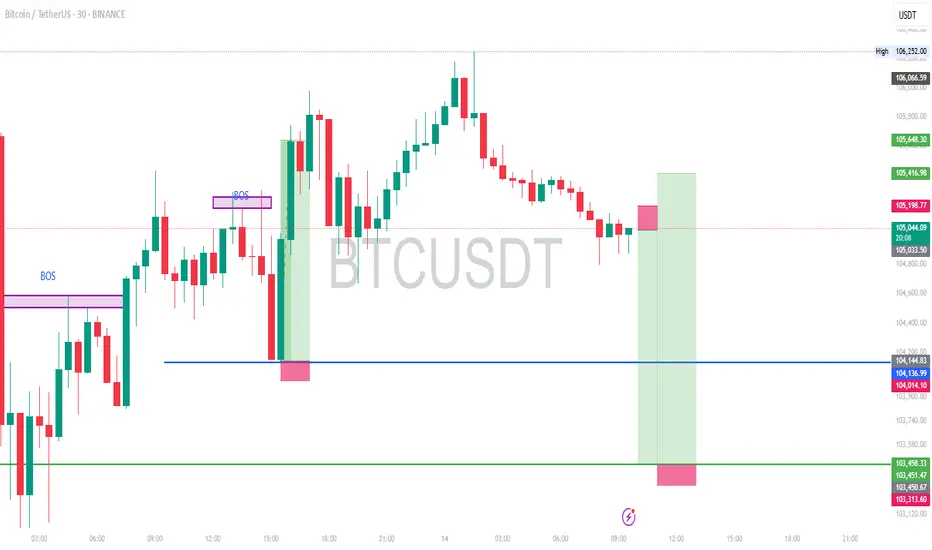
Tuesday Scalps! 🔥 These are the scalps I’ve got my eye on today. 🔥
Mostly looking at continuation longs — unless structure tells a different story.
💡 Key Plan:
For each long setup, I’ll wait for an internal market structure (MS) flip before pulling the trigger. No confirmation, no entry. Precision is the priority.
📅 Class Schedule:
Tuesday | After 6 PM

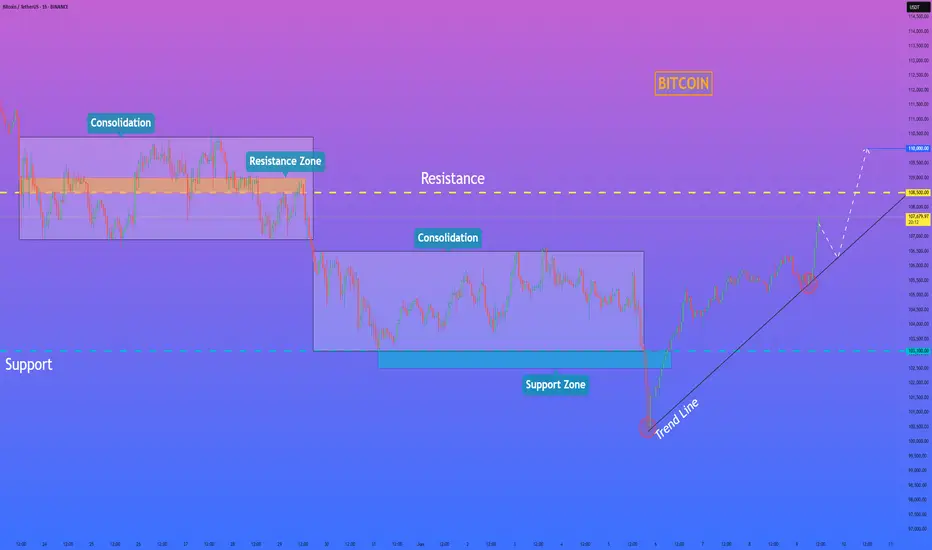
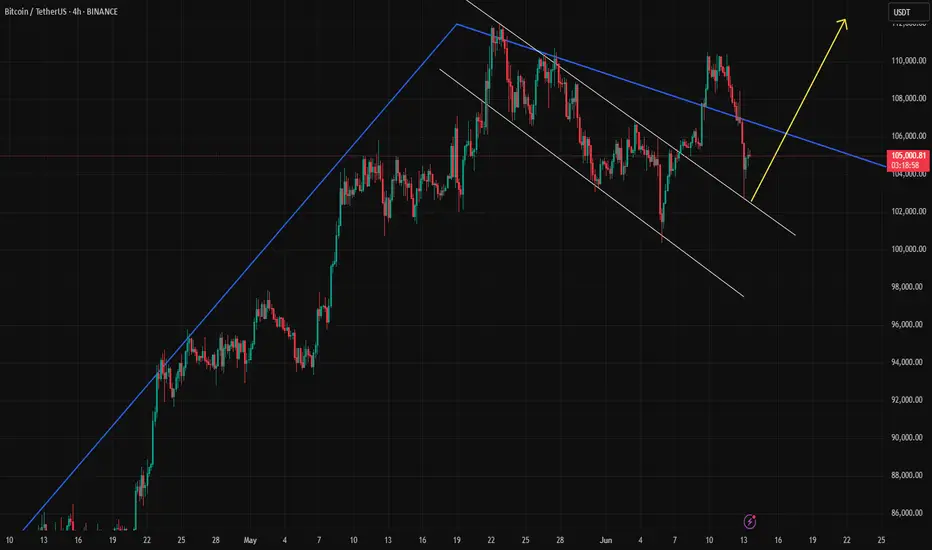
HelenP. I Bitcoin can break resistance level and continue growHi folks today I'm prepared for you Bitcoin analytics. After looking at this chart, we can see how the price traded inside a consolidation, where it reached a resistance level, which coincided with a resistance zone. Then it some time traded between the 108500 level and then dropped to the support level, thereby exiting from consolidation and breaking the 108500 level one more time. After this, BTC started to trade inside another consolidation, where it rebounded from the support level and rose to the top part of this range. Then it some time traded near this area and then dropped to the trend line, breaking the support level and exiting from the consolidation. But then BTC started to grow and rose to the 103100 level, broke it, and continued to grow. A not long time ago, it made a correction to the trend line and then bounced and continued to move up. So, I expect that BTCUSDDT will correct to the trend line and then rise to the resistance level and break it. Then, I thought that Bitcoin might continue to move up next; therefore, I set my goal at 110000 points. If you like my analytics you may support me with your like/comment ❤️