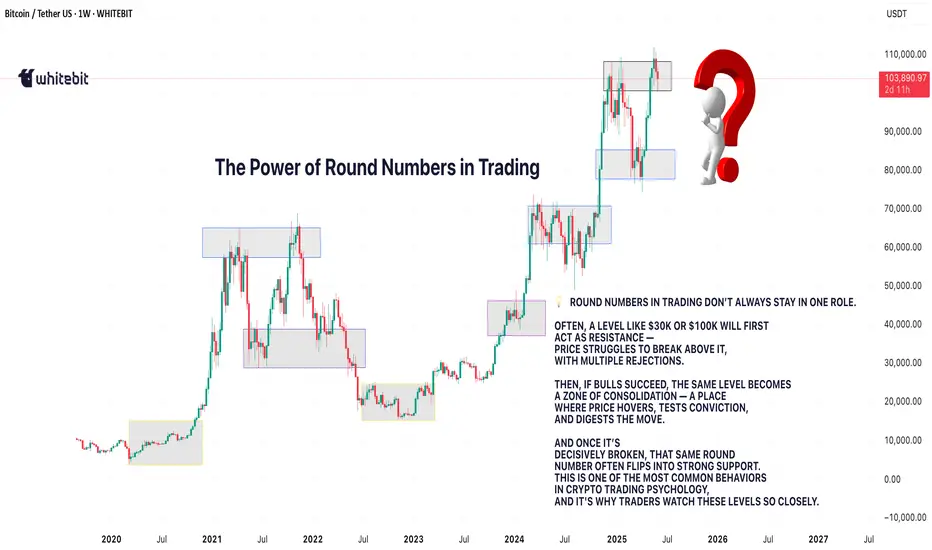
The Power of Round Numbers in TradingHello, traders! 👀 Do you know why $10K matters more than $10,137.42? You’ve probably noticed it — even if you’re not watching the chart all day. Whenever Bitcoin approaches $10,000, $20,000, or $100,000, something shifts. Volatility spikes. X (formerly known as Twitter) goes wild. And traders tighten their stops.
That’s not a coincidence. It’s the psychology of crypto trading, and few things trigger it more than round numbers in trading.
🎯 Why Round Numbers Act Like Magnets
In both traditional and crypto markets, clean figures like $1.00, $100, $10K, $100K aren’t just visual milestones. They’re emotional ones too. And that’s where crypto market psychology kicks in. Why? People, especially traders, think in psychological numbers.
Retail traders place limit orders near neat levels like $25,000 or $30,000 (not $24,837.65). Institutions often set stop-losses or triggers around these zones. Media headlines focus on thresholds: “BTC Hits $100K” hits harder than “BTC breaks $99,800.” These collective habits cluster orders and attention around these levels, making them support/resistance zones through pure crowd behavior. That’s crypto psychology at work.
🧠 Support, Resistance, and Psychological Warfare
Let’s say BTC approaches $30,000 from below. Here’s what the crypto psychology chart tends to show: retail optimism takes off: “If we break 30K, next stop is 100K BTC!”
Smart money takes profit: Short sellers loooove round numbers. Choppy price action: Emotional trading dominates near psychological zones. This makes psychological numbers in trading incredibly sticky. They become decision-making triggers.
A move above a considerable number might create FOMO.
A rejection just below it might trigger panic selling or trap breakouts.
That’s why psychological numbers in day trading (and longer-term moves) aren’t just fluff; they’re real and show up repeatedly.
🔁 Real Examples of Round Number Power in Crypto
$10,000: Held BTC back in 2017 and 2019 — until it didn't. Once broken, it opened the floodgates.
$20,000: A brutal resistance for years — finally broken in 2020. The price exploded afterward.
$30,000: Became major support during the 2021 bull run. Once it collapsed, BTC slid toward $15K.
$100,000: The ultimate mental level. Traders still ask: “When will Bitcoin hit 100K?” or even “Did Bitcoin hit 100K yet?” The answer? Yes! But every move toward it creates a wave of interest, and sometimes fear. Some already speculate: “Will Bitcoin crash at 110K?”
It’s clear: round levels shape crypto trading psychology, and BTC 100K is more than a price — it’s a narrative. That’s the essence of what psychological numbers are in trading — they’re not technical but emotional.
💬 Final Thought: What’s Your 100K?
For some, 100K BTC is a moonshot. For others, it’s a trap waiting to happen. So the next time Bitcoin approaches a clean round number, ask yourself: Is this price important or just a number that feels important? Let us know how psychological numbers in trading shape your strategies 👇
BTCUSDT.P trade ideas
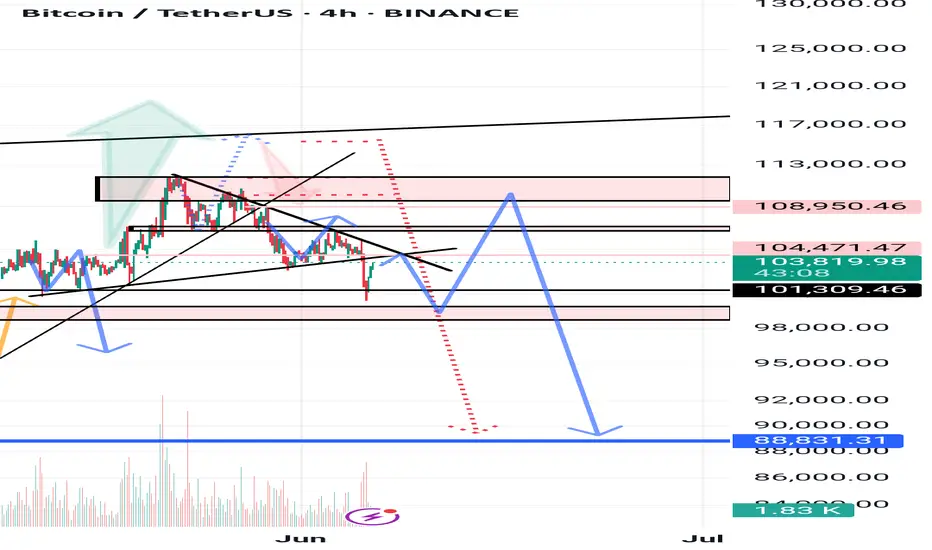
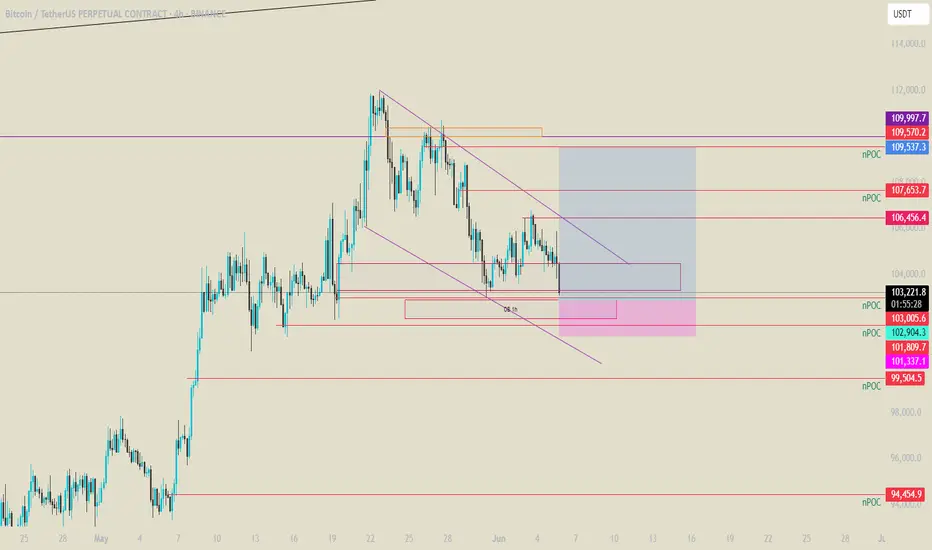
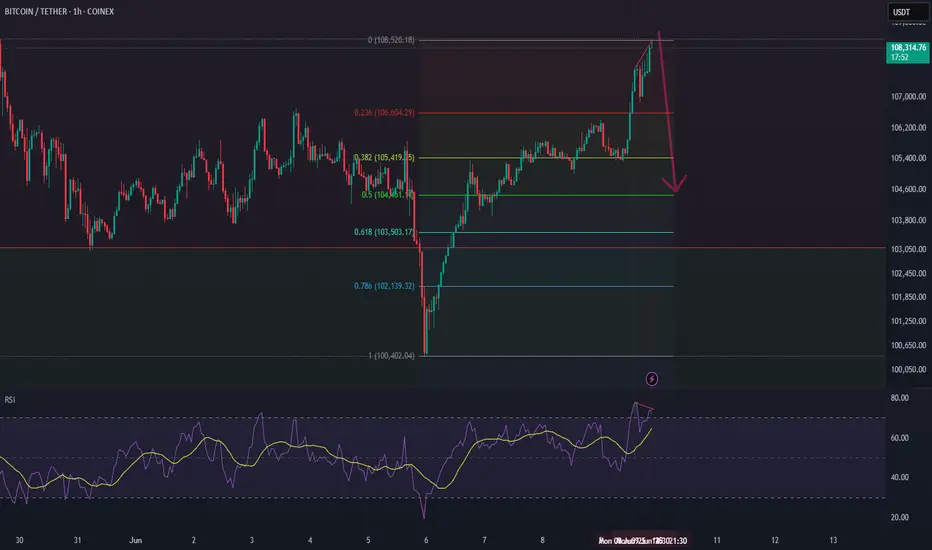
Analysis No. 71 btc 4hWelcome to KING BTC 3. In the previous long-term analysis, we expected to see 88,000, which is still not unreasonable. However, in the previous one-hour analysis, we expected a rise to 106,800-109,000, which was the first target. However, in this analysis, we expect a price decrease from 104,400-105,800 to 98,000-99,000, then a price increase to the peak in the numbers 109,500-111,800, and from there, embrace the number 88,000. This is just a possibility.
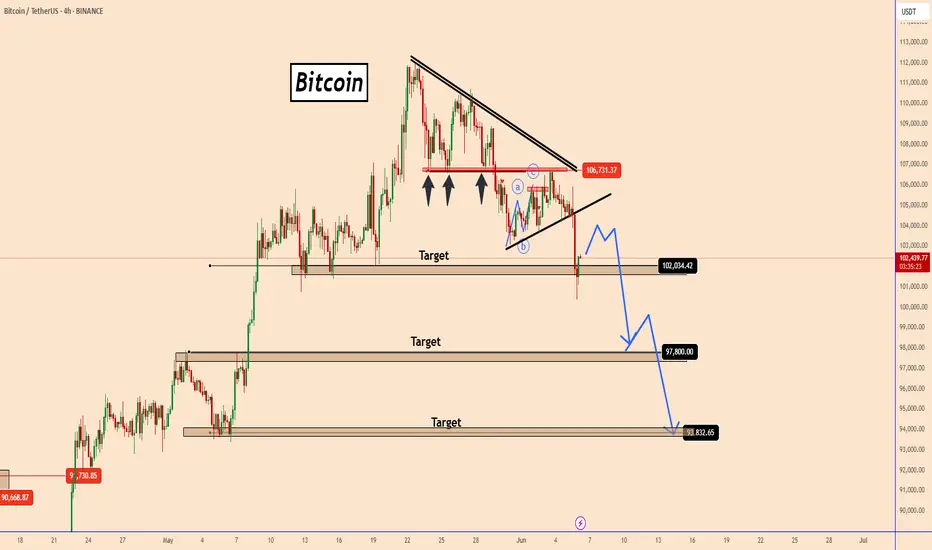
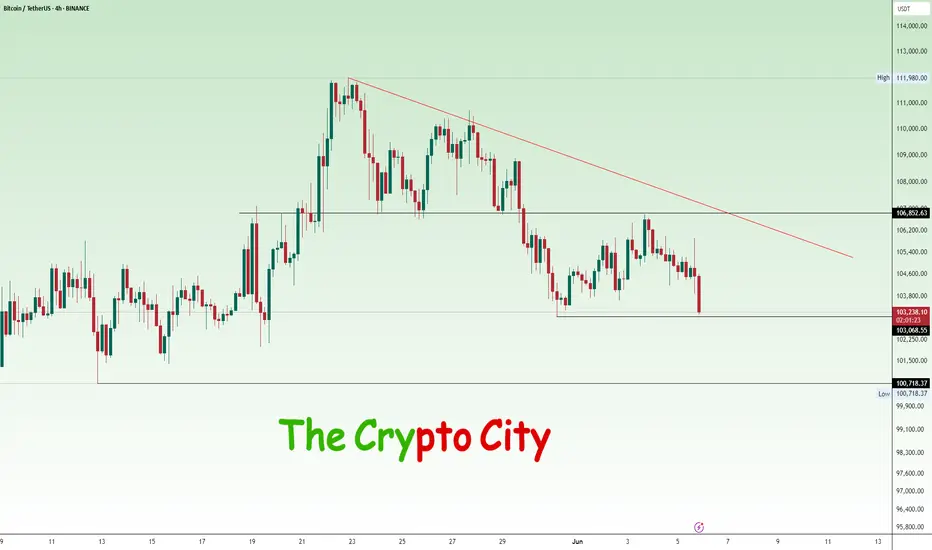
Bitcoin in a clear bearish movementBitcoin in a clear bearish movement
BTC created a clear bearish movement yesterday following our previous swing trade setup.
The price spend some time below the red zone near 106700 and yesterday suddenly the bearish wave started and already reached the first target.
The price could take a pause today near to 103500 - 104000 but it should continue to drop further as shown in the chart with targets 97800 and 94000
You may find more details in the chart!
Thank you and Good Luck!
❤️PS: Please support with a like or comment if you find this analysis useful for your trading day❤️
Previous analysis:
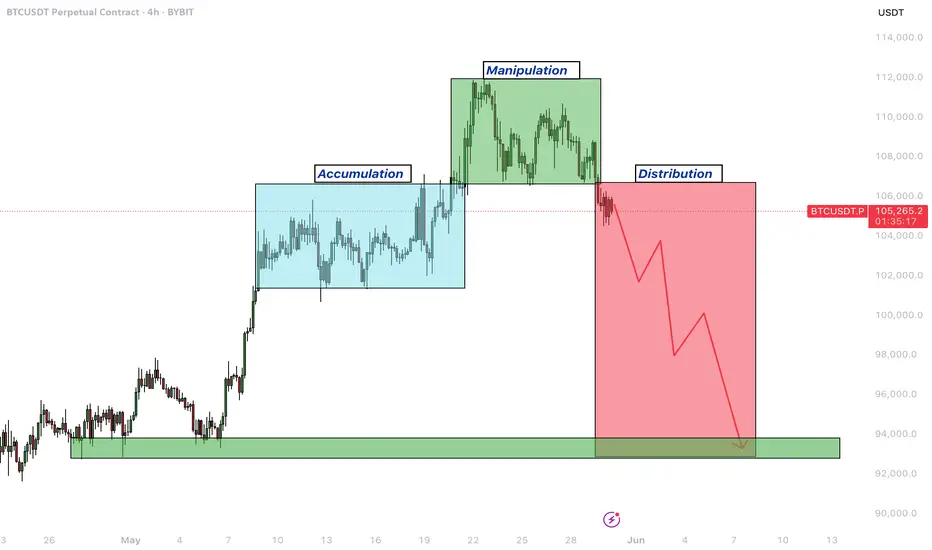
Bitcoin – Entering a distribution phase after a bull trap?Since the second week of May, Bitcoin (BTC) has exhibited a textbook accumulation phase, with a well-defined trading range forming just below the previous all-time high. Beginning around May 12, price action became increasingly compressed, marked by a series of higher lows and relatively flat resistance, indicating growing demand and waning selling pressure. This consolidation structure persisted for more than a week, suggesting that larger players were accumulating positions in anticipation of a breakout. Now it could be making the Power of 3. Accumulation, manipulation and distribution.
Accumulation, manipulation and distribution
Eventually, this coiled energy resolved to the upside. BTC broke through the upper boundary of the accumulation zone with increasing volume and momentum, triggering a sharp rally and leading to the formation of a new all-time high. At that point, market sentiment turned decidedly bullish, with breakout traders entering the market, expecting continuation. However, the price failed to sustain above the previous ATH for long. Despite the breakout’s initial strength, Bitcoin was unable to establish a solid foothold above the critical psychological and technical level, which has now proven to be a key inflection point.
Soon after setting a new high, BTC began to reverse, shedding gains and retracing back below the former resistance level, which had temporarily acted as support. The breakdown below the $106,000 mark, previously the ceiling of the accumulation range, signaled a notable shift in market structure. What was initially viewed as a healthy continuation pattern evolved into what now appears to be a classic bull trap. This type of failed breakout often leaves market participants vulnerable, as late buyers are caught in drawdowns and early longs may be incentivized to exit positions.
Given this context, the recent price action carries the hallmarks of a Power of 3, where market makers and institutions may be offloading positions to less informed participants. This phase is often mistaken for continued accumulation by retail traders due to its structural similarity; however, the key difference lies in the failure to maintain new highs and the emergence of lower highs on any attempted bounce. The rejection above the ATH and the subsequent breakdown below $106K has introduced significant overhead supply, which may act as resistance in the near term.
Target levels
As BTC continues to trade below this critical level, the likelihood of a further retracement grows. The market appears to be transitioning into a phase of redistribution or distribution proper, where price is likely to be capped on rallies and pressured lower over time. It is reasonable to expect that Bitcoin could revisit $100.000 to mid-$90,000s, an area that may serve as a magnet for liquidity and a potential staging ground for the next major move. This region could represent a "Last Point of Supply" (LPSY) within the Wyckoff framework, typically the final area where smart money distributes before initiating a more decisive markdown phase.
Nevertheless, this potential pullback should not be viewed solely as a sign of weakness. In many bull cycles, such corrections and shakeouts serve to flush out over-leveraged positions and reset sentiment, ultimately laying the groundwork for renewed upward momentum. Should BTC find stability and demand re-emerge in the $95K–$100K range, it could mark the beginning of a new re-accumulation phase, leading to a healthier and more sustainable advance.
Conclusion
In summary, the recent breakout above ATH followed by a sharp reversal and loss of key support paints a cautionary picture in the short term. Bitcoin may currently be navigating a distribution zone, with downside pressure likely to persist as the market digests recent gains. However, such corrections are typical in broader uptrends and often present opportunities for strategic entries once the next accumulation structure becomes clear. Patience and disciplined observation will be essential as the market defines its next directional bias.
Thanks for your support.
- Make sure to follow me so you don't miss out on the next analysis!
- Drop a like and leave a comment!
BTC USDTBitcoin is testing key support around $103K. A breakdown below this zone could open the door to sub-$100K levels. Watch closely!
Bitcoin Long Setup – Chart Analysis (June 5, 2025)We are the SeoVereign Trading Team.
With sharp insight and precise analysis, we regularly share trading ideas on Bitcoin and other major assets—always guided by structure, sentiment, and momentum.
🔔 Follow us to never miss a market update.
--------------------------------------------------------------------------------------------------------
Bitcoin technical analysis is presented as follows.
The current wave structure, based on Elliott Wave Theory, appears to be in the final stage of the corrective pattern, specifically in WAVE Y. Notably, WAVE Y has extended to 1.618 times the length of WAVE W, which suggests a potential completion of a typical WXY corrective pattern. This can be interpreted as a strong reversal signal.
In addition, the 1.414 Butterfly pattern, one of the harmonic patterns I have been monitoring, has also completed in the same zone. As Butterfly patterns often indicate high reversal probability between the 1.272 and 1.618 levels, the precise formation at the 1.414 ratio adds further technical confirmation and reliability to this signal.
In summary, the convergence of these two technical factors strongly supports a bullish bias at the current level and increases confidence in a potential short-term price rise for Bitcoin. Therefore, this zone is considered a strategic point for entering a long position.

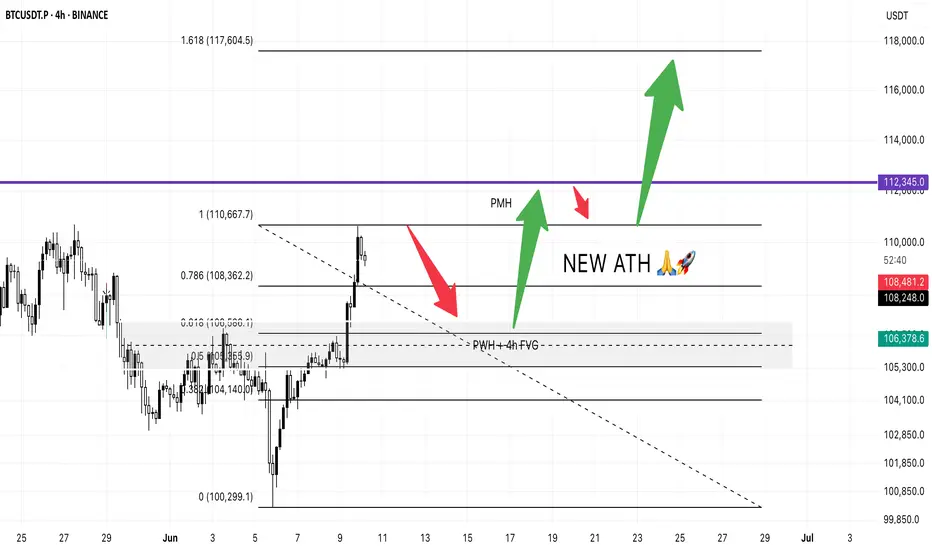
Bitcoin Pre-CPI PlanJust like in trading it’s all about structure, levels and reaction.
We’ve seen BTC bounce cleanly from the psychological level of $100,299 and rally all the way to $110,667.
Based on that impulse move, I’m watching the 0.618 Fibonacci retracement at $106,586 as a potential dip-buy zone. That level aligns perfectly with:
✅ 4H Fair Value Gap
✅ Previous Week High
If we get a healthy CPI print today, I expect BTC to continue the bullish move and go for a new ATH.
🎯 First target: $112,345 (slightly above Previous Month High)
📉 Then, a potential pullback to $110,667 (support retest)
🚀 Followed by a breakout move to $117,604 the 1.618 Fib extension
All eyes on today’s CPI. If the data is good, the sky’s the limit.
Let’s see if bulls have the strength to push it all the way. 💪📈
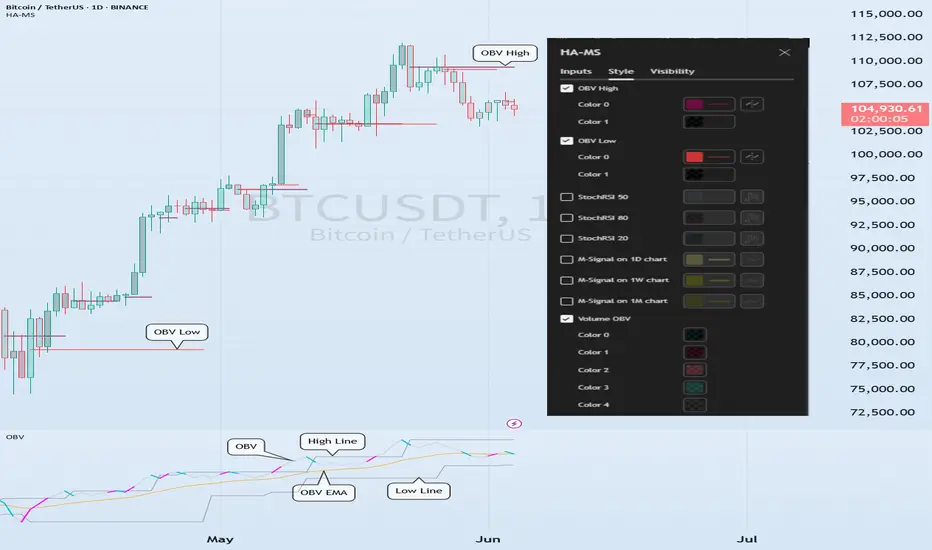
An example of a new way to interpret the OBV indicator
Hello, traders.
If you "follow", you can always get new information quickly.
Have a nice day today.
-------------------------------------
I think the reason why there are difficulties in using auxiliary indicators and why they say not to use indicators is because they do not properly reflect the price flow.
Therefore, I think many people use indicators added to the price part because they reflect the price flow.
However, I think auxiliary indicators are not used that much.
Among them, indicators related to trading volume are ambiguous to use and interpret.
To compensate for this, the OBV indicator has been modified and added.
-
The ambiguous part in interpreting the OBV indicator is that the price flow is not reflected.
Therefore, even if it performs its role well as an auxiliary indicator, it can be difficult to interpret.
To compensate for this, the High Line and Low Line of the OBV auxiliary indicator have been made to be displayed in the price section.
That is, High Line = OBV High, Low Line = OBV Low
-
Then, let's interpret the OBV at the current price position.
The OBV of the auxiliary indicator is currently located near the OBV EMA.
That is, the current OBV is located within the Low Line ~ High Line section.
However, if you look at the OBV High and OBV Low indicators displayed in the price section, you can see that it has fallen below the OBV Low indicator.
In other words, you can see that the price has fallen below the Low Line of the OBV indicator.
You can see that the OBV position of the auxiliary indicator and the OBV position displayed in the price section are different.
Therefore, in order to normally interpret the OBV of the auxiliary indicator, the price must have risen above the OBV Low indicator in the price section.
If not, you should consider that the interpretation of the OBV of the auxiliary indicator may be incorrect information.
In other words, if it fails to rise above the OBV Low indicator, you should interpret it as a high possibility of eventually falling and think about a countermeasure for that.
Since time frame charts below the 1D chart show too fast volatility, it is recommended to use it on a 1D chart or larger if possible.
-
It is not good to analyze a chart with just one indicator.
Therefore, you should comprehensively evaluate by adding different indicators or indicators that you understand.
The indicators that I use are mainly StochRSI indicator, OBV indicator, and MACD indicator.
I use these indicators to create and use M-Signal indicator, StochRSI(20, 50, 80) indicator, and OBV(High, Low) indicator.
DOM(60, -60) indicator is an indicator that comprehensively evaluates DMI, OBV, and Momentum indicators to display high and low points.
And, there are HA-Low, HA-High indicators, which are my basic trading strategy indicators that I created for trading on Heikin-Ashi charts.
Among these indicators, the most important indicators are HA-Low, HA-High indicators.
The remaining indicators are auxiliary indicators that are necessary when creating trading strategies or detailed response strategies from HA-Low, HA-High indicators.
-
Thank you for reading to the end.
I hope you have a successful trade.
--------------------------------------------------
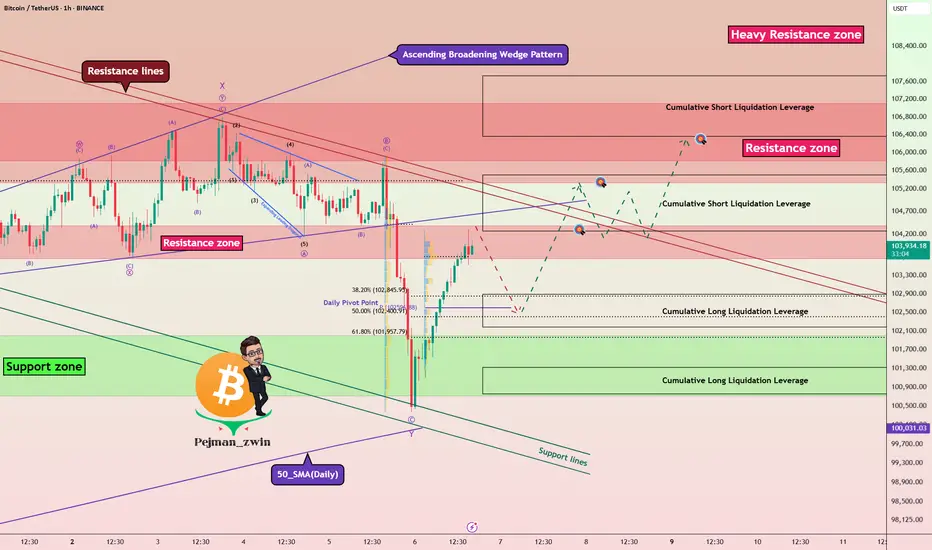
Bitcoin’s Reversal from Supports — Is the Correction Over? Bitcoin ( BINANCE:BTCUSDT ) moved as I expected in the previous idea , and it also reversed the decline I intended and started to rise from the Support zone($102,000-$107,120) , Support lines , and 50_SMA(Daily) .
Bitcoin is trading near the Resistance zone($104,380-$103,670) , Cumulative Short Liquidation Leverage($105,500-$105,265) , and Resistance lines .
In terms of Elliott Wave theory , it seems that Bitcoin has managed to complete the main wave Y . The main corrective structure was the Double Three Correction(WXY) . If the Resistance lines are broken , we can confirm the end of the main wave Y .
I expect Bitcoin to start rising after a re-correction from Cumulative Long Liquidations Leverage and reach the targets I have specified on the chart.
Cumulative Long Liquidation Leverage: $102,883-$102,181
Cumulative Long Liquidation Leverage: $101,318-$100,748
Note: If Bitcoin falls below $100,200(Worst Stop Loss(SL)), we should expect further declines.
Note: $105,500 is an important price for Bitcoin, and if Bitcoin can close the 4-hour candle above it, we can expect a break of the Heavy Resistance zone($104,380-$103,670)
Please respect each other's ideas and express them politely if you agree or disagree.
Bitcoin Analyze (BTCUSDT), 1-hour time frame.
Be sure to follow the updated ideas.
Do not forget to put a Stop loss for your positions (For every position you want to open).
Please follow your strategy and updates; this is just my Idea, and I will gladly see your ideas in this post.
Please do not forget the ✅' like '✅ button 🙏😊 & Share it with your friends; thanks, and Trade safe.
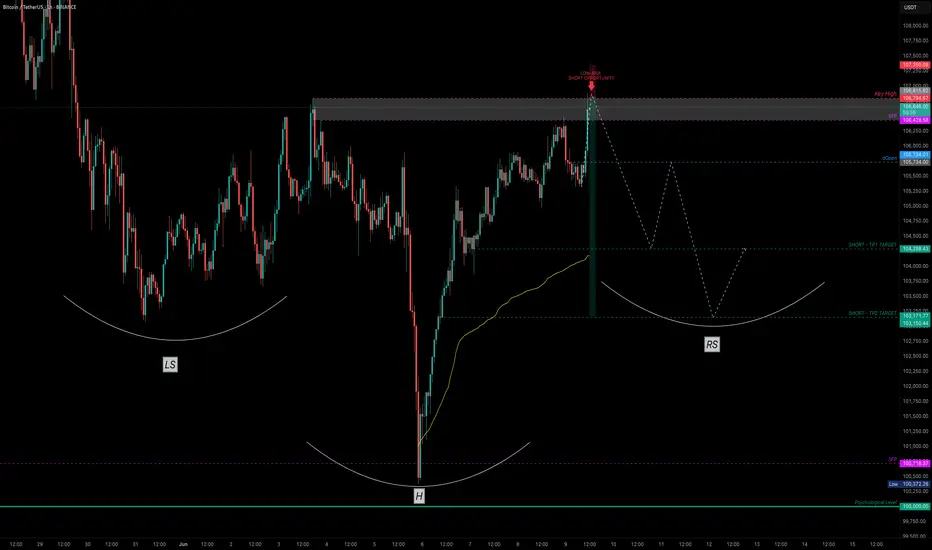
Bitcoin — Breakout or Bull Trap? SFP Setup ExplainedAfter a clean drop that nearly tagged the psychological $100K level, Bitcoin printed a Swing Failure Pattern (SFP) — sweeping the lows and snapping back with strength. That bounce wasn’t just a reaction — it was a liquidity reclaim.
Now, price structure is shaping into a potential Inverted Head & Shoulders — a classic reversal pattern often forming before a bullish continuation.
🔍 Key Level to Watch:
$106,694.63 — This recent key high was just taken out. If we see rejection here (SFP), it could set up a high-probability low-risk short opportunity.
🎯 Short Trade Idea (Only on SFP confirmation):
Entry: After price sweeps $106,694.63 and shows rejection
Stop-Loss: Above wick high (e.g., ~$107.4K)
TP Zones: $103.5K and $101.7K
R:R: ~1:7
✅ Cleaner setup with confluence from structure and liquidity — high probability if confirmed.
📚 Educational Insight: Why SFPs Work So Well
SFPs (Swing Failure Patterns) are some of the most powerful setups in trading because they:
Trap breakout traders
Sweep liquidity and reverse quickly
Offer clear invalidation (wick high/low)
Allow for tight stop-loss and high R:R setups
Using SFPs in conjunction with key highs/lows, volume, and structure dramatically increases your edge.
📈 Why Order Flow Is Crucial for SFPs
1. See the Trap Form in Real Time
SFPs are essentially traps — price sweeps a key level, sucks in breakout traders, and then reverses. Order flow tools let you see this happen:
A spike in market buys above resistance
Followed by a lack of follow-through (no new buyers)
And then an aggressive absorption or reversal (selling pressure hits)
Without order flow, this is all hidden in the candles.
2. Confirm Liquidity Sweeps with Delta & CVD
Watch for a delta spike or Cumulative Volume Delta (CVD) divergence — a clear sign that aggressive buyers are getting absorbed.
This gives you confirmation that the sweep failed, not just a random wick.
3. Tight Entries with Confidence
When you see actual trapped volume or liquidation clusters at the SFP level, you can enter tighter with conviction — because you're not guessing, you’re reacting to actual intent and failure in the market.
4. Early Warning System for Reversal or Continuation
If the SFP fails to trigger a reversal (e.g. buyers step back in with strength), you’ll see it early in the flow — and can quickly reassess.
🧠 Bottom Line:
Order flow lets you stop guessing and start seeing the actual fight between buyers and sellers. Combine it with SFPs, and you're not just trading price — you're trading intent. That edge is huge.
_________________________________
💬 If you found this helpful, drop a like and comment!
Want breakdowns of other charts? Leave your requests below.
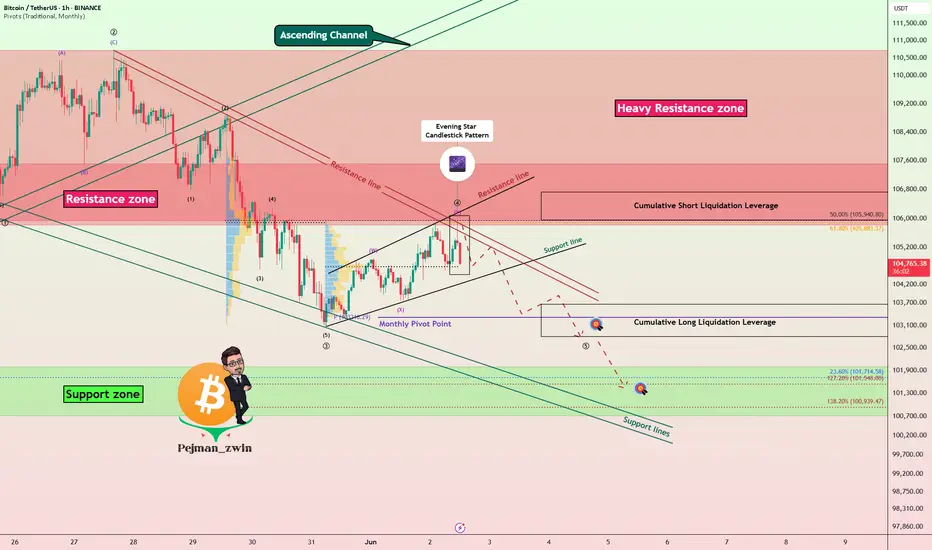
Bitcoin’s Rally Fades Below Resistances — Bearish Wave Setup!Bitcoin ( BINANCE:BTCUSDT ) started to fall as I expected in the previous idea , but failed to break the Heavy Resistance zone($110,000-$105,820) .
Bitcoin is trading near the Resistance zone($107,520-$105,940) , Cumulative Short Liquidation Leverage($106,720-$105,948) , and the Resistance lines .
From the perspective of Elliott Wave theory , Bitcoin appears to have completed a main wave 4 near the Resistance lines. The structure of the main wave 4 was a Double Three Correction(WXY) . One of the signs of the completion of the main wave 4 could be the Evening Star Candlestick Pattern .
I expect Bitcoin to decline to at least Cumulative Long Liquidation Leverage($103,666-$102,800) AFTER breaking the Support line , and the next target is the Support zone($102,000-$107,120) .
Note: Rising tensions between Russia and Ukraine could help drive down Bitcoin.
Note: If Bitcoin touches $107,600, we can expect more pumps.
Please respect each other's ideas and express them politely if you agree or disagree.
Bitcoin Analyze (BTCUSDT), 1-hour time frame.
Be sure to follow the updated ideas.
Do not forget to put a Stop loss for your positions (For every position you want to open).
Please follow your strategy and updates; this is just my Idea, and I will gladly see your ideas in this post.
Please do not forget the ✅' like '✅ button 🙏😊 & Share it with your friends; thanks, and Trade safe.
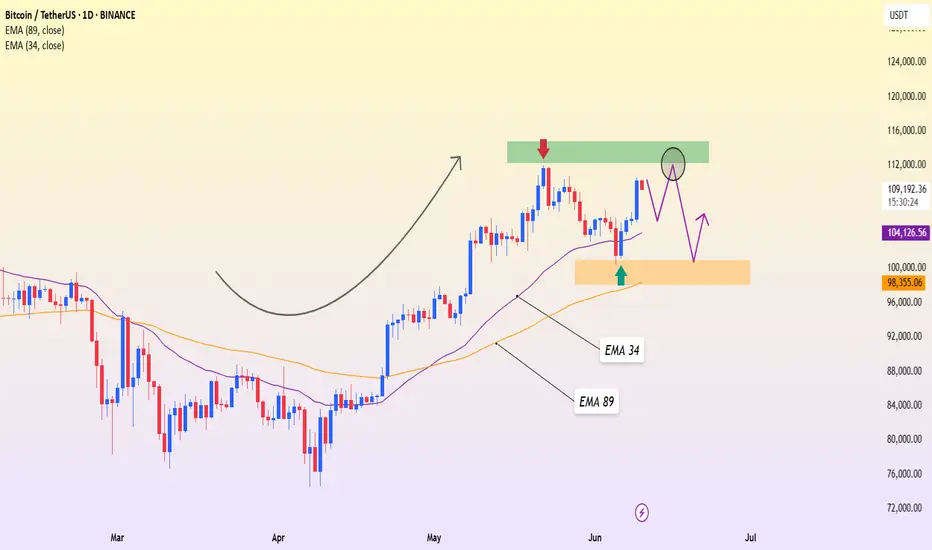
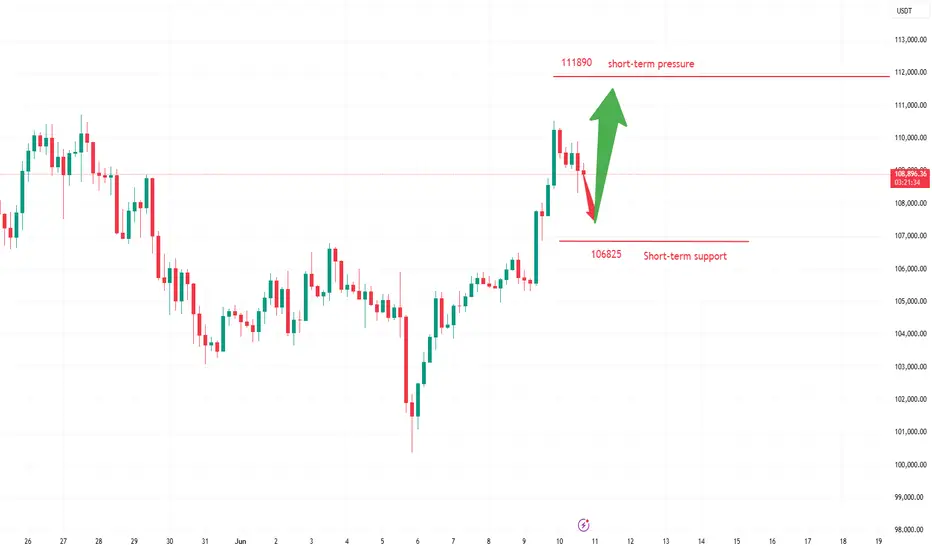
BTCUSDT – Uptrend Intact, Resistance Still in PlayBitcoin is currently moving within a healthy uptrend, showing a strong rebound from the 101,332 USDT support zone—aligned with the EMA 89 on the daily chart. Following an impressive recovery, the price is now approaching the 111,892 resistance area, which previously halted the bullish momentum and triggered a deep correction.
However, recent price action shows signs of stalling, suggesting a possible consolidation phase. If BTC fails to break above 111,892, a mild pullback toward the 104,000–101,000 zone may occur to build fresh momentum for the next bullish leg.
From a news perspective, the crypto market is buoyed by improving sentiment after weak U.S. job data, increasing the odds of an earlier-than-expected Fed rate cut. Additionally, continued capital inflows into Bitcoin ETFs are supporting medium-term upside potential for BTC.
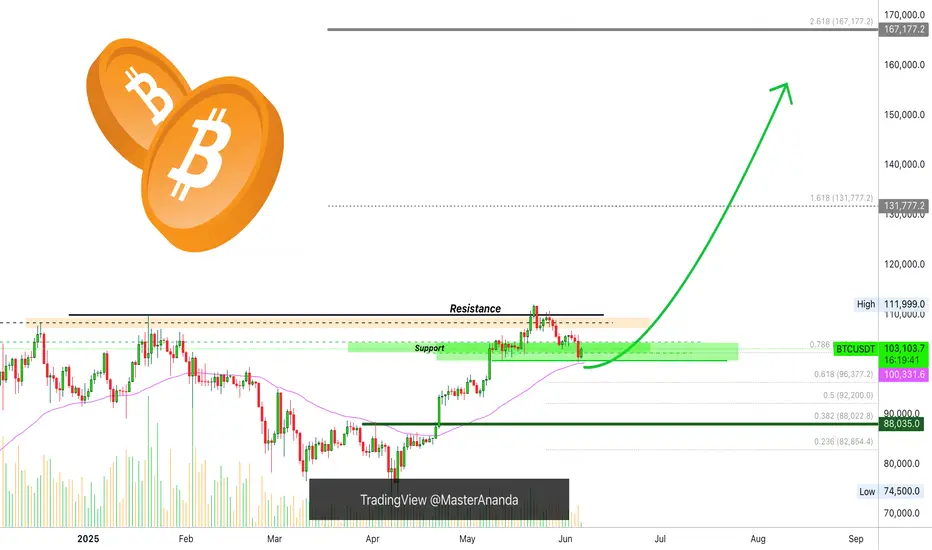
BTCUSD Long-Term Buy Recommendation📌 BTCUSD Long-Term Buy Recommendation
🚨 BTCUSD Buy Recommendation – Magnet Area Identified
Here is the Magnet Area for a potential buy zone on BTCUSD, marked clearly with the green line on the chart.
This area has been technically identified as a strategic accumulation zone for long-term investment.
It is crucial to consider partial buying in this zone using a portion of your capital allocated for long-term crypto exposure.
🟩 Green Line = Suggested Buy Area
💰 Strategy: Gradual accumulation, not all-in
⏳ Timeframe: Long-term holding (2–5 years)
🎯 Objective: Build position during discounted price range
Patience and risk management are key. Long-term opportunities often begin where fear dominates.
⚠️ Disclaimer:
This content is for educational purposes only and does not constitute financial advice. Always do your own research and consider your risk tolerance before making any investment decisions. You are solely responsible for any trading or investment actions taken based on this information.
Bitcoin done and next target - $96,000⚡️ Hello everyone! Bitcoin reached $110,000 and everyone started celebrating. The market also rebounded slightly. But is everything really that great, and what's next for BTC?
Let's take a look:
Bitcoin is now undergoing a correction after reaching the $110,000 level. The rest of the market looks more buoyant than the first cryptocurrency. ETH is already trading at $2,700, pulling many altcoins with it. Apparently, position fixing in Bitcoin and liquidity spillover into altcoins have begun.
➡️ There is practically no liquidity left at the top. At the $110,000 level, only 100 million shorts were liquidated. According to the liquidation map, if the price drops to $100,000 right now, more than $10 billion in longs will be liquidated!
➡️ Two gaps have also formed below us: 102,800 - 96,990 and 93,310 - 88,470. And as we know, in 99% of cases, gaps close sooner or later.
⚙️ Metrics and indicators:
Money Flow - liquidity inflow is still positive overall. However, since May 22, profit-taking has continued and liquidity has been decreasing.
Volume - divergence in volumes. Purchasing power is weakening as prices rise, which means that there is little chance of moving much higher from these levels. There is still a lack of liquidity in the market.
Liquidation Levels - there are two more obvious short stop zones above. But globally, there is now much more liquidity below than above. So if we fail to consolidate above the $108,600 level, the market is likely to go lower.
DSRZ - the nearest strong support level is at 99,800 - 99,900. This is the first zone of potential price reversal back to growth in the event of a correction.
📌 Conclusion:
I continue to say that it is summer now and liquidity in the markets will be decreasing. No matter how good things look now. At the first signs of weakness, positions will be closed instantly. No one wants to spend their vacation days watching the market.
Especially in a market where any news from Trump can cause prices to drop by several percent in the blink of an eye.
⚠️ I see two options:
It will be an exceptional summer. Bitcoin will spend it in the range of 108,000 - 88,000. And in the fall, when everyone expects growth, it will begin to decline. This cycle is already different from others, so I wouldn't be surprised by that.
It will be a standard summer, and by July we will begin a slow and dull correction. To return to growth in the fall.
Write your opinion and have a good week, everyone!

BTC/USDT Long PositionAfter a strong bullish impulse, price pulled back and formed a clear demand zone (OB) near the origin of the move.
The market is now retesting this zone after breaking short-term structure to the upside.
Entry:
Long from demand zone (OB) at the base of the bullish impulse.
Confluences:
✔️ Clean bullish BOS (Break of Structure)
✔️ Strong rejection wick from demand
✔️ Lower time frame liquidity grab
✔️ Favorable R:R setup
SL: Below the OB
TP: Targeting previous supply zone above
Bias: Bullish until structure shifts again
FOLLOW ME FOR MORE SIGNAL
btcusdt 4h
Bitcoin is also expected to test the previous bottom price of 100,500-101,000. It may even reach the 98,000-97,000 range with the needle share. Be careful if you have positions in altcoins. Daily closings above 106,500 are required for this scenario to be canceled. We are moving towards the days when price volatility will increase, do not forget to take profit from your positions.

$btc/usdt short swing sh set upth:
sh htf liq + htf sh fib (1.136/1.272) + anti cypher harmonic pattern

Bitcoin, Fast & Easy. $100,000 Support Holds +AltcoinsThe main support is not $100,000 but $102,000, so we make this a range. Yesterday, for the first time this range was tested and it holds easily... We are strongly bullish above $102,000 and Bitcoin is already trading above 103K.
This is really good news but we are not fully in the green yet. Bitcoin can continue sideways, consolidation, and only after closing above $106,000 we are looking for higher prices. Once $110,000 gets conquered, we can start talking about new all-time highs and sustained bullish growth. Meanwhile, the altcoins grow.
So we are not there yet but this is the best ever. For Cryptocurrency to thrive we need a strong Bitcoin and Bitcoin right now is very strong. Are you trading any altcoin? If you are, feel free to accumulate, load-up, buy and hold.
As for Bitcoin, here is a very easy trading approach:
While above $100,000, ALL-IN bullish confirmed.
If it goes below $100,000, stay out and wait to see what the market does. As soon as there is a support level created, we go LONG. If it goes below $100,000 just to recover the next day, we are again ALL-IN as soon as Bitcoin starts trading above 100K.
This process can be repeated many times but once Bitcoin takes off, buying below $110,000 is a major win because soon Bitcoin will be trading above $150,000. We have targets around $180,000 and even beyond $200,000 is possible this same year. Never forget the bigger picture.
The bigger picture is bullish for Bitcoin and the altcoins, the short-term can create confusion because the chart, market conditions, can change within hours.
But there can be a drop, a retrace or a market flush, but knowing that Bitcoin will be trading above $150,000 soon turns such an event into a non-event, it makes it into a simple hold.
The action on the side of the altcoins confirms that Bitcoin will continue to grow. Short, mid and long-term.
There is no retrace, there is no correction, only a small consolidation phase in anticipation of the next bullish wave. You already know this. If you didn't, now you know.
In 2025, Bitcoin will continue to grow. Just as it grew in 2023 and 2024.
We are entering bull market season. Bullish momentum will only start to gain force.
Namaste.
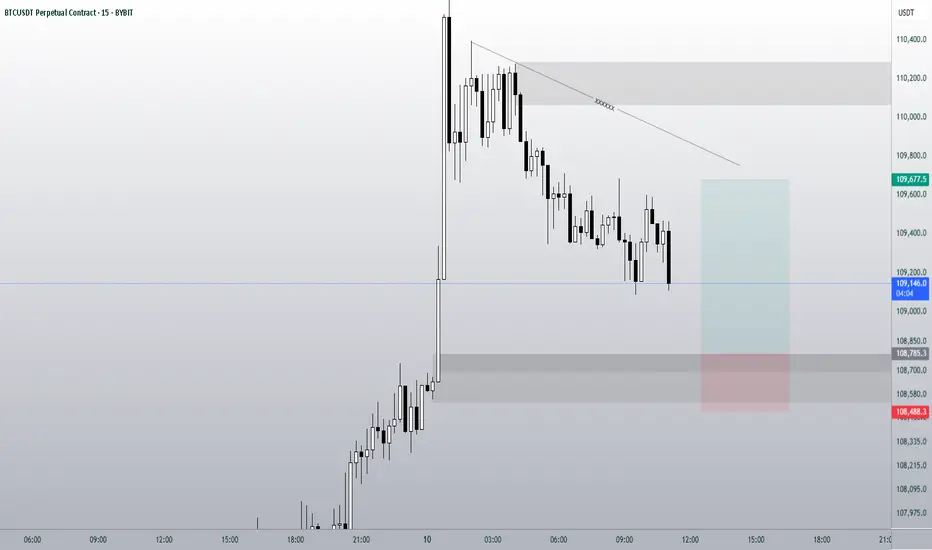
Bitcoin Short-Term Setup: Divergence and Correction SignalsBitcoin Analysis | 1-Hour Timeframe
Currently, Bitcoin is positioned at a key support level around $108,380, which can act as an important support zone.
Due to the presence of divergence and overbought conditions on the 1-hour and 15-minute timeframes near $108,000, a price correction down to $104,400 (which coincides with the 50% Fibonacci retracement of the recent move) is expected.
If the price manages to break above the resistance at $108,380, we anticipate a bullish move towards the $109,500 level.
Conversely, a breakdown below the $108,380 support could lead to a deeper correction, potentially down to $105,000.
Good luck.
Risk management and sticking to your strategy are key to success in this volatile market.
The bulls' strong momentum drives a new all-time high.hour gain stands at 4%, and the weekly increase expands to 6.7%. The total market capitalization has rebounded above $2.5 trillion. Three major positive factors have resonated: the expectation of (eased) Sino-US trade tensions, the SEC's policy shift to support on-chain innovation, and the continuous inflow of institutional capital (notably, Ethereum ETFs have seen 15 consecutive days of net inflows).
For the next 24 hours, the focus will be on the breakthrough of the all-time high at $111,980. The first resistance level is $112,500 (a dense short liquidation zone).
Humans need to breathe, and perfect trading is like breathing—maintaining flexibility without needing to trade every market swing. The secret to profitable trading lies in implementing simple rules: repeating simple tasks consistently and enforcing them strictly over the long term.
Trading Strategy:
buy@107000-107500
TP:109000-1095000
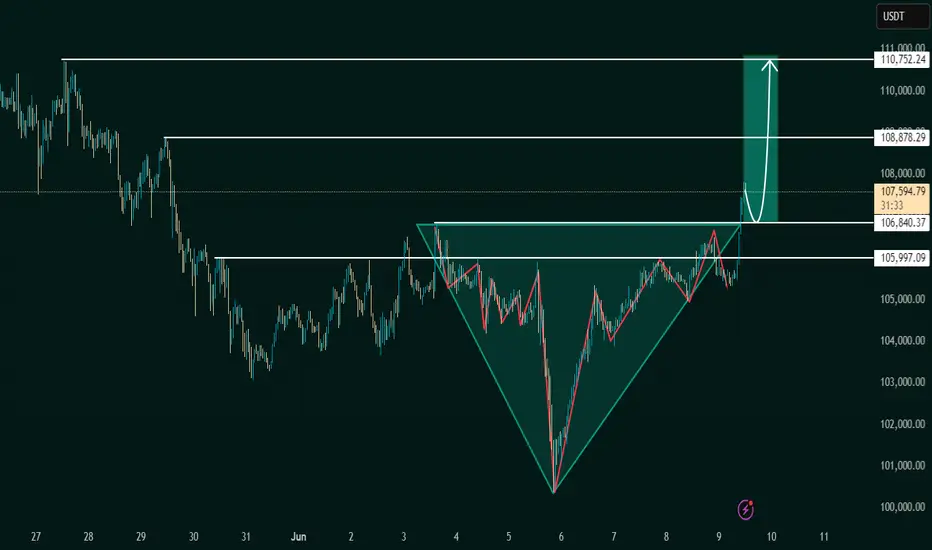
Inverse Head and Shoulders Breakout Signals BullishThe chart under review presents a classic Inverse Head and Shoulders pattern, a reliable and widely recognized bullish reversal formation in technical analysis. This structure typically forms after a downtrend, indicating a potential shift in market sentiment from bearish to bullish.
The pattern is composed of:
Left Shoulder: A modest price decline followed by a temporary upward correction.
Head: A deeper price decline forming the lowest point in the pattern.
Right Shoulder: A higher low that mirrors the left shoulder, followed by another upward movement.
The neckline, which acts as a critical resistance level, is clearly illustrated at approximately 106,840.37 USDT. A confirmed breakout above this neckline suggests the completion of the reversal pattern and validates the potential for a sustained bullish movement.
2. Breakout Confirmation
The current price action confirms a successful breakout above the neckline, with the market currently trading around 107,586.58 USDT. This breakout is a key signal for bullish continuation, provided it is supported by increased volume and follow-through price action.
From a technical standpoint, the breakout is reinforced by:
A clean violation of neckline resistance
Price consolidation near breakout zone before a strong upward thrust
Higher lows preceding the breakout, indicative of growing buying pressure
This confluence of technical signals strengthens the case for an upward price trajectory in the near term.
3. Projected Price Targets
Upon confirmation of the Inverse Head and Shoulders breakout, target levels can be derived using the measured move technique. This involves projecting the vertical distance from the head to the neckline upward from the breakout point.
Target 1 (Initial Resistance):
108,878.29 USDT – This level represents a potential short-term resistance where price may consolidate or retrace slightly before continuing.
Target 2 (Measured Move Completion):
110,752.24 USDT – This is the ultimate price target derived from the height of the head-to-neckline structure. Reaching this level would represent the full realization of the reversal pattern.
4. Key Support and Risk Levels
Risk management is a critical component of any trading strategy. The following support levels should be closely monitored:
106,840.37 USDT (Neckline Support):
Former resistance turned support. Holding above this level post-breakout is essential for sustaining bullish momentum.
105,997.09 USDT:
Acts as a secondary support level and potential stop-loss region for conservative traders.
If price fails to hold above the neckline and falls back below these levels, the breakout could be classified as a false breakout, warranting caution.
5. Strategic Implications for Traders
This setup provides a favorable risk-to-reward ratio for long entries, particularly for traders seeking to capitalize on momentum-based patterns. An optimal trading approach could involve:
Entry: Near the neckline breakout or on a minor retest of 106,840.37 USDT
Stop-Loss: Below 105,997.09 USDT or under the right shoulder to account for volatility
Take-Profit Zones: Partial profits near 108,878.29 USDT, with final target at 110,752.24 USDT
6. Final Remarks
This chart illustrates a textbook example of a bullish reversal pattern in play. While the technical outlook is favorable, traders should remain cautious of potential invalidation scenarios, especially in highly volatile or news-driven markets. Confirmation through volume analysis and supportive macro/fundamental conditions can further enhance confidence in the bullish thesis.
Overall, the current setup indicates a well-structured opportunity for upward price movement, with a clearly defined entry, risk, and reward framework.
Let me know if you'd like this tailored for a trading journal, client report, or automated strategy setup
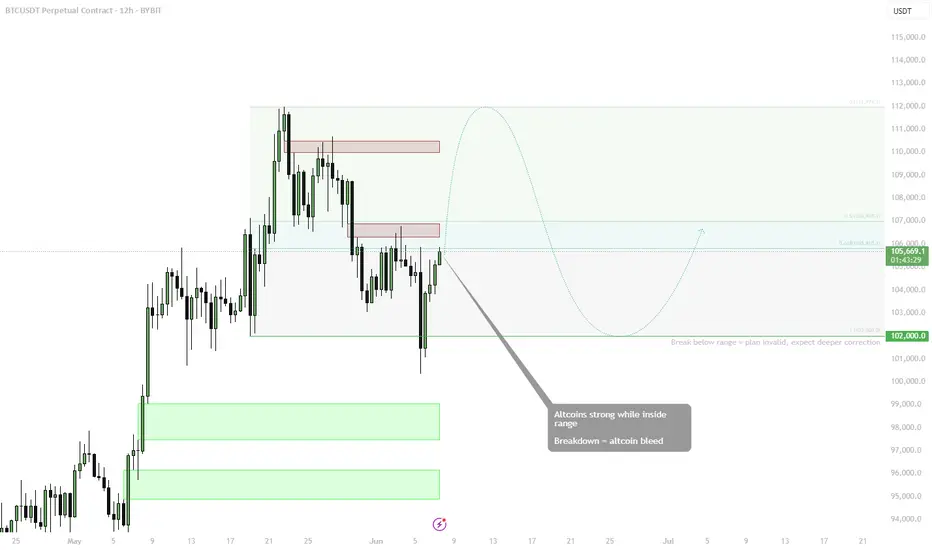
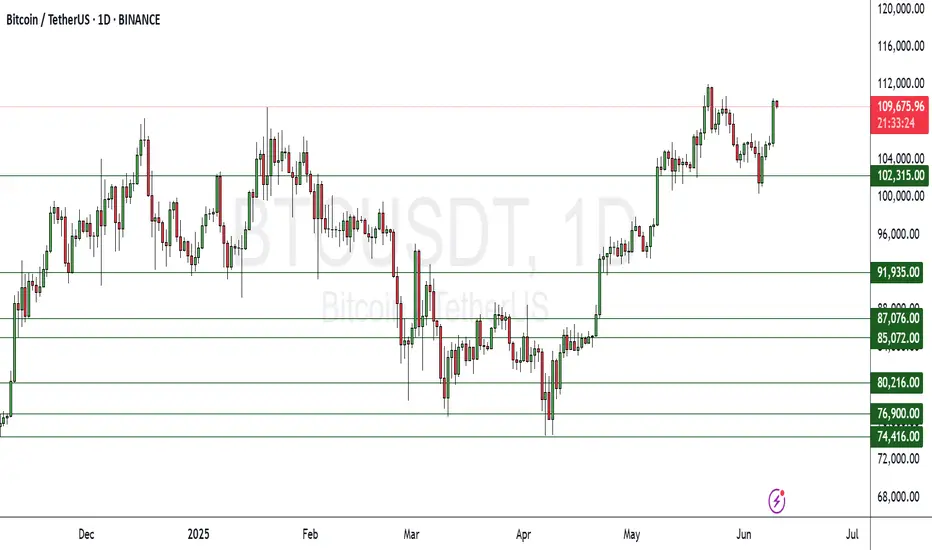
BTC — Altcoin Sentiment Hinges on BTC Holding BINANCE:BTCUSDT is consolidating within a well-defined range between ~$102K and ~$112K, with a bounce off the lower boundary now challenging midrange resistance. As long as BTC trades within the range, altcoins are expected to remain strong.
🟩 Midrange: $106K
• 0.618 fib and prior supply zone
• Key inflection for either a move higher or return to range low
🔻 Range Low Support: $102K
• Break below this = plan invalid
• Expect deeper BTC correction and altcoin bleed in that scenario
📈 Bias:
• Altcoins strong = only valid if BTC holds this structure
• Rotations likely while BTC moves sideways or grinds higher
• Upside target (range high): ~$111.9K
📌 BTC stability = altcoin opportunity. Breakdown from range? Get defensive fast.