BTC - SetupWe’ve just broken through the major bearish trend reversal zone.
If momentum holds — and I believe it will —
we’re likely about to see the next BTC rally,
which means altcoins will follow.
But now is not the time to enter.
Anyone who hasn’t positioned long after all the entry setups we had is just fucked and missed it...
Right now, it’s time to wait and to do nothing.
We’ll see what the future will bring.
This is also the moment to lock in and stick to your plan — no matter what.
Euphoria is coming, and those without fixed rules
are going to get absolutely wrecked.
LFG.
Send it higher. 🚀
BTCUSDT.P trade ideas
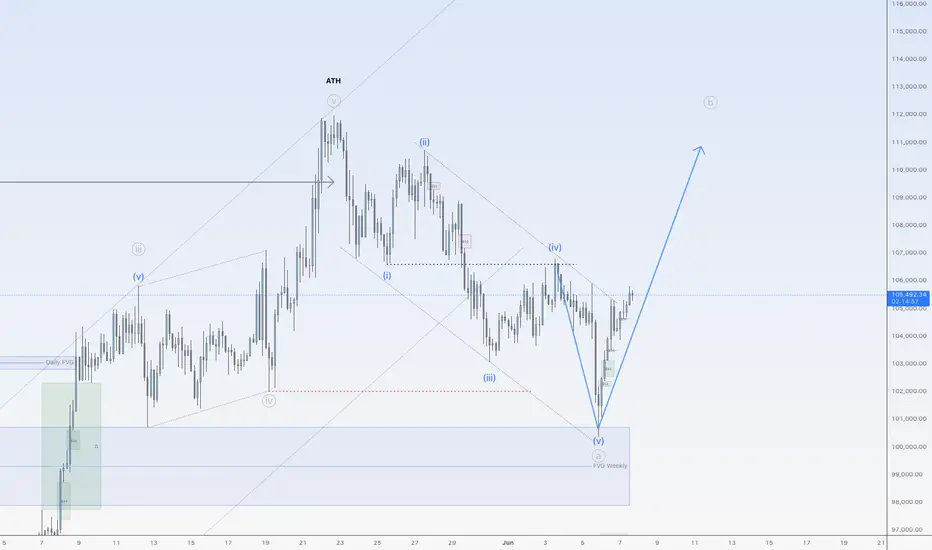
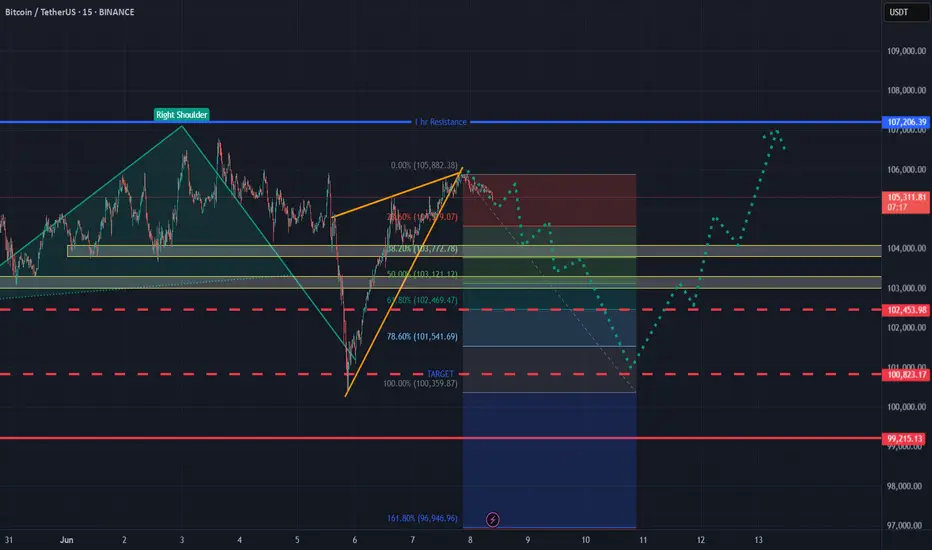
Correction up for BitcoinHi traders,
Last week Bitcoin broke below the red dotted line so now we could see a much bigger correction for Bitcoin.
Price came into the Weekly bullish FVG and rejected to the upside. This could be the start of wave B (grey) of a big correction down.
Let's see what the market does and react.
Trade idea: Wait for a change in orderflow to bullish to trade (short term) longs again.
If you want to learn more about trading FVG's with wave analysis, please make sure to follow me.
This shared post is only my point of view on what could be the next move in this pair based on my analysis.
Don't be emotional, just trade your plan!
Eduwave
Bitcoin's Next 20% Move? My Plan Unveiled Bitcoin (BTC) - Navigating Key Levels & Potential Paths
Technical Outlook — 8 June, 2025
1. Current Market Context:
Price Action: Bitcoin is currently trading around the $106,000 mark after a recent retracement from higher levels. We've seen a significant rally from the April lows, and the market is now consolidating.
Key Levels: The chart highlights several important resistance and support zones that will likely dictate future price movements.
2. Key Observations & Potential Scenarios:
Resistance Levels:
Immediate Resistance: ~$108,000 - $112,000. This zone has acted as resistance previously and is currently being tested.
Next Major Resistance: ~$124,000 - $128,000. This is a crucial zone from previous highs and a potential target if the current resistance is overcome.
Support Levels:
Immediate Support: ~$96,000 - $100,000. This zone aligns with previous price consolidation and is the first line of defense if the price drops.
Strong Support: ~$92,000 - $88,000. This area previously acted as significant support and could be a strong bounce zone.
Lower Support/Trendline: ~$76,000 - $80,000. This aligns with the lower boundary of the broader ascending channel/trendline.
Highlighted Paths (Orange Arrows): The chart suggests two potential paths:
Scenario A (Bullish Continuation): A break above the $108,000-$112,000 resistance, leading to a push towards $124,000-$128,000. This would likely follow a slight dip or consolidation before the breakout.
Scenario B (Retracement & Bounce): A deeper retracement towards the $96,000-$100,000 or even $92,000-$88,000 support zones, followed by a bounce and subsequent rally towards the higher resistance levels. This scenario aligns with the idea of a healthy correction before further upward movement.
3. Trading Plan:
A. Bullish Entry (Aggressive / Confirmation Trade):
Trigger: Clear daily candle close above the $112,000 resistance level with strong volume.
Entry: Upon confirmation of the breakout.
Target 1: $124,000
Target 2: $128,000
Stop Loss: Below the newly formed support level (e.g., $105,000 - $107,000, depending on the breakout structure).
B. Long Entry (Dip Buy / Value Trade):
Trigger: Price retests and holds either the $96,000 - $100,000 support zone or the $92,000 - $88,000 support zone. Look for bullish reversal candlesticks (e.g., hammer, bullish engulfing) on the daily timeframe.
Entry: Upon confirmation of support holding and a bullish reversal signal.
Target 1: $108,000
Target 2: $112,000
Target 3: $124,000 - $128,000 (if momentum continues).
Stop Loss: Just below the tested support zone (e.g., $95,000 for the first support, or $87,000 for the second support).
C. Bearish Outlook (Short-Term / Risk Management):
Trigger: A clear daily candle close below the $88,000 support level, invalidating the current bullish structure.
Action: Consider exiting long positions or being prepared for further downside towards the $76,000 - $80,000 level. This would suggest a breakdown of the overall uptrend.
4. Risk Management:
Position Sizing: Only risk a small percentage of your trading capital on any single trade (e.g., 1-2%).
Stop Loss: Always use a stop loss to limit potential losses.
Profit Taking: Consider taking partial profits at target levels to secure gains.
Market Volatility: Bitcoin is highly volatile. Be prepared for rapid price movements.
5. Additional Considerations:
Volume: Always pay attention to trading volume. Strong volume on breakouts confirms the move, while weak volume may suggest a false breakout.
If you found this analysis valuable, kindly consider boosting and following for more updates.
Disclaimer: This content is intended for educational purposes only and does not constitute financial advice.

BTC Market Wicks & Key Levels
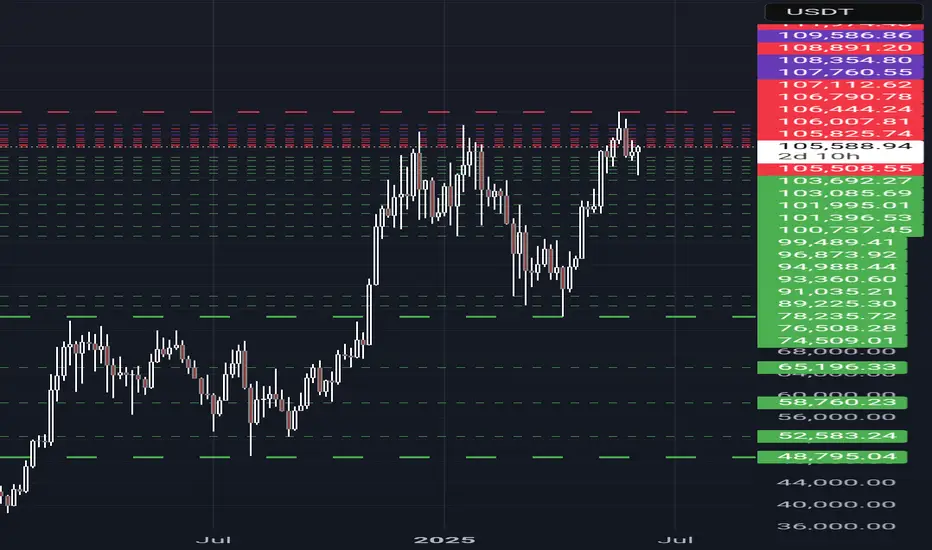
ZemoG Trading: Market Wicks & Key Levels 🔮📊
Please note:
At ZemoG Trading, we don’t concern ourselves with market direction. Whether the market moves up or down, we embrace both long and short opportunities with precision and patience. Our focus is on positioning for high-probability entries based on market structure and wick reactions.
---
🔄 Current Market Outlook:
From our perspective, the market has been completing a significant structure. We're anticipating a revisit to the 100.7K wick level. If price closes below that, we continue to expect a deeper correction toward our primary target of 74.5K.
However, as price continues to bounce upwards, it’s essential to remain dynamic and present. If you are currently in a long or planning to enter one, it’s important to observe how price behaves around key wick levels to validate the continuation of the move.
The same applies if you’re preparing to go short — we are watching for how price interacts with major historical wick levels.
---
📉 SHORTS – What We’re Looking For:
When price action reaches these wick zones, we are watching closely for:
A candle to wick above a key level, then fail to hold,
Followed by the formation of a new upper wick, signaling a potential reversal in market direction.
---
📈 LONGS – What We’re Looking For:
For long confirmations, we want to see:
Price reaching a key wick level,
Followed by new bottom wicks forming, indicating strong buying pressure and upward continuation.
---
🔑 ZemoG Key Wick Levels to Watch:
Upper Levels (Watch for short signals):
105.5K
105.8K – Key Level
106.8K – Key Level
107.1K – Key Level
108.9K – Key Level
109.5K
Lower Levels (Watch for long signals):
104.6K
104.2K
103.4K
103K
102.3K
100.6K
---
Stay tuned for our next post, where we’ll dive deeper into how wick reactions at these levels align with ancient cycle patterns and harmonic price echoes 🔁📐
As always—"Wicks don’t lie."
— Team ZemoG 🔮
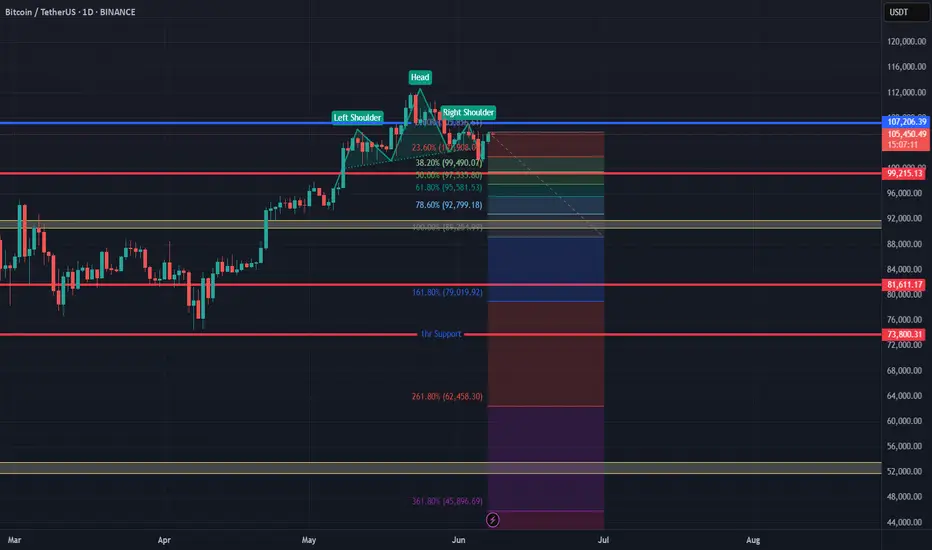
Bitcoin's Roadmap: Price Structure, Fair Value & Market RhythmSince bottoming on November 21, 2022, Bitcoin has embarked on a remarkable bull run, rising +623.5% over 927 days and reaching a new all-time high (ATH) of ~112K.
When compared to the previous bull cycle, spanning 1061 days and producing a +2086% gain, this current rally shows signs of diminishing returns, a typical behaviour of maturing markets. Traders now face a critical question: has Bitcoin peaked for this cycle, or is another surge toward ~120K+ possible?
Historical Echoes: Elliott Wave Comparison
The 2018–2021 bull market formed a five-wave Elliott structure. That cycle ended with a -77.5% correction. The current cycle similarly traces out a completed five-wave advance from the $15.5K low, suggesting we may now be in a corrective phase.
Current hypothesis: Bitcoin is in Wave B of an ABC correction, with Wave C potentially targeting $64K–$70K.
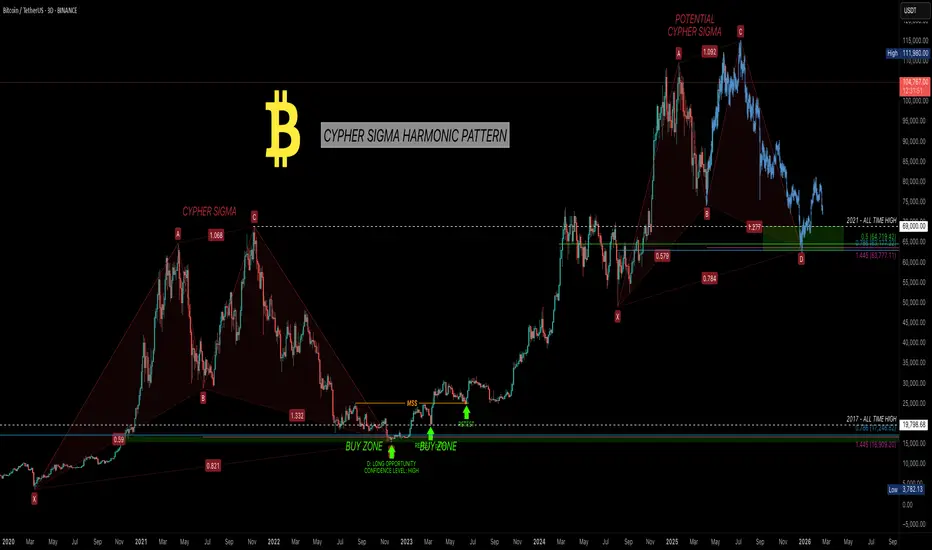
Harmonic Confirmation: Cypher Sigma Pattern
A refined harmonic formation, I call it the Cypher Sigma Harmonic Pattern (CSHP) and it has proven highly effective in volatile assets like Bitcoin. It differs from the classic Cypher by:
BC projection: 1.07–1.136 of XA (vs. 1.272–1.414)
CD retracement: 0.786–0.886 of XC
BD extension: 1.272–1.618 of BC (not present in traditional Cypher but often targets 1.272-2.0)
In 2022, this pattern predicted the bottom near $16K. Currently, another Cypher Sigma is potentially forming, pointing to a possible correction to ~$64K. This target aligns with historical level (the 2021 ATH zone) and represents a possible -40% pullback.
Multi-Layered Technical Confluence
Pitchfork Resistance: Bitcoin rejected the upper resistance (Fib 1.0–1.136 zone)
Pitchfork Golden Pocket Support: ~$64K matches the golden pocket and high-liquidity area
Fibonacci Circles: Rejection precisely at the 1.618–1.65 circle arc (~$112K)
Speed Fan 0.618: Key structural support intersects projected retracement zone
Previous 2021 ATH
Together, these tools strongly support the hypothesis of a macro top forming.
Fair Value Trend Model (FVTM) – New Indicator
As part of ongoing research into Bitcoin’s long-term valuation, I developed the Fair Value Trend Model—a logarithmic regression-based indicator tailored for Bitcoin. Here is an example on the monthly timeframe.
Key Features:
Computes a log-log regression: ln(Price) vs ln(Days since inception)
Yields a power-law growth curve: F(t) = C · ^b
Includes dynamic channel bands at user-defined percentage offsets
Projects the trend forward in time with linear extrapolation
I have just freshly published this indicator for free on TradingView. Visit my profile, add it to your chart, and explore how Bitcoin consistently revisits its fair value in bear markets before launching new macro waves.
Use Cases:
Identify overextensions above the fair value channel
Spot mean-reversion setups near the lower channel band
Gauge long-term trend continuation via slope and forecast
The indicator is best used on daily, weekly and monthly charts, and it supports both all-time and rolling-window modes.
Educational Insight:
The Fair Value Trend Model isn’t just a tool! It's a lens to view the long-term rhythm of the Bitcoin market. By understanding where the fair value lies, you gain the clarity to separate short-term volatility from long-term opportunity.
Every great trader starts with a desire to understand. If you're learning, experimenting, and observing patiently—you’re on the right path. Let this model be your guide through the noise. Trust the math, respect the cycles, and never stop refining your edge.
Study day and swing trading, improve your technical and psychological skills, and wait patiently for high-probability trade setups, whether short-, medium-, or long-term. Being patient is key.
Psychological Insight: Mastery Over Impulse
The greatest returns favour the patient. Traders who ignored the noise in 2022 and accumulated around $16K were rewarded exponentially. As Bitcoin potentially enters a correction, the same principle applies: monitor, learn, and prepare—not panic.
Top-tier traders execute based on structure, not emotion. This cycle will reward those who:
-> Study multi-timeframe confluences
Outlook: Bearish Retracement, Bullish Opportunity
While a push to $120K+ is possible, the confluence of Elliott Wave, harmonic patterns, and macro tools suggest a potential 40% retracement into ~$64K by end of 2025/early 2026. This aligns with historical patterns and may offer a great buying opportunity.
This cycle isn’t about catching the exact top—it’s about navigating it intelligently. Use tools that reflect structural value, not just reactive price action. Combine the Fair Value Trend Model with other tools to gain clarity. Most importantly: remain curious, remain disciplined.
Happy trading.
Thanks for reading =) stay sharp, stay patient, and keep evolving 🚀
_________________________________
If you found this helpful, leave a like and comment below! Got requests for the next technical analysis? Let me know.
Btcusdtbtc beat most of the traders expectation as btc did massive sell two days ago and pick up to seek higher price again...
so am still expecting btc to seek lower price even if is going to continue his bulish movement again. so the bias is to buy and to sell later

Hanzo / BTC 15 Min ( Accurate Tactical Bearish Breakout )🔥 BTC – 15 Min Scalping Analysis
⚡️ Objective: Precision Breakout Execution
Time Frame: 15-Minute Warfare
Entry Mode: Only after verified breakout — no emotion, no gamble.
👌Bearish Break : 109000
Price must break liquidity with high volume to confirm the move.
☄️ Hanzo Protocol: Dual-Direction Entry Intel
➕ Zone Activated: Strategic liquidity layer detected — mapped through refined supply/demand mechanics. Volatility now rising. This isn’t noise — this is bait for the untrained. We're not them.
🩸 Momentum Signature Detected:
Displacement candle confirms directional intent — AI pattern scan active.
— If upward: Bullish momentum burst.
— If downward: Aggressive bearish rejection.
🦸♂️ Tactical Note:
The kill shot only comes after the trap is exposed and volume betrays their position.
BITCOINBITCOIN ,the quick buy back at 100k level on demand floor faces a strong supply roof at 106k-105.98k level.
the rejection at 106k -105.98k level is backed by broken demand floor to act a supply roof .if buyers don't break this roof they could retest 100k again and break below will trigger 97k daily support zone .
on a flip side,a break and close followed by successful retest will be eyeing 113k-115k ascending supply roof based on the ascending trendline structure on daily.

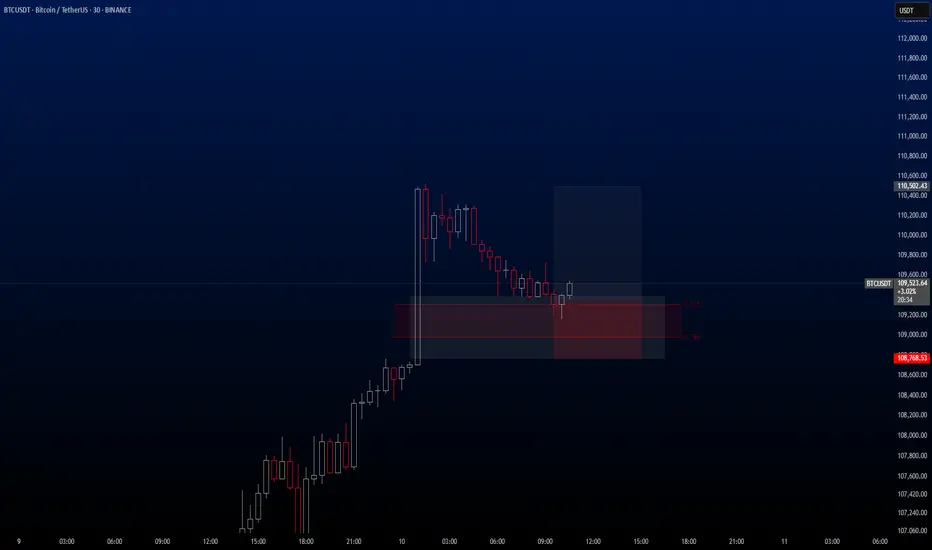
BTCUSDT Hello traders. I’ve spotted an ideal entry opportunity on the BTCUSDT pair. I’ve taken the trade and wanted to share it with you as well.
🔍 Trade Details
✔️ Timeframe: 15-Minute
✔️ Risk-to-Reward Ratio: 1:2
✔️ Trade Direction: Buy
✔️ Entry Price: 109,357.89
✔️ Take Profit: 110,502.43
✔️ Stop Loss: 108,768.53
🔔 Disclaimer: This is not financial advice. I’m simply sharing a trade I’ve taken based on my personal trading system, strictly for educational and illustrative purposes.
📌 Interested in a systematic, data-driven trading approach?
💡 Follow the page and turn on notifications to stay updated on future trade setups and advanced market insights.
BEARS INTO MARKET FOR BTC SELL COMINGHi Guys Expecting some sell for BTC
I can see some Seller walk into market thats possible will sell next few days
Lets see what happens
Best of luck

#BTC/USDT#BTC
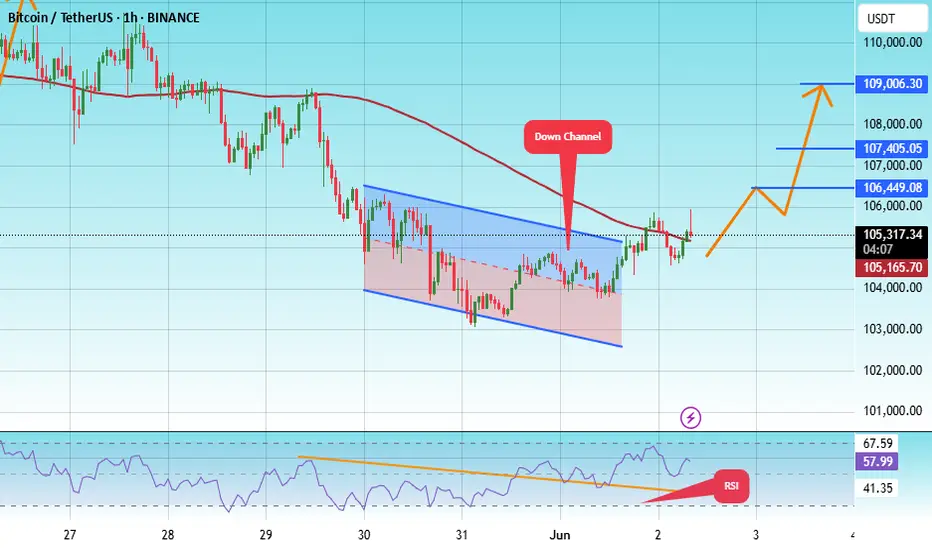
The price is moving within a descending channel on the 1-hour frame, adhering well to it, and is heading for a strong breakout and retest.
We are experiencing a rebound from the lower boundary of the descending channel, which is support at 103141.
We are experiencing a downtrend on the RSI indicator, which is about to break and retest, supporting the upward trend.
We are looking for stability above the 100 moving average.
Entry price: 105268
First target: 106500
Second target: 107405
Third target: 109006
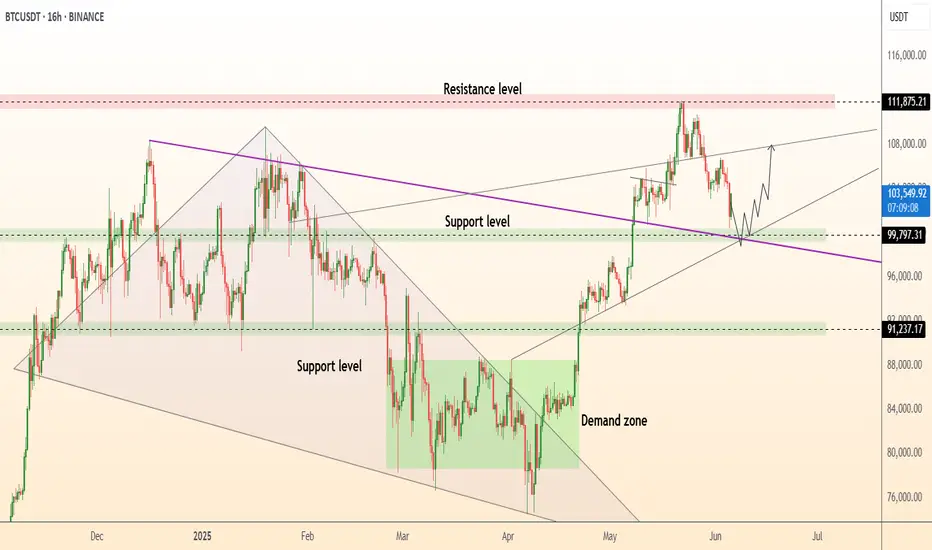
DeGRAM | BTCUSD held the $100k level📊 Technical Analysis
● Bounce from 99.8-100 k confluence (violet trend-line + former wedge top + horizontal demand) confirms the zone as fresh support.
● Price coils in a tight pennant under 106 k; 1.618 target of the pattern meets the rising-channel roof and red supply at 111-112 k, while RSI prints higher lows, flagging hidden bullish momentum.
💡 Fundamental Analysis
● CME futures basis widened above 10 % annualised as softer US claims cooled dollar bids, boosting carry appetite; meanwhile, on-chain reserves keep shrinking, hinting at supply squeeze.
✨ Summary
Buy 100-103 k; pennant break >106 k aims 111 k → 115 k. Bull view void on an H16 close below 99 k.
-------------------
Share your opinion in the comments and support the idea with a like. Thanks for your support!
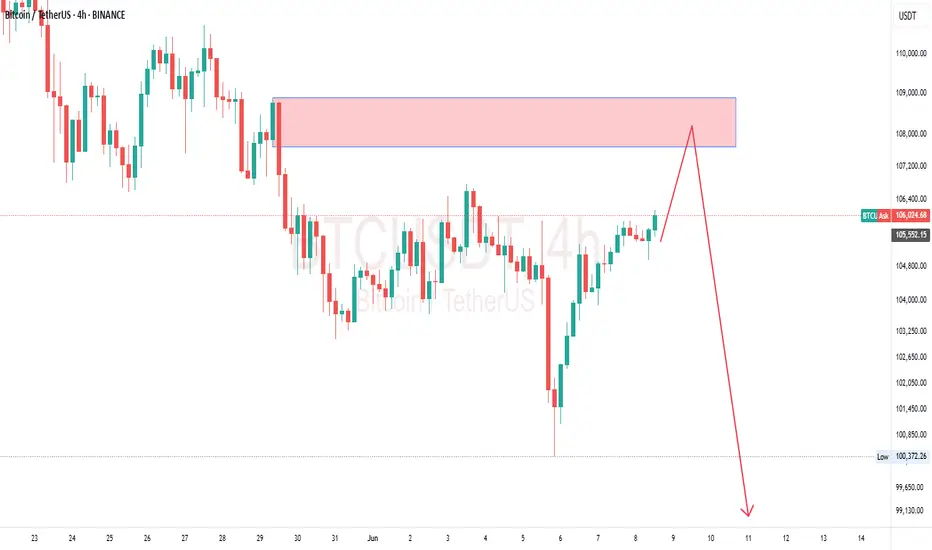
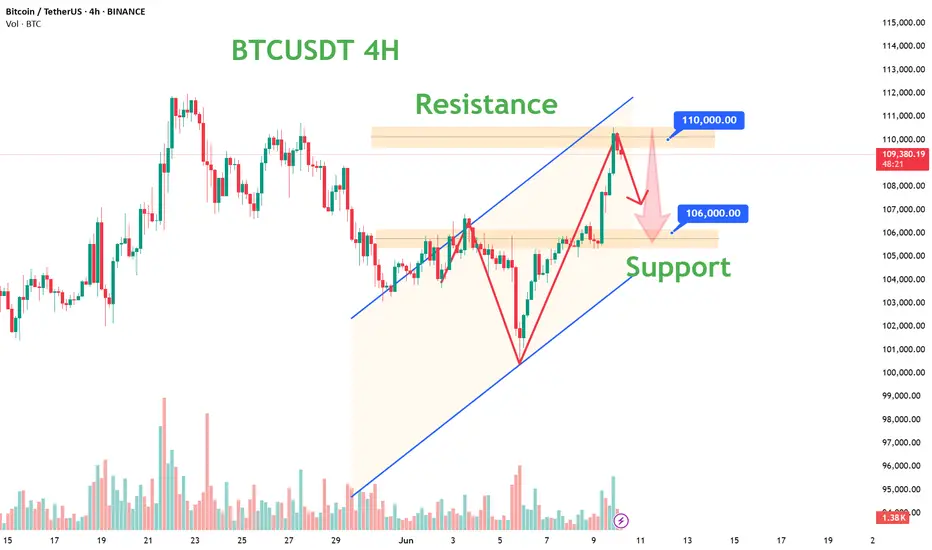
Bitcoin Approaches Resistance as Momentum Cools: What’s Next?Bitcoin has been on a strong upward trend 🚀, but recent moves show signs of exhaustion as it approaches major resistance zones 🛑. The appearance of a three-drive pattern on the 4-hour chart, suggests the market could be due for a healthy correction 🔄. While the broader trend remains bullish, I'm watching for a potential pullback and then looking for renewed strength (bullish BoS) before considering new long positions. Patience and confirmation are key in these conditions! 👀✨

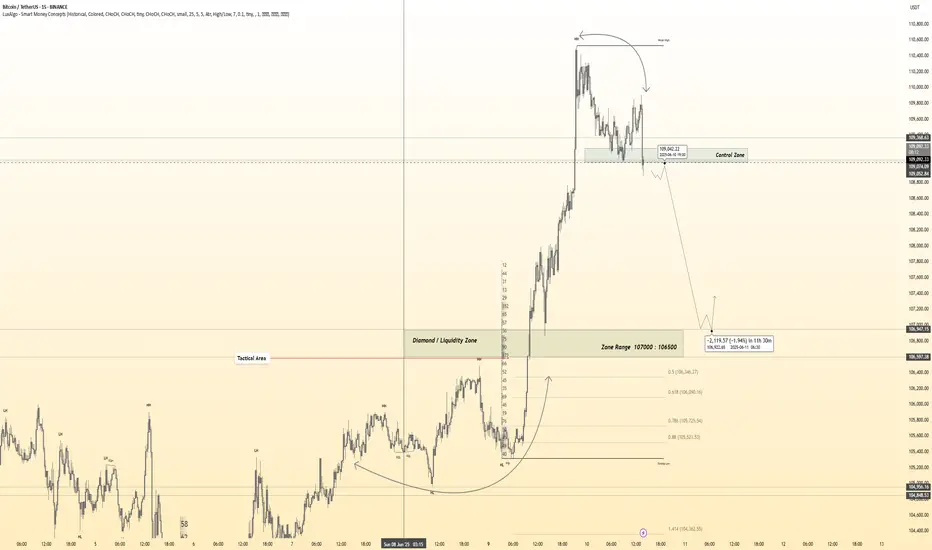
BTC's trading strategy for todayBTC has continued its upward trend as analyzed. It tested the resistance area above 110,000 today and began to decline. A small - scale decline is expected within the day, and short - term trading can try shorting.
BTC's trading strategy for today:
BTCUSDT sell@110000-111000
tp:108000-107000
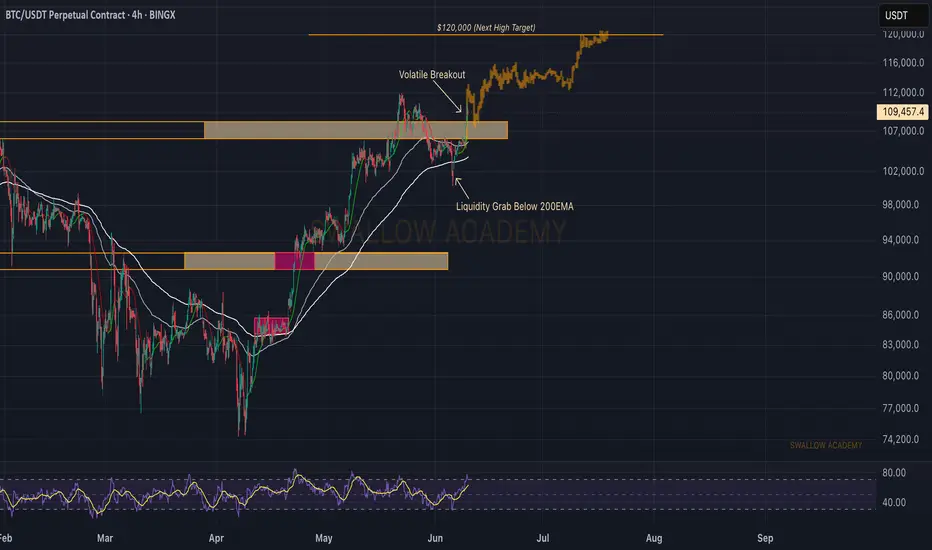
Bitcoin (BTC): Heading Towards The All Time Hight Bitcoin is still pushing into the second day of the week, where the price is heading towards the ATH area for a retest and potential breakout (which we have been looking for). Now if we keep that same momentum, we are guaranteed to retest the ATH area, where high volatility can be expected!
Swallow Academy
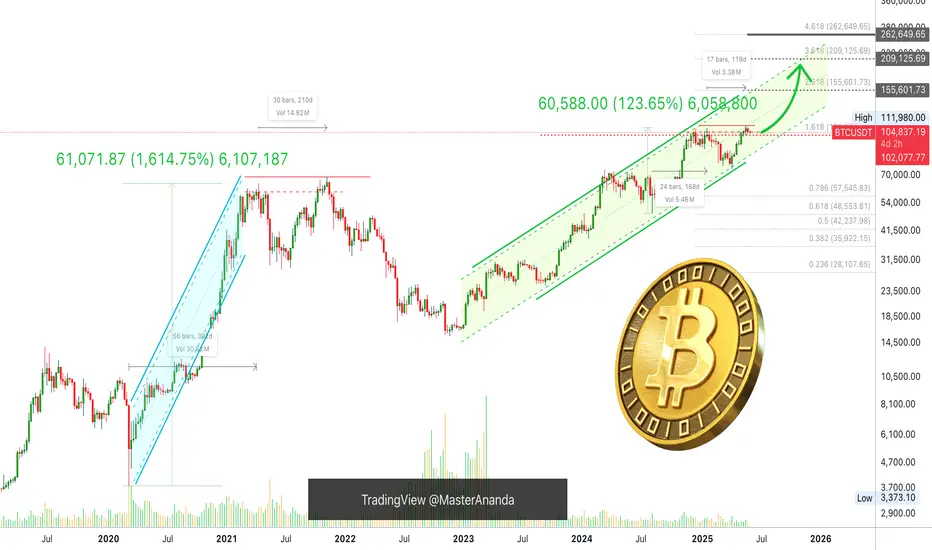
Correction? Show Me the Correction —Bitcoin Is Going Up!There is no correction and this "double-top" is nothing similar to 2021.
First, the wave that led to the April 2021 ath was a major hyper bullish wave starting March 2020. A total of 392 days of bullish action non-stop with 1,615% total growth. From a low of $3,782 to a high of $64,854, Boom!
The wave that led to the January 2025 all-time high was not a mega hyper, hyper-bullish bullish wave, instead it came after a long period of consolidation and a flash crash, which means the establishment of a long-term support. It started August 2024 and lasted 168 days total growth 124%. Completely different, so don't tell me that market conditions are the same because they aren't, we are not stupid, actually, we are very smart, right my friends? Long-term followers, readers and supporters!
The first high in 2021 happened in April the second in November, 210 days apart.
In 2025, we have a top in January and another one in May, 119 days. Very, very different.
In 2021 the altcoins rallied, everything rallied and everything was trading at new all-time highs before the bear market.
In 2025, nothing has rallied and most of the market was trading at the bottom. So we had an early peak in 2021, we get a late peak in 2025.
Since we had a long-term double top in 2021, we get a blow-off top in 2025, late 2025. Do you understand?
I am the Master of the charts!
Bitcoin is not done; it isn't over. We have an entire bullish wave before the bull market is over. This bullish wave is the fifth wave which is the speculative wave, in this wave anything goes. The market will go crazy. There will be euphoria, passion, craziness, money, growth!
The altcoins will be hitting new all-time highs and everybody will go crazy. NFTs, DeFi, DePin, RWA, Memes, POW, Gaming, AI, new, big, small and old, all welcomed, everything will grow. When the pixelated rocks start selling for millions of dollars, that's when the bull market ends.
When people start saying "Bitcoin will go to $1,000,000 in this cycle." That's when the top is in.
When Bitcoin starts trading at $219,999 and starts to slow down and Ark Invest comes up and says, "Bitcoin is going to $5,000,000 next"; when Michael Saylor starts saying, "I will be buying the top forever..." Get ready because that's the end. It isn't happening, now people are still talking about corrections and doubt, that's not the end of a bull market, that's the transition period between an advance a correction and the next leg up.
Just wait and watch. Just watch my friend... Just watch!
I assure you, Bitcoin is going up!
Namaste.
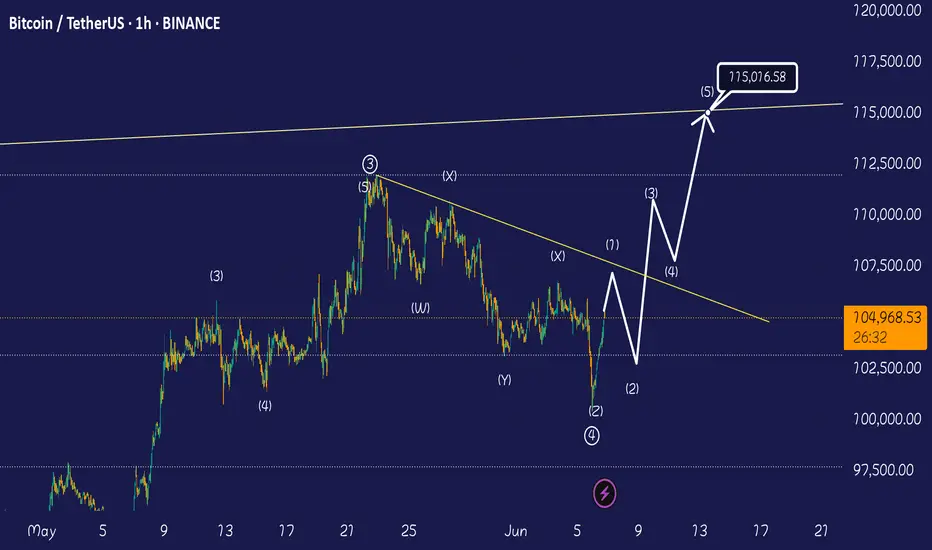
114k very soon Btc successfully completed wave4 , price can rise until 107k and after that micro wave 2 will correct price to 103k-104k , i dont open short position because BTC is very bullish, but i will wait for micro wave 2 . Good luck 👍
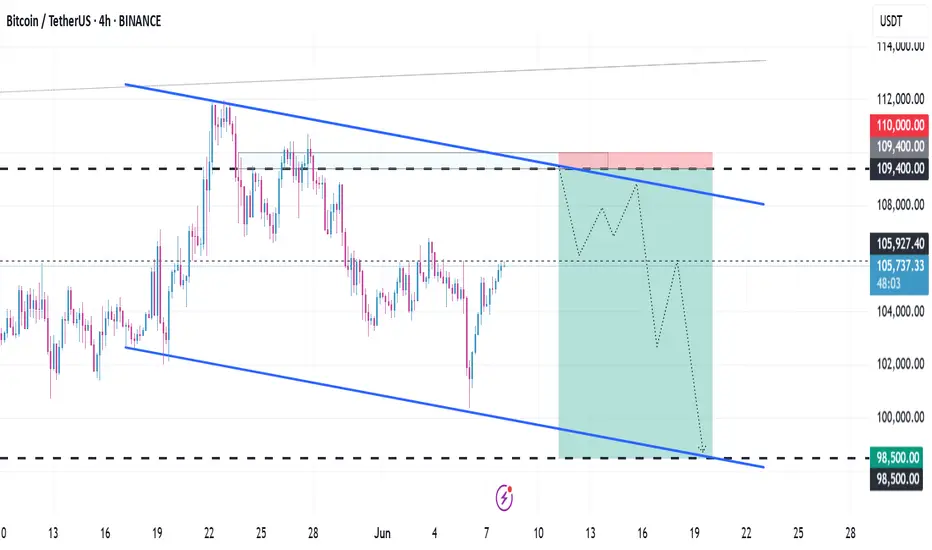
Plan BTCWith this idea combined with ichimoku, I found a confluence entry point with a short stop loss, the target is 98500, then I will consider gradually accumulating goods there.
Possible Bitcoin price movement in the upcoming cyclePerhaps to attack the ceiling of the ascending channel, it would be better to collect the remaining liquidity in the 89,000 area, then move strongly towards 35,000.

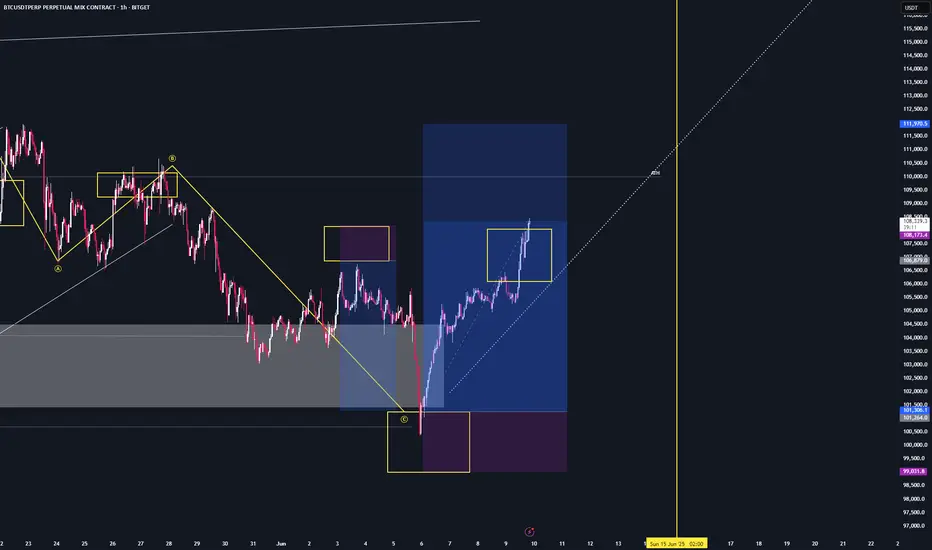
BTC - setupWe’re currently sitting in a bearish trend reversal zone,
so a pullback is absolutely possible —
and honestly, if you’re heavily long, it wouldn’t be the worst idea to look for some short hedges here.
However, we also have clear signals that are pushing us toward a breakout:
1️⃣ The heatmap shows a massive stack of shorts right above us
2️⃣ The ongoing U.S.–China meeting in London where tariffs are being discussed
➡️ One positive headline could ignite the next rally.
I'm bullish and positioned accordingly.
If anyone has questions, drop them below — I read everything 👇
LFG! 🚀
