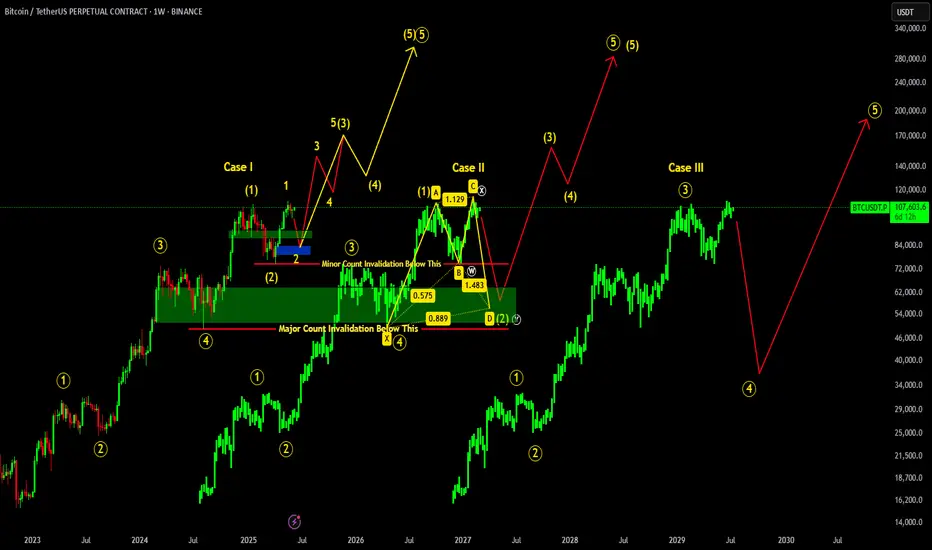
BITCOIN ROAD TO 300K !!! ELLIOTT WAVE CASE STUDYThere are three possible cases for Bitcoin which we can now consider according to Elliot wave count on big picture:
Case I: According to this count if we hold above 74.5k , recent low, we may see major shift in BTC. Retracement Up to 92-79k is good which will form inverse head & shoulders, potentially breaking ATH up to 170K, if things goes well & 74.5K region remains on hold.
Case II: If in case 74.5K region breaks, then it will invalidate minor count causing BTC to retrace more up to 64-52K major reversal zone region. If such thing happens, bullish shark pattern will be formed causing major reversal from that region BUT 49K region should remained hold!!!
Case III: Worst case scenario if 49K region breaks, then it will cause major count invalidation dropping BTC further up to 45-33K region.
BTCUSDT.P trade ideas
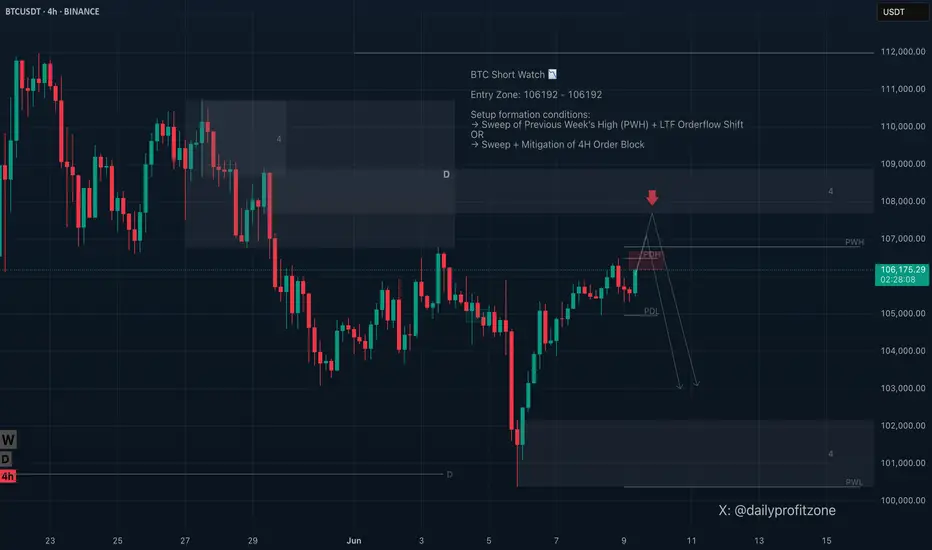
Bitcoin Short Setup — Watch for Entry After Liquidity Grab📍 BTC Potential Short Setup — Watching for Liquidity Sweep and Orderflow Shift
I’m monitoring Bitcoin for a potential short opportunity.
📌 If price sweeps the previous week’s high (PWH), I’ll look for a lower time frame orderflow shift to confirm entry.
Additionally, the sweep may coincide with a mitigation of the 4-hour order block.
✅ If these conditions align, I’ll consider an entry from the 106192–106192 zone.
Conditions for entry:
→ Sweep of PWH liquidity
→ Lower time frame orderflow shift after the sweep
→ Possible mitigation of 4H order block
⚠️ No setup without confirmation — I’ll wait for a valid reaction on LTF before entering.
📍 Stay tuned and follow for live updates on this setup.
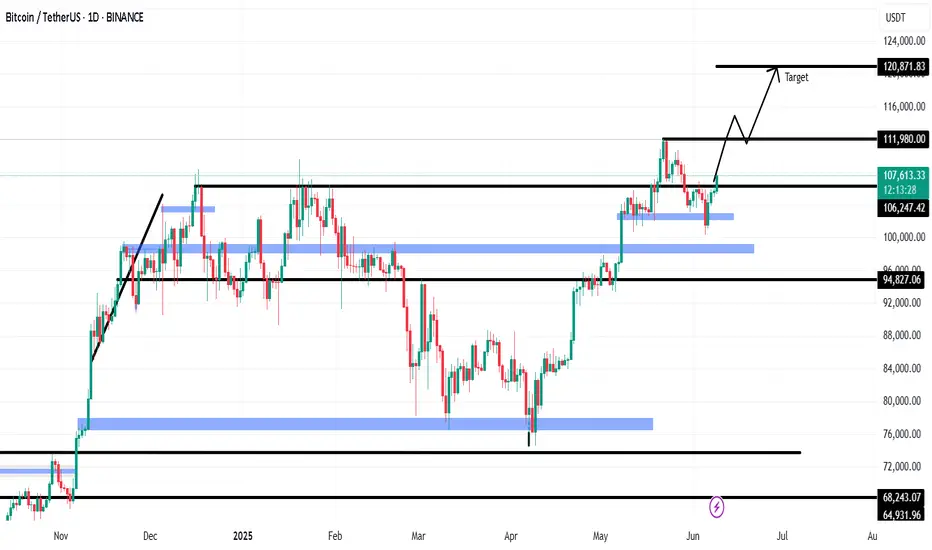
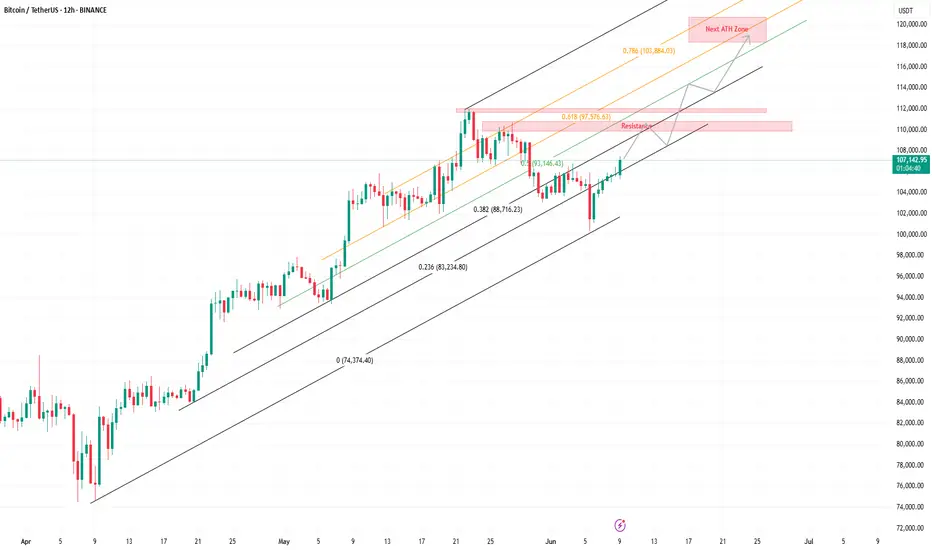
BTC could form a new ATH between 118K-120KBTC will be resisted between 110 K- 111 K, but will continue to rally to form a new ATH between 118 K- 120 K.
There could be another possibility that BTC will sharply move to the 0.618-0.786 Fib channel, and then continue within that channel to make a new ATH.
Let's see.
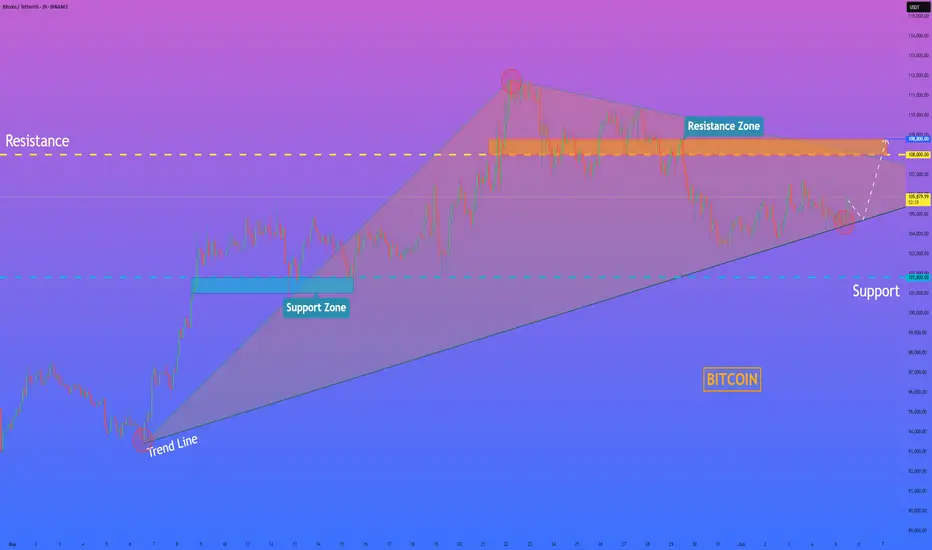
Is the #BTC rally over?📊 Is the #BTC rally over?
🧠From a structural perspective, we have reached the ideal target zone of the double top bearish structure, so a strong rebound is very reasonable. The realization of the ideal target zone means that the previous decline has ended. We need to change our thinking and stop being too bearish. Stay cautious!
➡️At the same time, the goals of the long structure we built in the support area have also been fully achieved, and this period of rise has reached the lower edge of the extended wedge + the downward trend line + the blue resistance area very quickly, so there is a possibility of a pullback, so don’t chase the rise here. If you want to participate in long transactions, we should pay attention to the opportunities after the pullback.
Let’s see👀
🤜If you like my analysis, please like💖 and share💬
BITGET:BTCUSDT.P

Volatility period has begun.
Hello, traders.
Please "Follow" to get the latest information quickly.
Have a nice day today.
-------------------------------------
We need to see if the price can hold above OBV Low.
We need to see if the price can hold above OBV High or HA-High.
It is showing a downward trend while failing to rise above OBV Low.
If this continues to decline further, we should check if the HA-Low indicator is newly created.
This volatility period is expected to start around June 6 (June 5-7) and continue until around June 13 (June 12-14).
If the auxiliary indicator OBV falls below the Low Line, there is a possibility of another large decline.
At this time, the key is whether it can receive support and rise near 99705.62.
If not, it is expected to select the trend again when it meets the M-Signal indicator on the 1W chart.
The basic trading strategy is to buy at the HA-Low indicator and sell at the HA-High indicator.
If you apply this basic principle, you buy when it rises above 102049.52 and shows support, and sell near 104938.72.
For this basic principle to be applied normally, OBV is rising and the StochRSI indicator is rising.
However, it is better if the StochRSI indicator has not entered the overbought zone if possible.
However, if it is resisted and falls at the HA-Low indicator, it is likely to show a stepwise downtrend, and if it is supported and rises at the HA-High indicator, it is likely to show a stepwise uptrend.
Therefore, when testing support near the HA-Low indicator, if the OBV shows a downward trend and the StochRSI indicator shows a downward trend (if possible, a downward trend in the overbought area), the possibility of a stepwise downtrend increases.
The end of the stepwise uptrend that occurs after meeting the HA-Low or HA-High indicator is a downtrend, and the end of the stepwise downtrend is an uptrend.
Therefore, the trading method should be a fractional trading method.
I think the important thing in spot trading is how much you increase the number of coins (tokens).
Of course, depending on the situation, it may be better to make cash profits.
Since the coin market allows trading in decimal units, it is a useful investment market for increasing the number of coins (tokens).
Therefore, we can increase the number of coins (tokens) corresponding to profits while conducting trading according to the basic trading strategy.
That is, when the price rises by the purchase amount for each purchase price, sell it and leave the number of coins (tokens) corresponding to the profit.
At this time, you should be careful to include the transaction fee in the purchase amount and sell it.
The coins that are good for increasing the number of coins (tokens) corresponding to the profit rather than cash profit are BTC or ETH.
Additionally, BNB is also possible.
I think it is better to obtain cash profit if possible for the rest of the altcoins.
However, if there is a coin (token) that you think you want to increase in the medium to long term, you can increase the number of coins (tokens) corresponding to the profit by increasing the number of coins (tokens).
-
Thank you for reading to the end.
I hope you have a successful transaction.
--------------------------------------------------
- This is an explanation of the big picture.
(3-year bull market, 1-year bear market pattern)
I will explain more details when the bear market starts.
------------------------------------------------------

Market Overview
WHAT HAPPENED?
Last week, after fluctuating in a sideways range, bitcoin began to decline. Only $300 wasn’t enough to reach the level of $100,000 — there was a strong absorption of market sales, and a rebound occurred.
WHAT WILL HAPPEN: OR NOT?
We tested the $104,500–$105,800 zone (accumulated volumes). There is no abnormal activity or strong sales within it, which increases the likelihood of continued upward movement to the next sell zone. After that, the current volumes may go long, forming a new support zone in the range of $105,800–$104,500.
This week, we can consider a long retest of the support of $104,500–$105,800 with confirmation of the buyers' reaction. However, low volumes in the upward wave keep the risk of a sharp resumption of sales. In this case, the key entry level will shift to the psychological mark of $ 100,000.
Supply Zone:
$107,000–$109,800 (accumulated volumes)
Demand Zones:
$101,600–$100,000 (previous push-volume zone + current buyer defense)
$98,000–$97,200 (local support)
$93,000 level
$91,500–$90,000 (strong buy-side imbalance)
IMPORTANT DATES
Macroeconomic developments this week:
• Wednesday, June 11, 12:30 (UTC) — publication of the basic US consumer price index for May, as well as in comparison with May 2024;
• Thursday, June 12, 06:00 (UTC) — UK GDP for April is published;
• Thursday, June 12, 12:30 (UTC) — publication of the number of initial applications for unemployment benefits and the US producer price index for May;
• Friday, June 13, 06:00 (UTC) — German consumer price index for May is published.
*This post is not a financial recommendation. Make decisions based on your own experience.
#analytics

HelenP. I Bitcoin may grow to resistance zone from trend lineHi folks today I'm prepared for you Bitcoin analytics. This chart shows how the price declined to the trend line and then made an impulse up to the support level, which coincided with the support zone. Also, price started to trades inside a pennant, where it soon broke the support level and then traded some time near it. Later, it continued to grow and in a short time rose to the resistance level, which coincided with the resistance zone and broke this level as well. Then BTC reached the resistance line of the pennant, turned around, and dropped below the 108000 level, after which a few moments traded between this level. After this, price continued to fall and after it broke 108000 leve one more time, it dropped to the trend line, which is a support line of the pennant too. Price has traded near this line and recently BTC rebounded up. So, I expect that BTCUSDT will correct to the trend line and then rise to the resistance level. After this, I think the price may break it and enter to resistance zone. That's why I set my goal at 108800 points. If you like my analytics you may support me with your like/comment ❤️
2025/06/09 BTCUSDT Raising wedge patternChart is running in rising wedge pattern.
I expect it is break and retest 100K in this week.
Entry at 105k and SL at 107k
TP at 100.x K
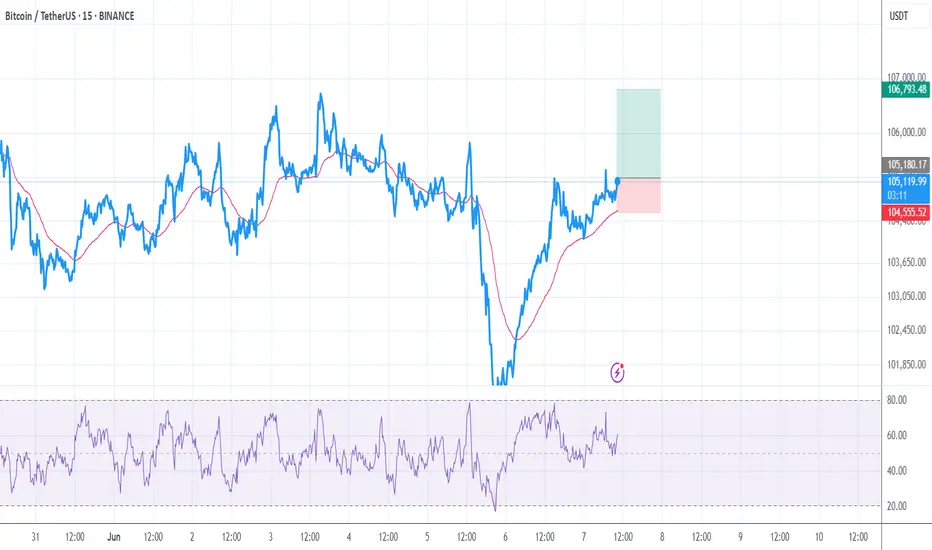
2nd Tiqgpt signal for BTCUSDT todayMARKET NARRATIVE: The analysis of BTC/USD across multiple timeframes reveals a consistent narrative of smart money accumulation and price advancement. Starting from the 1-hour chart, we observe a significant upward movement marked by a series of bullish candles, indicating a strong buying interest. This movement is characterized by the formation of a robust Order Block (OB) around the $106,300 level, which acts as a foundational base for subsequent price ascents.
Drilling down to the 15-minute timeframe, the continuation of bullish sentiment is evident as price action maintains above the previously established 1-hour OB, suggesting sustained institutional buying pressure. The price structure here shows a series of higher highs and higher lows, indicative of a Break of Structure (BOS) to the upside, confirming a bullish market structure shift.
On the 5-minute chart, the granularity increases, and we see more detailed interactions around key liquidity zones. The price action around these zones suggests that smart money is actively managing the ascent, possibly accumulating more positions on minor pullbacks. Each pullback into short-term mitigation blocks is met with a swift response, propelling prices further up.
The 1-minute timeframe provides the closest look at the micro-movements and shows the precision with which institutional players are operating. Notably, there is a slight pullback to a mitigation block near $106,318, which could be an inducement for further buying activity. This level aligns closely with the OBs identified in higher timeframes, reinforcing its significance as a strategic entry point.
INSTITUTIONAL THESIS: The consistent demand across all observed timeframes and the strategic positioning around key OBs suggest that smart money is targeting higher liquidity zones above the current price levels. The intent appears to be to drive prices towards the next significant liquidity pool, potentially around the $107,000 mark, where previous highs and unmitigated OBs converge.
LEARNING POINT: The interaction between multi-timeframe OBs and the execution of trades around these zones exemplifies the smart money concept of using lower timeframe pullbacks to OBs as high-probability entry points in the direction of the prevailing market structure.

FREE MONEY! My next trade ideasNew Week. New Opportunities. 🚀
As we step into the second week of June, we’re fully prepared to take advantage of the markets — with both long 📈 and short 📉 setups ready in advance.
✅ We caught most of the major moves last week — now let’s see if the trading gods 🙏 are on our side again.
📊 Charts are ready — feel free to download them, and drop any trade setups you’re watching in the comments below.
🟠 BTC is on the road to redemption after the SFP at the daily higher low.
Will it break 4H structure? Or reverse back down? Either way, we’re prepared and positioned for both scenarios.
🗓️ This Week’s Schedule:
Classes are expected on Monday, Tuesday, and Friday.
⏰ Exact times TBC — stay tuned.

TradeWithMky — Where Altcoins Speak Louder Than Bitcoin!Welcome, fellow trader, to TradeWithMky — the only TradingView realm where charts are alive, trendlines whisper secrets, and candles burn with prophecy.
Led by Miracle, the pepe-faced meme wizard of TA, we don’t just follow the market — we ride it like a shooting star across the altcoin galaxy 🚀.
💡 Here’s what you’ll unlock inside this spellbook of price action:
🌀 Magic Channels & Trend Spells
🔄 MA50 Rejections & Support Summons
📉 Fakeouts Exposed, Traps Uncovered
📈 Breakouts Blessed by Fibonacci Spirits
🧠 Deep-dive TA with a twist of humor, mystery, and meme-lore
From the shadows of fake breakouts to the light of uptrend awakenings, our charts tell stories — and you are the hero. Whether you're a seasoned wizard or a humble apprentice, here you’ll find something rare:
Real analysis. Real magic. Real fun.
🎯 Targets that work. Levels that matter. A vibe you won’t forget.
👉 Follow now and let Miracle show you why:
@TradeWithMky – Where Altcoins Speak Louder Than Bitcoin!

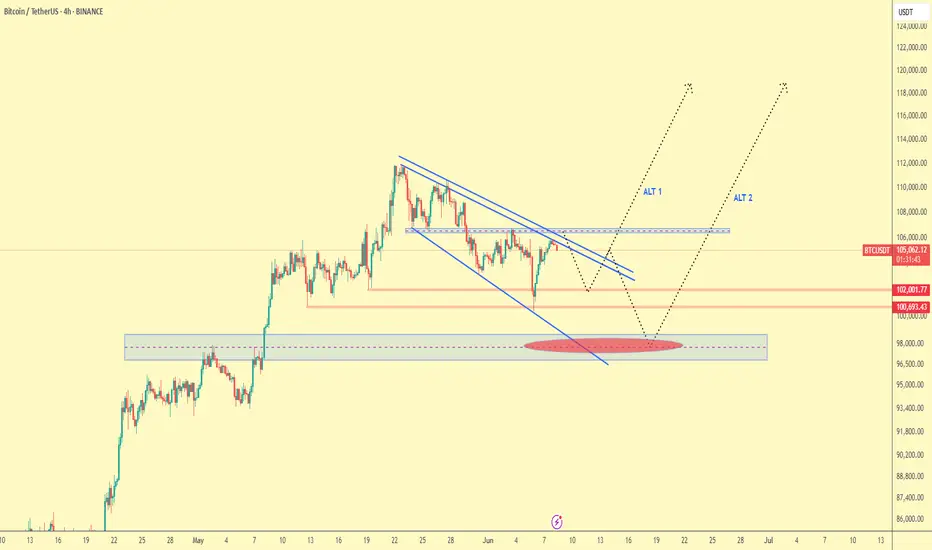
BTC TRrade Plan 08/06/2025Dear Traders,
📊 BTC/USDT 4H Analysis – June 8, 2025
Bitcoin is currently testing the upper boundary of a descending wedge pattern. We are monitoring two main bullish scenarios:
🔹 ALT 1: If the price breaks above the wedge resistance and holds, a continuation towards the $115,000–$120,000 zone is likely. This would confirm the breakout and a potential new bullish leg.
🔹 ALT 2: In case of a rejection from the current resistance, we expect a retracement toward the demand zone around $100,000–$101,600. If price action remains bullish in this zone, this could be a strong re-entry point for long positions.
🟥 Invalidation: A confirmed breakdown and consolidation below $100,000 would invalidate the bullish outlook and open the door to deeper corrections.
⚠️ Wait for confirmation and observe price action in key zones before entering any trades.
if you enjoyed this forecast, please show your support with a like and comment. Your feedback is what drives me to keep creating valuable content."
Regards,
Alireza!
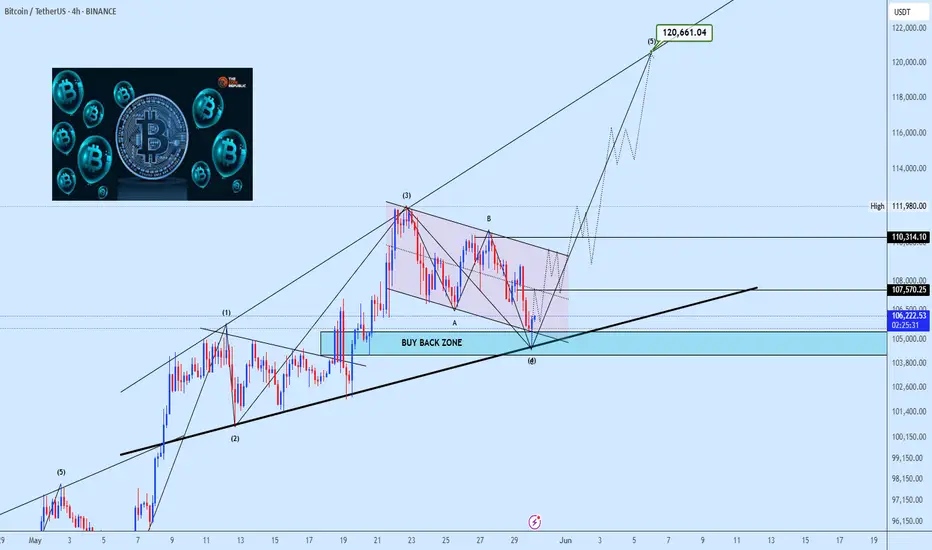
BTCUSDT Technical InsightThe Buy Back Zone is currently serving as a strong demand area and should be closely monitored for informed decision making. This zone has acted firmly as support, providing a solid base for the completion of the wave (4) correction, which concluded precisely at the lower boundary of the descending channel.
We now anticipate the development of a breakout structure within the descending channel (a corrective flag), suggesting the initiation of wave (5) with an upside projection toward $120,661.
A decisive breakout and successful retest above $107,570 will validate bullish momentum and pave the way for continuation towards $110,314, and eventually the $120K zone, aligning with the full extension of the broader impulse wave.
At this stage, patience is key. Allow price action to confirm strength above resistance before committing to aggressive positioning. The bullish market structure remains intact as long as the Buy Back Zone continues to hold.
Feel free to share your thoughts, are you tracking this wave count with us?
Btcusdt 4hr time frameA bearish H&S pattern is forming. Minor and major gaps at 98k and 86.5k still need to be filled, which may delay an all-time high.
Still far from 100 daily ma.

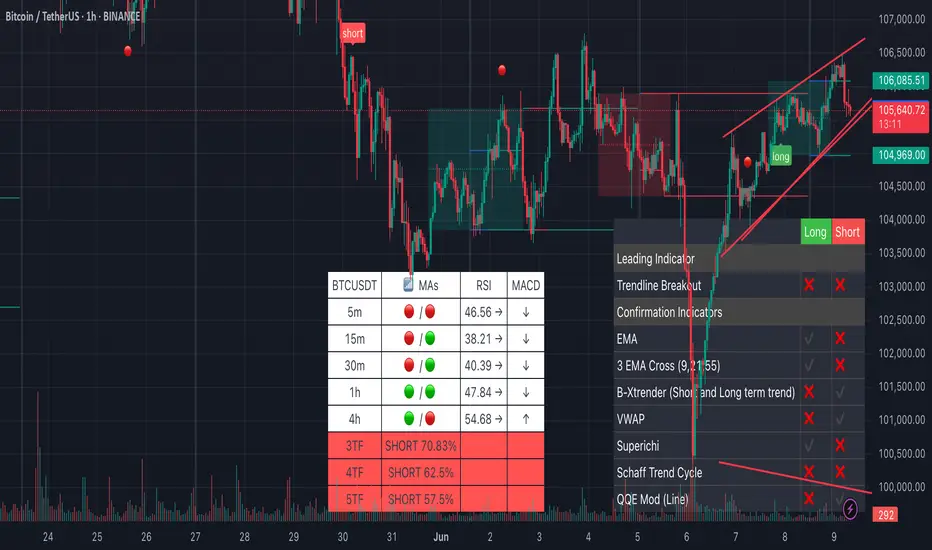
BTC/USDT signal by tiqgptMARKET NARRATIVE: Analyzing the provided charts for Bitcoin against Tether (BTC/USDT) across multiple timeframes (1H, 15M, 5M, 1M), we observe a consistent narrative of price action that reveals the strategic maneuvers of institutional players. Starting with the 1H timeframe, the price displays a descending pattern, marked by a series of lower highs and lower lows, indicative of a dominant bearish market structure. This is further validated by the presence of descending mitigation blocks, which have been revisited but not significantly breached, suggesting a lack of buying interest at these levels.
Descending into the 15M and 5M charts, we see a more granular view of the bearish sentiment, with price action creating tight consolidation zones below previous mitigation blocks, signaling potential accumulation by smart money before further downward movement. The 1M chart offers the most detailed view, showing multiple liquidity sweeps below recent lows, which likely serve as inducements to trap retail traders into unfavorable positions before a potential expansion phase.
INSTITUTIONAL THESIS: The consistent bearish structure across all timeframes suggests that smart money is potentially targeting lower liquidity pools below the current price levels. The repeated liquidity sweeps and the formation of tight consolidation zones below mitigation blocks indicate a preparation phase for a further push downwards. This strategic positioning by institutional players aims to capitalize on induced retail selling pressure, allowing for accumulation at premium prices before a likely bearish continuation.

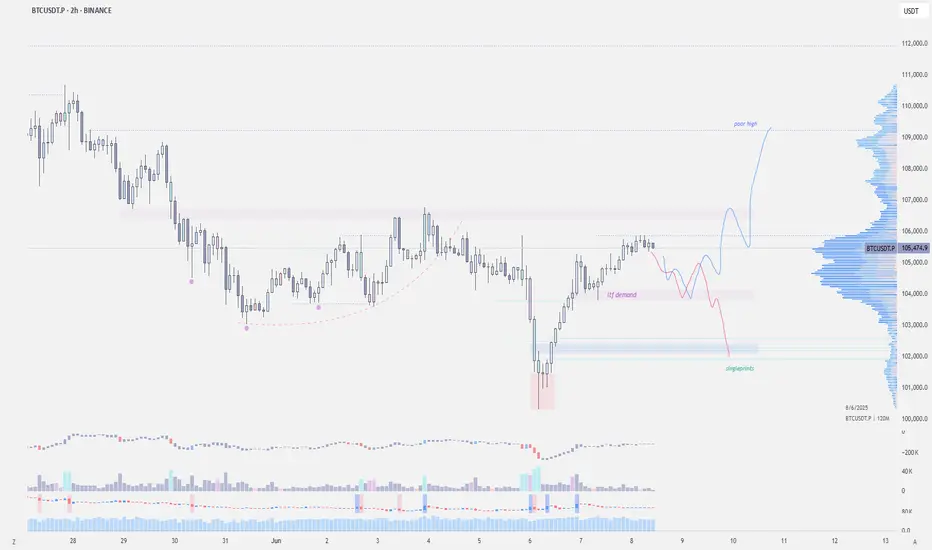
$BTC - LTF OutlookCRYPTOCAP:BTC | 2h
We got that push toward 105.8k retesting ltf immediate supply.
There's local demand around 104.2k–103.8k — if it holds, altcoins should run.
Otherwise, there's still a possibility we fill some imbalances below at 102k area
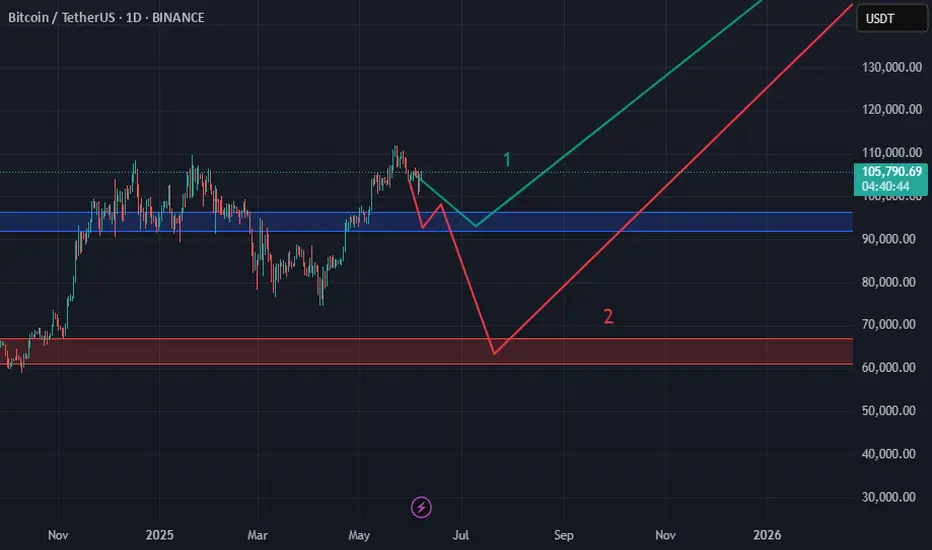
two senarios for btc/usdthere we have two movement for bitcoin that 1 can raised the price over 150k and the two can arrive the price near 180k

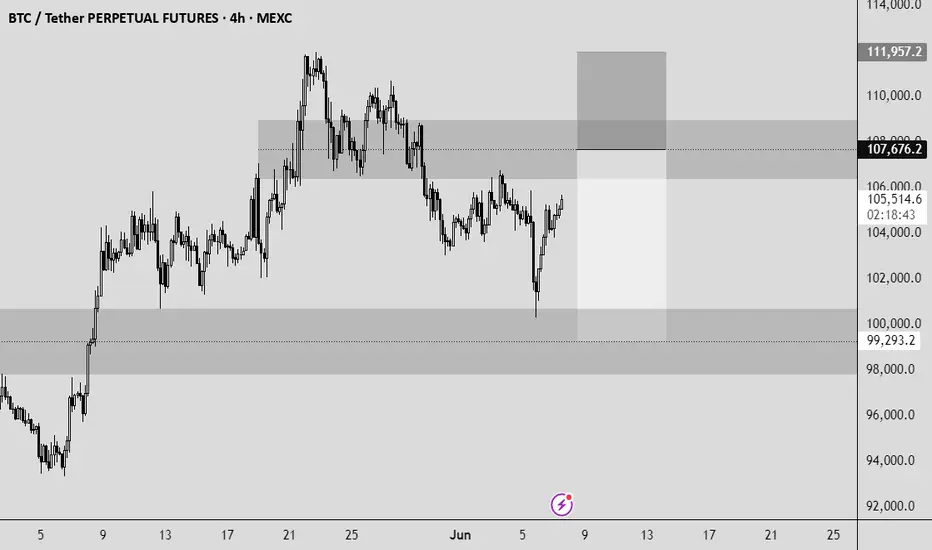
BTC short I expect the price to go up during the weekend and tap into the Weekly orderblock I marked up on the chart at from there I would like to go short and take profits at EQ of weekly gap.
TP:99293.2
SL:111957.2
Entry:107676.2
GLHF, do not overleverage!

Technical analysis of BTC contracts (outlook for next week)Technical analysis of BTC contract on June 7 (next week outlook):
The weekly trend, after the price hit the high point of 112000 area, it retreated under pressure. The current K-line pattern is negative, but the price is still at a high level, which also exacerbates the overall trend of volatility. The daily price was fluctuating downward before Friday. The impact of yesterday's data caused the price to rise, which seemed to break this trend, and it also became contradictory. The technical indicators of the four-hour chart and the hourly chart changed very quickly, and there was no reference signal for the medium and long term; in general, the current trend will continue the oscillating pattern, with the upper pressure position in the 107000 area and the low point support position in the 100600 area;