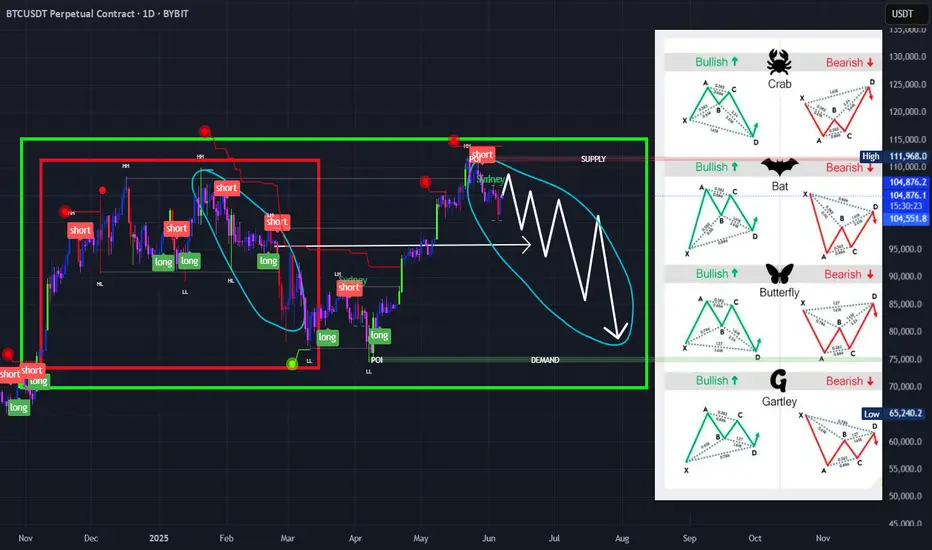
BTC harmonic patterns BITSTAMP:BTCUSD If you look on red rectangle there's similiar pattern to this forming on big green rectangle suggesting the same downward movement soon
BTCUSDT.P trade ideas
BTC: Strong bullish trend, key resistance 111–112k in focus__________________________________________________________________________________
Technical Overview – Summary Points
__________________________________________________________________________________
Strong bullish momentum across all timeframes (1D to 15min).
Major supports: 100335, 104940, 106743 – multi-timeframe confluence, natural risk management levels.
Key resistances: 109952 – 111949 (historical pivot zones).
Risk On / Risk Off Indicator clearly favoring "Risk On" (strong buy). Tech sector in leadership mode, favorable context.
Volumes normal to moderately elevated, no major behavioral anomalies (ISPD DIV neutral).
No significant divergence between technical and behavioral indicators detected.
__________________________________________________________________________________
Strategic Summary
__________________________________________________________________________________
Overall bias : firmly bullish, but tactical caution just below 111,000–112,000.
Opportunities : prioritize buys/reloads on pullbacks to 104,900–100,300.
Risk zones : clean break below 103.7k ⇒ risk of acceleration to 95.6k; invalidation if daily close <103,700$ or >2 sessions <97,100$.
Macro catalysts : Fed decision (06/18), US CPI (06/12), Trump speech (06/10); anticipate higher volatility.
Action plan : engage tactically below resistance; recommended swing stop-loss at $97,000; active management after each catalyst event.
__________________________________________________________________________________
Multi-Timeframe Analysis
__________________________________________________________________________________
1D : Massive support 100k-103k, critical resistance 111–112k. Robust momentum and context, no behavioral overheating.
12H : Steady staircase progression, intermediate supports respected (104940–106743), healthy volumes, ongoing up-trend.
6H : Bullish background, no excessive flow or defensive behavioral signals.
4H : Resistance zone test (111949–109952), structure remains solidly up, no reversal detected.
2H : Slightly rising volumes on resistance test, no behavioral excess. Positive momentum.
1H : Active resistance test, moderate volumes. Bullish structure intact.
30min : Micro-consolidation below resistance, no excessive volume/behavior. Trend up.
15min : Volume spike on last upward move, rapid normalization. Reload possible if breakout above 110k is confirmed.
Multi-timeframe summary : Bullish confluence, no strong reversal signal as long as support at 103.7k holds.
Risk On / Risk Off Indicator : Strong buy, tech sector leading, no structural risk detected in capital rotation.
__________________________________________________________________________________
Synthesis & Decision-Making
__________________________________________________________________________________
Dominant structure : BTC market structurally bullish, supported by multi-timeframe converging supports and solid tech sector.
No behavioral anomaly (ISPD DIV neutral); volumes under control; only vigilance below 111–112k due to matured seller pressure.
Macro context : Fed’s rates unchanged expected, major catalysts nearing with potential for significant volatility.
On-chain analysis : active distribution from long-term holders, critical area 103.7k–97.1k, demand must absorb “long-duration” supply.
Trading recommendation : favor buys/reloads on pullback (104,900–100,300); tactical caution under 111–112k; swing stop-loss at $97,000 advised.
BTC structurally bullish, but approaches a critical phase: robust multi-timeframe supports, positive macro momentum, no excessive behavioral exuberance. Heightened vigilance required below 111–112k due to pressure from long-term holders; dynamic risk management needed around major macro events.
__________________________________________________________________________________

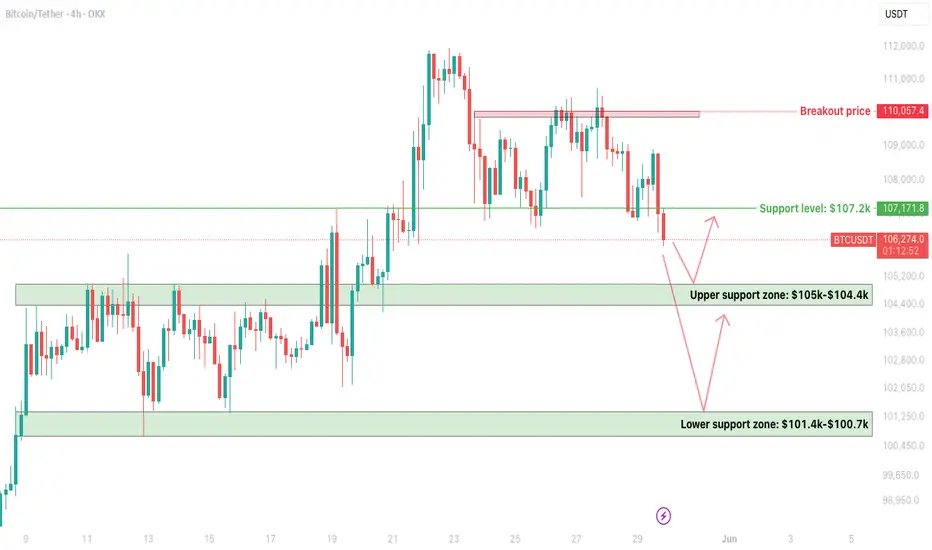
BTC 4H – Critical Support Zones Being TestedCRYPTOCAP:BTC is currently retesting its $107.2k support, which has now turned into resistance after a decisive breakdown.
Support Levels to Watch:
- Upper Support Zone: $105k – $104.4k
- Lower Support Zone: $101.4k – $100.7k
Bounce from $104.4k–$105k will be a temporary relief, but it needs strength to reclaim $107.2k.
If the upper zone is not held, the next leg will be towards the lower zone, near $101.4k—$100.7k.
Breakout confirmation only above $110k (previous rejection zone).
The market is showing signs of weakness, especially with increased selling around resistance. Avoid rushing into trades—better setups may come if key zones hold or break.
Tip: Watch for bullish divergences or strong volume at the lower support for potential reversal setups.
Lets see how this goes with NFPStill a rookie though so I thought I should share my idea for a pro to help out.

BTCUSDT UPDATEBitcoin's likely move scares me. Let's be careful. Bitcoin dominance could also move with this decline.
Bitcoin (BTC) Technical Analysis and Trading Strategy
Daily Level
Price Structure: Last week, it fell to 100,000 points and did not break the support. Then it returned to the horizontal adjustment range, but it was still suppressed by the downward trend line above, and the overall high-level decline structure was maintained.
K-line pattern: The two consecutive days of closing cross stars showed that the long-short game intensified, but there was no clear direction.
Momentum indicator: RSI continued to shrink, indicating that short-term momentum weakened, and attention should be paid to breakthrough signals.
4-hour level
Key resistance: 106,700 (horizontal channel top + downward trend line bonding pressure), breaking through is expected to test the 110,000 mark.
Key support: 103,500 (range bottom), 101,000 (strong support), if it falls below, it may form a head and shoulders top structure, and further look down to 97,600 (previous step support).
Short-term trading strategy
Short order opportunity
Entry area: 106,000-106,700
Stop loss: 108,000 (short order invalidated after trend line breakthrough)
Target: 103,500 → 101,000
Long order observation point
If the price stabilizes above 106,700, you can wait for confirmation of the retracement before arranging long orders, with a target of 110,000.
If it stabilizes at 101,000-103,500, you can consider short-term rebound trading.
Key trend judgment
Break above 106,700 → Continue to adjust upward and test 110,000.
Break below 103,500 → Confirm the head and shoulders top, target 97,600.
Range oscillation (103,500-106,700) → Wait for a breakthrough signal.
(Risk warning: Pay attention to changes in market liquidity and the impact of macro data, and strictly stop loss.)

$BTC Bulls BackCRYPTOCAP:BTC is breaking out of a descending channel after a healthy pullback from the $ 112,000–$ 114,000 resistance zone.
Strong demand at $ 102,000–$ 104,000 supported the bounce, with buyers now pushing prices higher.
A clean breakout above $106K could open the path to retest $112K+.
The $102K–$104K zone remains key support as long as BTC holds above it, the short-term bias stays bullish.
DYRO, NFA
Hanzo / BTC 15 Min ( Accurate Tactical Bullish Retest )🔥 BTC – 15 Min Scalping Analysis (Bearish Setup)
⚡️ Objective: Precision Breakout Execution
Time Frame: 15-Minute Warfare
Entry Mode: Only after verified breakout — no emotion, no gamble.
👌Bullish After Retest : 107000
Price must break liquidity with high volume to confirm the move.
☄️ Hanzo Protocol: Dual-Direction Entry Intel
➕ Zone Activated: Strategic liquidity layer detected — mapped through refined supply/demand mechanics. Volatility now rising. This isn’t noise — this is bait for the untrained. We're not them.
🩸 Momentum Signature Detected:
Displacement candle confirms directional intent — AI pattern scan active.
— If upward: Bullish momentum burst.
— If downward: Aggressive bearish rejection.
🦸♂️ Tactical Note:
The kill shot only comes after the trap is exposed and volume betrays their position.

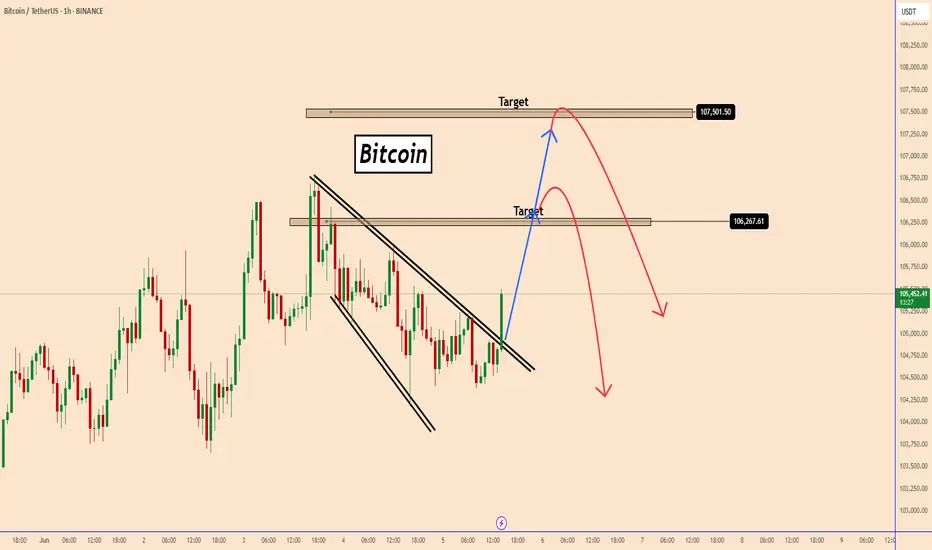
BTC: Short-Term Bullish Setup - Raising to 107.5k ?BTC: Short-Term Bullish Setup - Raising to 107.5k ?
On the 60-minute chart, Bitcoin has initiated a bullish movement, with a clear breakout and strong upward momentum.
BTC is expected to retest the top of the structure, where it may face resistance and potentially decline again. If the pattern unfolds as anticipated, Bitcoin could extend its bullish rally to 107.5K.
This movement appears to be influenced by several factors, though overall, market conditions have remained unchanged throughout the week.
Today’s price action reflects a technical shift rather than a fundamental development.
You may find more details in the chart!
Thank you and Good Luck!
❤️PS: Please support with a like or comment if you find this analysis useful for your trading day❤️
4 hour 3:1 bear target madeScaling out at multiple targets increases the odds of taking some profit.
The 3:1 target got made already.
There’s a measured move that is in play - which is also near an intersecting line target.
The bearish Wolfewave 1-4 line is still also in play.

BTC/USDT Technical Analysis, 2025-06-03 22:30 UTC✅ Bullish Reversal Confirmed
Breakout from a descending wedge with a strong volume surge (3x avg)
EMA(20) crossover above EMA(50) – early uptrend signal
RSI(14) at 58.7 – shows healthy bullish momentum
MACD turning positive with a fresh signal line crossover
OBV rising in line with price – confirms genuine accumulation
🔍 Smart Money Activity
Whale bid zone spotted between $105,500–$105,600 (visible in DOM)
Breakout aligns with London session high, adding sessional strength
🧠 Technical Confluence
This move combines structure, momentum, and volume — classic signs of a trend reversal and early entry opportunity. Chart markups include the wedge breakout zone, whale bids, EMA cross, and Fibonacci levels for context.
📈 Watching for potential continuation if current momentum sustains. Clean setup backed by technicals and smart money presence.

BTC HTF HL Could Be InI can have all my opinions about how this low can't be the HTF HL but who am I to say this? I should keep it in the back of my mind but I shouldn't let it hinder me from entering new trades/investments.
I spent too much time speculating on how I think it should look instead of just keeping it simple and just think about how it looks in the moment. It cost me missing the up-move from ~85k-100k.
I think of trading vs investing, LTF trades vs HTF trend while I should just scrap the HTF trend as this causes me to go on a speculation trip and I lose track of what's in front of me in the moment.
-------------------------------
What I think is in front of me right now:
Let's start with that MS is king. This up-move is caused by the fact that price got above the structure of 29 March-5 April, without any significant PA. It just got above it and stayed above it and pushed out above it.
That's enough evidence to me that I shouldn't necessarily wait for a big SFP, on the 15min TF or 1D. Or that I shouldn't wait for a big 15min engulfing candle. This is just proof as price has pushed all the way back to 100k.
Then,
The blue box was the resistance and the level below it (95k spike) was the main level. The top of this level was maximal resistance. Here I expected (=speculated) that price would be capped and go back to 74k. I expected price to close above the level but that the new structure formed around the level would provide a short (like a SFP and then a MSB).
But this didn't happen. Price pushed above the resistance. So that's how it now is: there's no resistance. Just like in april when price got above the 29 March-5 April structure with main level of structure being the high of 4 April.
And then to add: in current structure price has closed above the main level of that structure on the 1D: the high of 12 May. This is good.
Also: there's no 15min SFP at the current highs and the MSB failed (price pushed back up).
Also: there's a clean level for the long SFP: 12 May low.
Conclusion: if price breaks down from here without going back to these highs, price could be capped at the long SFP-level of 100k. And given the (I think) fact that there's no resistance and MS is king, this is the right level to enter the long in spot BTC.
So that's what I'm going to do. Might enter the trade too (perps) if price indeed SFP's this level.
-----------------------------
If price doesn't hold the 100k level, I don't think price can drop further than the 74k low so that's the potential downside (I don't sell spot if there's no short setup) I keep in mind.

$BTC similar pattern to early 2024CRYPTOCAP:BTC possible same scenario playing out. Similar pattern, liquidity grab long and short is done. Possible now is time to push higher. Idk what catalyst would push price higher, no rate cut in june. Perhaps tariff settlement.
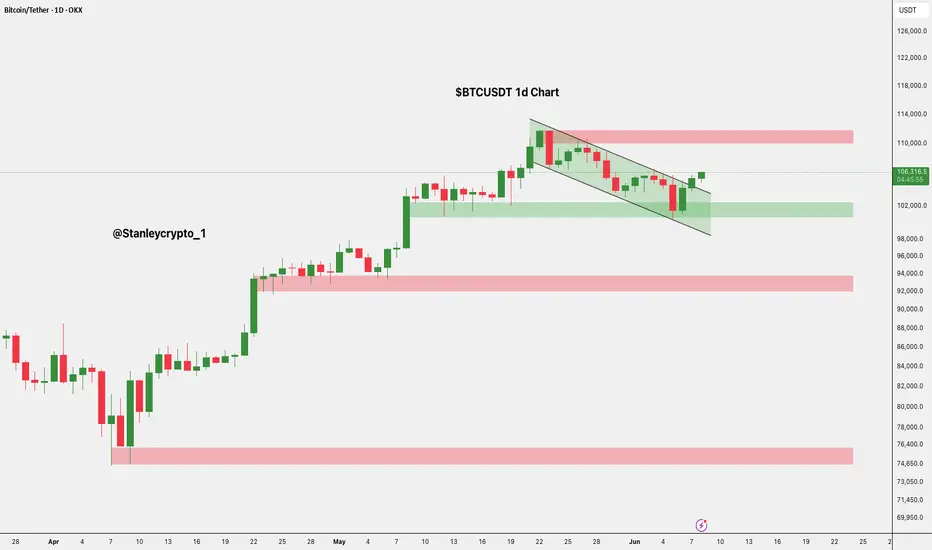
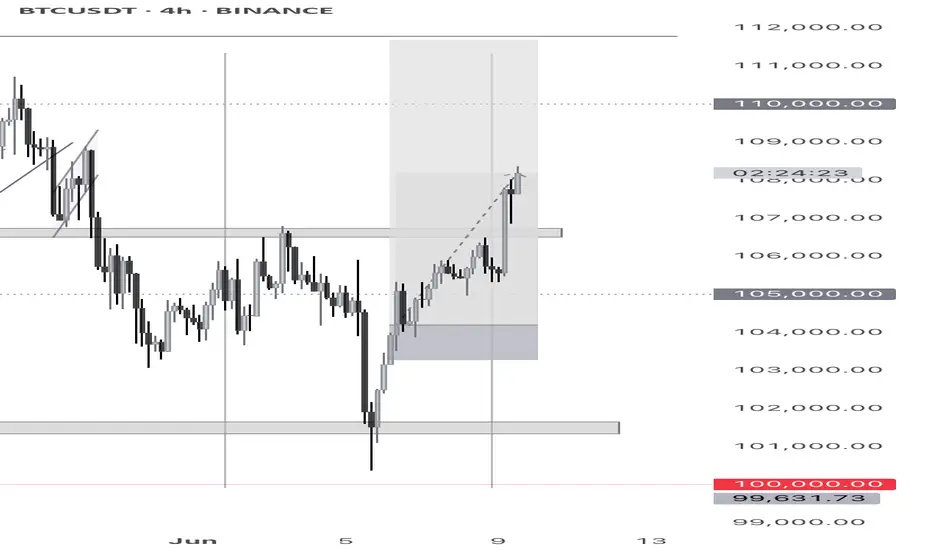
HolderStat┆BTCUSD springs from 100k railAfter a week-long pullback, CRYPTOCAP:BTC ricochets off 100 k support, keeping the rising-channel narrative alive. Bitcoin price now squeezes beneath a descending trendline; a daily close over 109 k could unleash a breakout toward the 112-114 k resistance shelf.
BTC on the riseThere is no correction at this point; BTC wants to go higher. The next resistance lies around 109k.

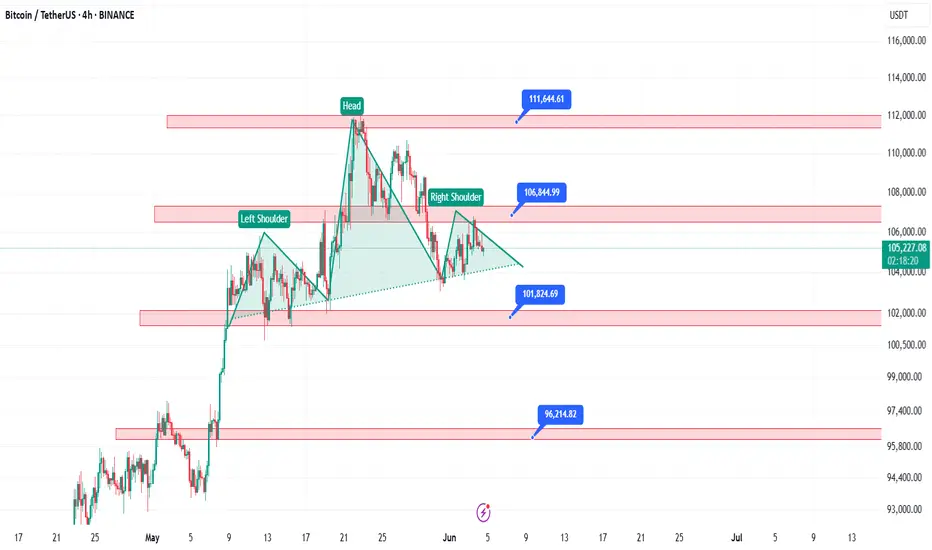
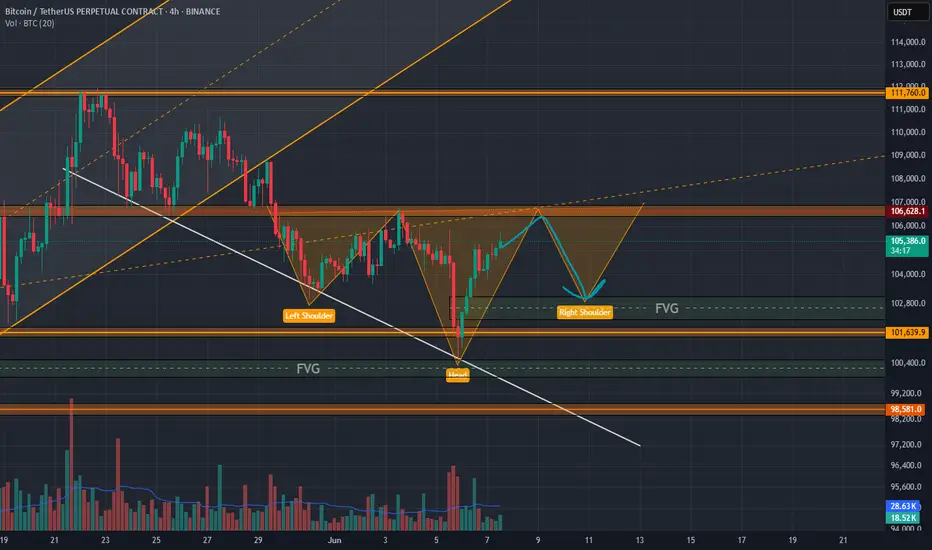
BTC can make an reverse head and shouldersBINANCE:BTCUSDT.P
İf btc take a reversal from 106.500 area, we can see a head and shoulders pattern. And if the pattern completed, we can see a new Ath in btc.
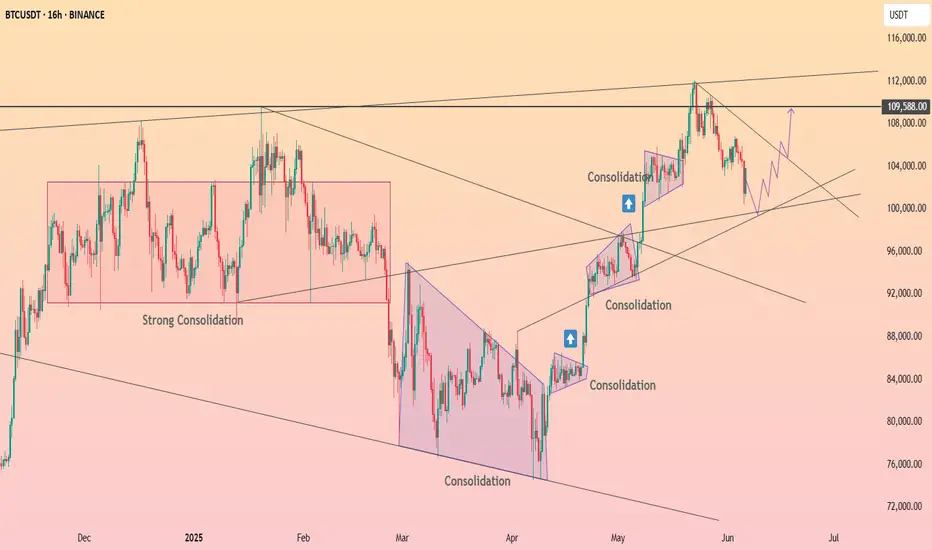
BTC — Compression Into Downtrend Line, Key Demand Zone BelowPrice is compressing into a macro descending trendline, with recent strength off the $101.4k key demand zone. Structure shows potential for continued chop before a proper breakout or rejection decision is made.
🟩 Key Demand Zone: $101,300–101,800
• Previous strong reaction area
• Aggressive bids expected here again if retested
• Still valid while above — structure remains intact
📉 Trendline Resistance: ~$105.5k
• Critical compression point
• Watch for reaction here — breakout = bullish trigger
• Rejection = likely continuation of chop or lower retest
🔁 Playbook:
Rejection from trendline → range & chop → sweep demand
Clean breakout above = targeting $107k+
Deep flush back into $99–101k zone = buy opportunity
📌 Compression into major levels sets up explosive follow-through — either way, volatility incoming.

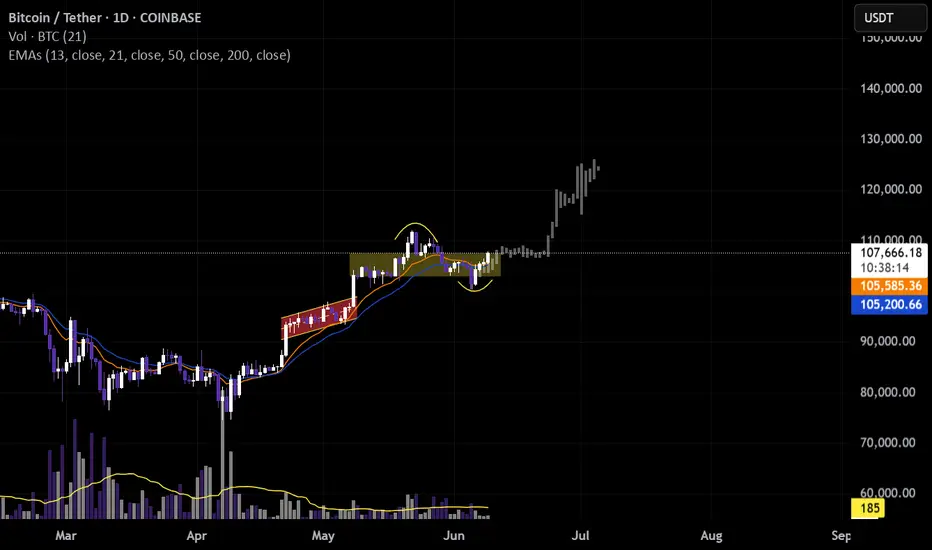
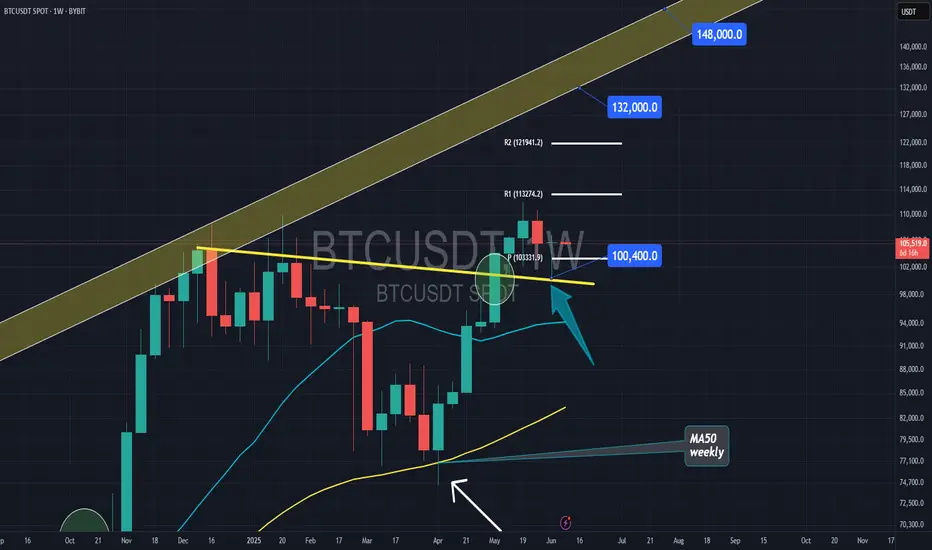
Bitcoin above the supportBitcoin back tested the important yellow resistance on weekly and closed a hammer candle above the pivot.
I wont be surprise to see $130k in couple of weeks.
Bitcoin Prediction - WARNING - Short Set-up Looming? We are spectating something serious on Bitcoin looming right now! Confirmations explained in the video!

It didn’t reject. It repriced.BINANCE:BTCUSDT just tested the 4H OB at 105,044 — and didn’t break. That’s not weakness. That’s precision. The kind of structure Smart Money doesn’t chase, it absorbs.
Here’s the breakdown:
Price retraced into a clean OB off the 0.236 fib, holding structure without even needing to sweep the BPR below
Volume supported the move — no absorption, no deviation
Short-term high is now marked at 106,487, and above that, my next draw is 108,941
If price closes back above 106,000 with momentum, the path of least resistance is clear: continuation. If we lose the OB and reclaim fails, BPR becomes the fallback zone — anything deeper, and we’re re-evaluating the narrative.
Execution plan:
Long from OB (already tested) — continuation depends on reclaiming 106K
TP1: 106,689
TP2: 108,941
Invalidation: 103,429 (50% fib) or hard break into 102.7 BPR
There’s no “maybe” in structure. Price is either reacting or it isn’t. This one is.
Setups this precise don’t wait — they’re mapped. You’ll find more in the profile description.

BTC Divergence formingBollinger Bands 89 SMA (3D Chart)
Median trajectory is 120 Days back to
all-time high of $112k
... price will gravitate back to median
RSI is 65.78, still has room to go higher but
look at Divergence

BTC: Decision Time Ahead! A Quick Update!!Hey Traders!
If you’re finding value in this analysis, smash that 👍 and hit Follow for high-accuracy trade setups that actually deliver!
Bitcoin is once again testing the descending trendline resistance on the 4H chart.
We're currently at a make-or-break level:
A clear breakout above the trendline could trigger a bullish move toward $110K+
A rejection here might push BTC back to the $100K–$98K support zone
📍The green zone remains key — last time, it held as strong support.
But without a breakout above $106.5K, bulls are on the defensive.
Watch price action closely here — the next big move could start from this very point.
What’s your take? Bullish breakout or another dump loading?
